Prospectus
February 28, 2023
DFA INVESTMENT DIMENSIONS GROUP INC. / DIMENSIONAL INVESTMENT GROUP INC.
INTERNATIONAL
|
|
|
|
|
|
|
Large Cap
International Portfolio (DFALX) |
Continental
Small Company Portfolio (DFCSX) |
World Core
Equity Portfolio (DREIX) |
Institutional Class
Shares
This Prospectus describes the Institutional Class shares of each
Portfolio which:
Are for long-term investors.
Are generally available only
to institutional investors and clients of registered investment advisors.
Do
not charge sales commissions or loads.
The Securities and Exchange Commission has not approved or disapproved these securities or passed upon the adequacy of this Prospectus. Any representation to the contrary is a criminal offense.
|
|
|
| |||||
|
|
|
1 |
|||||
|
|
|
1 |
|||||
|
|
|
1 |
|||||
|
|
|
1 |
|||||
|
|
|
2 |
|||||
|
|
|
3 |
|||||
|
|
|
4 |
|||||
|
|
|
5 |
|||||
|
|
|
5 |
|||||
|
|
|
5 |
|||||
|
|
|
6 |
|||||
|
|
|
6 |
|||||
|
|
|
6 |
|||||
|
|
|
7 |
|||||
|
|
|
8 |
|||||
|
|
|
9 |
|||||
|
|
|
10 |
|||||
|
|
|
10 |
|||||
|
|
|
10 |
|||||
|
|
10 |
||||||
|
|
11 |
||||||
|
|
11 |
||||||
|
|
11 |
||||||
|
|
11 |
||||||
|
|
12 |
||||||
|
|
14 |
||||||
|
|
15 |
||||||
|
|
15 |
||||||
|
|
15 |
||||||
|
|
16 |
||||||
|
|
17 |
||||||
|
|
17 |
||||||
|
|
17 |
||||||
|
|
18 |
||||||
|
|
19 |
||||||
|
|
21 |
||||||
|
|
22 |
||||||
i
|
|
|
| |||||
|
|
23 |
||||||
|
|
23 |
||||||
|
|
23 |
||||||
|
|
24 |
||||||
|
|
24 |
||||||
|
|
24 |
||||||
|
|
25 |
||||||
|
|
26 |
||||||
|
|
27 |
||||||
|
|
28 |
||||||
|
|
29 |
||||||
|
|
29 |
||||||
|
|
29 |
||||||
|
|
30 |
||||||
|
|
30 |
||||||
|
|
30 |
||||||
|
|
31 |
||||||
|
|
32 |
||||||
|
|
33 |
||||||
|
|
34 |
||||||
|
|
35 |
||||||
|
|
35 |
||||||
|
|
35 |
||||||
|
|
36 |
||||||
|
|
36 |
||||||
|
|
36 |
||||||
|
|
37 |
||||||
|
|
38 |
||||||
|
|
39 |
||||||
|
|
40 |
||||||
|
|
41 |
||||||
|
|
41 |
||||||
|
|
41 |
||||||
|
|
42 |
||||||
|
|
42 |
||||||
|
|
42 |
||||||
|
|
43 |
||||||
|
|
44 |
||||||
ii
|
|
|
| |||||
|
|
45 |
||||||
|
|
46 |
||||||
|
|
47 |
||||||
|
|
47 |
||||||
|
|
47 |
||||||
|
|
48 |
||||||
|
|
48 |
||||||
|
|
48 |
||||||
|
|
49 |
||||||
|
|
50 |
||||||
|
|
51 |
||||||
|
|
52 |
||||||
|
|
53 |
||||||
|
|
53 |
||||||
|
|
53 |
||||||
|
|
54 |
||||||
|
|
54 |
||||||
|
|
54 |
||||||
|
|
54 |
||||||
|
|
55 |
||||||
|
|
57 |
||||||
|
|
58 |
||||||
|
|
58 |
||||||
|
|
58 |
||||||
|
|
59 |
||||||
|
|
60 |
||||||
|
|
60 |
||||||
|
|
60 |
||||||
|
|
61 |
||||||
|
|
62 |
||||||
|
|
63 |
||||||
|
|
64 |
||||||
|
|
65 |
||||||
|
|
65 |
||||||
|
|
65 |
||||||
|
|
66 |
||||||
|
|
66 |
||||||
|
|
66 |
||||||
iii
|
|
|
| |||||
|
|
66 |
||||||
|
|
68 |
||||||
|
|
69 |
||||||
|
|
70 |
||||||
|
|
70 |
||||||
|
|
70 |
||||||
|
|
70 |
||||||
|
|
71 |
||||||
|
|
71 |
||||||
|
|
71 |
||||||
|
|
71 |
||||||
|
|
73 |
||||||
|
|
74 |
||||||
|
|
75 |
||||||
|
|
75 |
||||||
|
|
75 |
||||||
|
|
76 |
||||||
|
|
77 |
||||||
|
|
77 |
||||||
|
|
77 |
||||||
|
|
77 |
||||||
|
|
78 |
||||||
|
|
79 |
||||||
|
|
81 |
||||||
|
|
81 |
||||||
|
|
81 |
||||||
|
|
81 |
||||||
|
|
82 |
||||||
|
|
82 |
||||||
|
|
82 |
||||||
|
|
83 |
||||||
|
|
84 |
||||||
|
|
86 |
||||||
|
|
87 |
||||||
|
|
87 |
||||||
|
|
87 |
||||||
|
|
88 |
||||||
iv
|
|
|
| |||||
|
|
89 |
||||||
|
|
89 |
||||||
|
|
89 |
||||||
|
|
89 |
||||||
|
|
90 |
||||||
|
|
92 |
||||||
|
|
93 |
||||||
|
|
94 |
||||||
|
|
94 |
||||||
|
|
94 |
||||||
|
|
95 |
||||||
|
|
95 |
||||||
|
|
95 |
||||||
|
|
96 |
||||||
|
|
97 |
||||||
|
|
98 |
||||||
|
|
99 |
||||||
|
|
100 |
||||||
|
|
100 |
||||||
|
|
100 |
||||||
|
|
101 |
||||||
|
|
101 |
||||||
|
|
101 |
||||||
|
|
102 |
||||||
|
|
103 |
||||||
|
|
105 |
||||||
|
|
106 |
||||||
|
|
106 |
||||||
|
|
106 |
||||||
|
|
107 |
||||||
|
|
108 |
||||||
|
|
108 |
||||||
|
|
108 |
||||||
|
|
109 |
||||||
|
|
110 |
||||||
|
|
111 |
||||||
|
|
112 |
||||||
|
|
113 |
||||||
v
|
|
|
| |||||
|
|
113 |
||||||
|
|
113 |
||||||
|
|
114 |
||||||
|
|
114 |
||||||
|
|
114 |
||||||
|
|
115 |
||||||
|
|
116 |
||||||
|
|
117 |
||||||
|
|
118 |
||||||
|
|
119 |
||||||
|
|
119 |
||||||
|
|
119 |
||||||
|
|
120 |
||||||
|
|
120 |
||||||
|
|
120 |
||||||
|
|
120 |
||||||
|
|
121 |
||||||
|
|
123 |
||||||
|
|
124 |
||||||
|
|
125 |
||||||
|
|
125 |
||||||
|
|
125 |
||||||
|
|
126 |
||||||
|
|
126 |
||||||
|
|
126 |
||||||
|
|
127 |
||||||
|
|
128 |
||||||
|
|
130 |
||||||
|
|
131 |
||||||
|
|
131 |
||||||
|
|
131 |
||||||
|
|
131 |
||||||
|
|
132 |
||||||
|
|
132 |
||||||
|
|
132 |
||||||
|
|
132 |
||||||
|
|
133 |
||||||
|
|
135 |
||||||
vi
|
|
|
| |||||
|
|
136 |
||||||
|
|
137 |
||||||
|
|
137 |
||||||
|
|
137 |
||||||
|
|
138 |
||||||
|
|
138 |
||||||
|
|
138 |
||||||
|
|
139 |
||||||
|
|
139 |
||||||
|
|
141 |
||||||
|
|
142 |
||||||
|
|
143 |
||||||
|
|
143 |
||||||
|
|
143 |
||||||
|
Additional Information on Investment Objectives and Policies |
|
144 |
|||||
|
|
144 |
||||||
|
|
144 |
||||||
|
|
144 |
||||||
|
|
145 |
||||||
|
|
146 |
||||||
|
|
147 |
||||||
|
|
148 |
||||||
|
|
149 |
||||||
|
|
150 |
||||||
|
|
151 |
||||||
|
|
152 |
||||||
|
|
152 |
||||||
|
|
154 |
||||||
|
|
154 |
||||||
|
|
155 |
||||||
|
|
156 |
||||||
|
|
157 |
||||||
|
|
157 |
||||||
|
|
158 |
||||||
|
|
159 |
||||||
|
|
160 |
||||||
|
|
161 |
||||||
|
|
162 |
||||||
vii
|
|
|
| |||||
|
|
163 |
||||||
|
|
164 |
||||||
|
|
165 |
||||||
|
|
168 |
||||||
|
|
170 |
||||||
|
|
171 |
||||||
|
|
172 |
||||||
|
|
172 |
||||||
|
|
180 |
||||||
|
|
180 |
||||||
|
|
181 |
||||||
|
|
181 |
||||||
|
|
182 |
||||||
|
|
182 |
||||||
|
|
185 |
||||||
|
|
188 |
||||||
|
|
188 |
||||||
|
|
193 |
||||||
|
|
197 |
||||||
|
|
197 |
||||||
|
|
198 |
||||||
|
|
199 |
||||||
|
|
201 |
||||||
|
|
201 |
||||||
|
|
203 |
||||||
|
|
204 |
||||||
|
|
204 |
||||||
|
|
204 |
||||||
|
|
205 |
||||||
|
|
205 |
||||||
|
|
206 |
||||||
|
|
207 |
||||||
|
|
207 |
||||||
|
|
207 |
||||||
The investment objective of the Large Cap International Portfolio (the “Portfolio”) is to achieve long-term capital appreciation.
This table describes the fees and expenses you may pay if you buy, hold or sell shares of the Large Cap International Portfolio. You may pay other fees, such as brokerage commissions and other fees to financial intermediaries, which are not reflected in the table and Example below.
year as a percentage of the value of
your investment)
|
|
|
|
|
Management Fee |
| |
|
| ||
|
Other Expenses |
| |
|
| ||
|
Total Annual Fund Operating Expenses |
| |
|
| ||
This Example is meant to help you compare the cost of investing in the Large Cap International Portfolio with the cost of investing in other mutual funds. The Example assumes that you invest $10,000 in the Portfolio for the time periods indicated. The Example also assumes that your investment has a 5% return each year and that the Portfolio’s operating expenses remain the same. Although your actual costs may be higher or lower, based on these assumptions your costs would be:
|
|
|
|
|
|
|
|
|
1 Year |
3 Years |
5 Years |
10 Years | |||
|
$ |
$ |
$ |
$ | |||
|
| ||||||
The Large Cap International
Portfolio pays transaction costs, such as commissions, when it buys and sells
securities (or “turns over” its portfolio). A higher portfolio turnover may
indicate higher transaction costs and may result in higher taxes when Portfolio
shares are held in a taxable account. These costs, which are not reflected in
Annual Fund Operating Expenses or in the Example, affect the Portfolio’s
performance. During the most recent fiscal year, the Portfolio’s portfolio
turnover rate was
To achieve the Large Cap International Portfolio’s investment objective, Dimensional Fund Advisors LP (the “Advisor”) implements an integrated investment approach that combines research, portfolio design, portfolio management, and trading functions. As further described below, the Portfolio’s design emphasizes long-term drivers of expected returns identified by the Advisor’s research, while balancing risk through broad diversification across companies and sectors. The Advisor’s portfolio management and trading processes further balance those long-term drivers of expected returns with shorter-term drivers of expected returns and trading costs.
1
The Large Cap International Portfolio is designed to purchase securities of large non-U.S. companies in countries or regions designated by the Advisor as an approved market for investment. The Advisor may consider a company’s size, relative price, and/or profitability relative to other eligible companies when making investment decisions for the Portfolio. An equity issuer is considered to have a low relative price (i.e., a value stock) primarily because it has a low price in relation to its book value. In assessing relative price, the Advisor may consider additional factors such as price to cash flow or price to earnings ratios. An equity issuer is considered to have high profitability because it has high earnings or profits from operations in relation to its book value or assets. The criteria the Advisor uses for assessing relative price and profitability are subject to change from time to time. The Advisor will seek to set country weights based on the relative adjusted market capitalizations of eligible large companies within each eligible country.
The Large Cap International Portfolio intends to purchase securities of large non-U.S. companies associated with developed market countries that the Advisor has designated as approved markets. As a non-fundamental policy, under normal circumstances, the Portfolio will invest at least 80% of its net assets in securities of large cap companies in the particular markets in which the Portfolio invests. The Advisor determines the minimum market capitalization of a large company with respect to each country or region in which the Portfolio invests. Based on market capitalization data as of December 31, 2022, for the Portfolio, the market capitalization of a large company in any country or region in which the Portfolio invests would be $1,325 million or above. This threshold will change due to market conditions.
The Advisor may also increase or reduce the Large Cap International Portfolio’s exposure to an eligible company, or exclude a company, based on shorter-term considerations, such as a company’s price momentum. In addition, the Advisor seeks to reduce trading costs using a flexible trading approach that looks for opportunities to participate in the available market liquidity, while managing turnover and explicit transaction costs.
The Large Cap International Portfolio may gain exposure to companies in an approved market by purchasing equity securities in the form of depositary receipts, which may be listed or traded outside the issuer’s domicile country. The Portfolio also may purchase or sell futures contracts and options on futures contracts for foreign or U.S. equity securities and indices to increase or decrease equity market exposure based on actual or expected cash inflows to or outflows from the Portfolio. Because many of the Portfolio’s investments may be denominated in foreign currencies, the Portfolio may enter into foreign currency exchange transactions, including foreign currency forward contracts, in connection with the settlement of foreign securities or to transfer cash balances from one currency to another currency.
The Large Cap International Portfolio may lend its portfolio securities to generate additional income.
Equity Market Risk: Even a long-term investment approach cannot guarantee a profit. Economic, market, political, and issuer-specific conditions and events will cause the value of equity securities, and the Portfolio that owns them, to rise or fall. Stock markets tend to move in cycles, with periods of rising prices and periods of falling prices.
Foreign Securities and Currencies Risk: Foreign securities prices may decline or fluctuate because of: (a) economic or political actions of foreign governments, and/or (b) less regulated or liquid securities markets. Investors holding these securities may also be exposed to foreign currency risk (the possibility that foreign currency will fluctuate in value against the U.S. dollar or that a foreign government will convert, or be forced to convert, its currency to another currency, changing its value against the U.S. dollar). The Portfolio does not hedge foreign currency risk.
2
Depositary receipts are generally subject to the same risks as the foreign securities that they evidence or into which they may be converted. In addition, the underlying issuers of certain depositary receipts, particularly unsponsored or unregistered depositary receipts, are under no obligation to distribute shareholder communications to the holders of such receipts, or to pass through to them any voting rights with respect to the deposited securities. Depositary receipts that are not sponsored by the issuer may be less liquid and there may be less readily available public information about the issuer.
Profitability Investment Risk: High relative profitability stocks may perform differently from the market as a whole and an investment strategy purchasing these securities may cause the Portfolio to at times underperform equity funds that use other investment strategies.
Value Investment Risk: Value stocks may perform differently from the market as a whole and an investment strategy purchasing these securities may cause the Portfolio to at times underperform equity funds that use other investment strategies. Value stocks can react differently to political, economic, and industry developments than the market as a whole and other types of stocks. Value stocks also may underperform the market for long periods of time.
Derivatives Risk: Derivatives are instruments, such as futures, and options thereon, and foreign currency forward contracts, whose value is derived from that of other assets, rates or indices. The use of derivatives for non-hedging purposes may be considered to carry more risk than other types of investments. When the Portfolio uses derivatives, the Portfolio will be directly exposed to the risks of those derivatives. Derivative instruments are subject to a number of risks including counterparty, settlement, liquidity, interest rate, market, credit and management risks, as well as the risk of improper valuation. Changes in the value of a derivative may not correlate perfectly with the underlying asset, rate or index, and the Portfolio could lose more than the principal amount invested.
Securities Lending Risk: Securities lending involves the risk that the borrower may fail to return the securities in a timely manner or at all. As a result, the Portfolio may lose money and there may be a delay in recovering the loaned securities. The Portfolio could also lose money if it does not recover the securities and/or the value of the collateral falls, including the value of investments made with cash collateral. Securities lending also may have certain adverse tax consequences.
Operational Risk: Operational risks include human error, changes in personnel, system changes, faults in communication, and failures in systems, technology, or processes. Various operational events or circumstances are outside the Advisor’s control, including instances at third parties. The Portfolio and the Advisor seek to reduce these operational risks through controls and procedures. However, these measures do not address every possible risk and may be inadequate to address these risks.
Cyber Security Risk: The Portfolio’s and its service providers’ use of internet, technology and information systems may expose the Portfolio to potential risks linked to cyber security breaches of those technological or information systems. Cyber security breaches, amongst other things, could allow an unauthorized party to gain access to proprietary information, customer data, or fund assets, or cause the Portfolio and/or its service providers to suffer data corruption or lose operational functionality.
The after-tax returns presented in the table for the Large Cap International Portfolio are calculated using the historical highest individual federal marginal income tax rates and do not reflect the impact of state and local
3
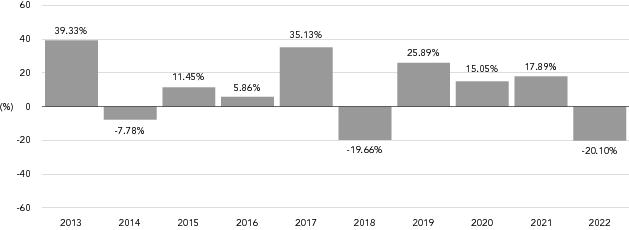
January 2013-December 2022
|
|
|
|
|
|
|
Periods ending December 31, 2022
|
|
|
|
|
|
| ||||||||||||||||
|
1 Year |
5 Years |
10 Years | |||||||||||||||||||
|
Large Cap International Portfolio |
|
|
|
|
|
| |||||||||||||||
|
| |||||||||||||||||||||
|
Return Before Taxes |
- |
% |
|
|
|
% |
|
|
|
% |
| ||||||||||
|
| |||||||||||||||||||||
|
Return After Taxes on Distributions |
- |
% |
|
|
|
% |
|
|
|
% |
| ||||||||||
|
| |||||||||||||||||||||
|
Return After Taxes on Distributions and Sale of Portfolio Shares |
- |
% |
|
|
|
% |
|
|
|
% |
| ||||||||||
|
| |||||||||||||||||||||
|
MSCI World
ex USA Index (net dividends) |
- |
% |
|
|
|
% |
|
|
|
% |
| ||||||||||
| |||||||||||||||||||||
Investment Advisor/Portfolio Management
Dimensional Fund Advisors LP serves as the investment advisor for the Large Cap International Portfolio. Dimensional Fund Advisors Ltd. and DFA Australia Limited serve as the sub-advisors for the Portfolio. The following individuals are responsible for leading the day-to-day management of the Portfolio:
|
• |
Jed S. Fogdall, Global Head of Portfolio Management, Chairman of the Investment Committee, Vice President and Senior Portfolio Manager of the Advisor, has been a portfolio manager of the Portfolio since 2010. | |||||||||||||||||||||||||||||||||||||||||||||||||||||||||||||||||||||||||||||||||||||||||||||||||
|
• |
Arun C. Keswani, Vice President and Senior Portfolio Manager of the Advisor, has been a portfolio manager of the Portfolio since 2020. | |||||||||||||||||||||||||||||||||||||||||||||||||||||||||||||||||||||||||||||||||||||||||||||||||
4
|
• |
Joel P. Schneider, Deputy Head of Portfolio Management, North America, member of the Investment Committee, Vice President and Senior Portfolio Manager of the Advisor, has been a portfolio manager of the Portfolio since 2020. |
Purchase and Redemption of Fund Shares
Investors may purchase or redeem shares of the Large Cap International Portfolio on each day that the NYSE is scheduled to be open for business by first contacting the Portfolio’s transfer agent at (888) 576-1167. Shareholders that invest in the Portfolio through a financial intermediary should contact their financial intermediary regarding purchase and redemption procedures. The Portfolio generally is available for investment only by institutional clients, clients of registered investment advisors, clients of financial institutions and a limited number of certain other investors as approved from time to time by the Advisor. All investments are subject to approval of the Advisor.
Tax Information
The dividends and distributions you receive from the Large Cap International Portfolio are taxable and generally will be taxed as ordinary income, capital gains, or some combination of both, unless you are investing through a tax-advantaged arrangement, such as a 401(k) plan or an individual retirement account, in which case distributions may be taxed as ordinary income when withdrawn from the plan or account.
Payments to Financial Intermediaries
If you purchase the Large Cap International Portfolio through a broker-dealer or other financial intermediary (such as a bank), the Portfolio and its related companies may pay the intermediary for the sale of the Portfolio shares and/or related services. These payments may create a conflict of interest by influencing the financial intermediary to recommend the Portfolio over another investment. Ask your financial advisor or visit your financial intermediary’s website for more information.
5
The investment objective of the DFA International Value Portfolio (the “Portfolio”) is to achieve long-term capital appreciation. The DFA International Value Portfolio is a Feeder Portfolio and pursues its objective by investing substantially all of its assets in its corresponding Master Fund, The DFA International Value Series (the “DFA International Value Series” or the “Series”) of The DFA Investment Trust Company (the “Trust”), which has the same investment objective and policies as the Portfolio.
This table describes the fees and expenses you may pay if you buy, hold or sell shares of the DFA International Value Portfolio. You may pay other fees, such as brokerage commissions and other fees to financial intermediaries, which are not reflected in the table and Example below.
each year as a percentage of the value of
your investment)
|
|
|
|
|
Management Fee |
| |
|
| ||
|
Other Expenses |
| |
|
| ||
|
Total Annual Fund Operating Expenses |
| |
|
| ||
|
Fee Waiver and/or Expense Reimbursement |
| |
|
| ||
|
Total Annual Fund Operating Expenses After Fee Waiver and/or Expense Reimbursement |
| |
|
| ||
|
* |
| ||
|
** |
|
This Example is meant to help you compare the cost of investing in the DFA International Value Portfolio with the cost of investing in other mutual funds. The Example assumes that you invest $10,000 in the Portfolio for the time periods indicated. The Example also assumes that your investment has a 5% return each year and that the Portfolio’s operating expenses remain the same. Although your actual costs may be higher or lower, based on these assumptions your costs would be:
|
|
|
|
|
|
|
|
|
1 Year |
3 Years |
5 Years |
10 Years | |||
|
$ |
$ |
$ |
$ | |||
|
| ||||||
6
The Example reflects the aggregate annual operating expenses of the DFA International Value Portfolio and the Portfolio’s portion of the expenses of the DFA International Value Series.
The DFA International Value
Series pays transaction costs, such as commissions, when it buys and sells
securities (or “turns over” its portfolio). A higher portfolio turnover may
indicate higher transaction costs and may result in higher taxes when Portfolio
shares are held in a taxable account. These costs, which are not reflected in
Annual Fund Operating Expenses or in the Example, affect the DFA International
Value Portfolio’s performance. During the most recent fiscal year, the Series’
portfolio turnover rate was
The DFA International Value Portfolio invests substantially all of its assets in the DFA International Value Series. To achieve the Portfolio’s and Series’ investment objectives, the Advisor implements an integrated investment approach that combines research, portfolio design, portfolio management, and trading functions. As further described below, the Series’ design emphasizes long-term drivers of expected returns identified by the Advisor’s research, while balancing risk through broad diversification across companies and sectors. The Advisor’s portfolio management and trading processes further balance those long-term drivers of expected returns with shorter-term drivers of expected returns and trading costs.
The DFA International Value Series is designed to purchase securities of large non-U.S. companies in countries with developed markets that the Advisor determines to be value stocks. A company’s market capitalization is the number of its shares outstanding times its price per share. Under a market capitalization weighted approach, companies with higher market capitalizations generally represent a larger proportion of the Series than companies with relatively lower market capitalizations. The Advisor may overweight certain stocks, including smaller companies, lower relative price stocks, and/or higher profitability stocks within the large-cap value segment of developed ex U.S. markets. An equity issuer is considered to have a low relative price (i.e., a value stock) primarily because it has a low price in relation to its book value. In assessing relative price, the Advisor may consider additional factors such as price to cash flow or price to earnings ratios. An equity issuer is considered to have high profitability because it has high earnings or profits from operations in relation to its book value or assets. The criteria the Advisor uses for assessing relative price and profitability are subject to change from time to time.
The DFA International Value Series intends to purchase securities of large companies associated with developed market countries that the Advisor has designated as approved markets. The Advisor determines the minimum market capitalization of a large company with respect to each country or region in which the Series invests. Based on market capitalization data as of December 31, 2022, for the Series, the market capitalization of a large company in any country or region in which the Series invests would be $1,325 million or above. This threshold will change due to market conditions.
The Advisor may also increase or reduce the DFA International Value Series’ exposure to an eligible company, or exclude a company, based on shorter-term considerations, such as a company’s price momentum. In addition, the Advisor seeks to reduce trading costs using a flexible trading approach that looks for opportunities to participate in the available market liquidity, while managing turnover and explicit transaction costs.
The DFA International Value Series may gain exposure to companies associated with approved markets by purchasing equity securities in the form of depositary receipts, which may be listed or traded outside the issuer’s domicile country. The Series and the DFA International Value Portfolio each may purchase or sell futures contracts and options on futures contracts for foreign or U.S. equity securities and indices to increase or decrease equity market exposure based on actual or expected cash inflows to or outflows from the Series or Portfolio. Because many of the Series’ and Portfolio’s investments may be denominated in foreign currencies, the Series and the Portfolio may enter into foreign currency exchange transactions, including foreign currency forward
7
contracts, in connection with the settlement of foreign securities or to transfer cash balances from one currency to another currency.
The DFA International Value Series may lend its portfolio securities to generate additional income.
Equity Market Risk: Even a long-term investment approach cannot guarantee a profit. Economic, market, political, and issuer-specific conditions and events will cause the value of equity securities, and the Portfolio that owns them, to rise or fall. Stock markets tend to move in cycles, with periods of rising prices and periods of falling prices.
Foreign Securities and Currencies Risk: Foreign securities prices may decline or fluctuate because of: (a) economic or political actions of foreign governments, and/or (b) less regulated or liquid securities markets. Investors holding these securities may also be exposed to foreign currency risk (the possibility that foreign currency will fluctuate in value against the U.S. dollar or that a foreign government will convert, or be forced to convert, its currency to another currency, changing its value against the U.S. dollar). The Series does not hedge foreign currency risk.
Depositary receipts are generally subject to the same risks as the foreign securities that they evidence or into which they may be converted. In addition, the underlying issuers of certain depositary receipts, particularly unsponsored or unregistered depositary receipts, are under no obligation to distribute shareholder communications to the holders of such receipts, or to pass through to them any voting rights with respect to the deposited securities. Depositary receipts that are not sponsored by the issuer may be less liquid and there may be less readily available public information about the issuer.
Value Investment Risk: Value stocks may perform differently from the market as a whole and an investment strategy purchasing these securities may cause the Series to at times underperform equity funds that use other investment strategies. Value stocks can react differently to political, economic, and industry developments than the market as a whole and other types of stocks. Value stocks also may underperform the market for long periods of time.
Profitability Investment Risk: High relative profitability stocks may perform differently from the market as a whole and an investment strategy purchasing these securities may cause the Series to at times underperform equity funds that use other investment strategies.
Derivatives Risk: Derivatives are instruments, such as futures, and options thereon, and foreign currency forward contracts, whose value is derived from that of other assets, rates or indices. The use of derivatives for non-hedging purposes may be considered to carry more risk than other types of investments. When the Series and the Portfolio use derivatives, the Portfolio will be directly exposed to the risks of those derivatives. Derivative instruments are subject to a number of risks including counterparty, settlement, liquidity, interest rate, market, credit and management risks, as well as the risk of improper valuation. Changes in the value of a derivative may not correlate perfectly with the underlying asset, rate or index, and the Portfolio could lose more than the principal amount invested.
Securities Lending Risk: Securities lending involves the risk that the borrower may fail to return the securities in a timely manner or at all. As a result, the Series may lose money and there may be a delay in recovering the loaned securities. The Series could also lose money if it does not recover the securities and/or the value of the collateral falls, including the value of investments made with cash collateral. Securities lending also may have certain adverse tax consequences.
8
Operational Risk: Operational risks include human error, changes in personnel, system changes, faults in communication, and failures in systems, technology, or processes. Various operational events or circumstances are outside the Advisor’s control, including instances at third parties. The Portfolio and the Advisor seek to reduce these operational risks through controls and procedures. However, these measures do not address every possible risk and may be inadequate to address these risks.
Cyber Security Risk: The Portfolio’s and its service providers’ use of internet, technology and information systems may expose the Portfolio to potential risks linked to cyber security breaches of those technological or information systems. Cyber security breaches, amongst other things, could allow an unauthorized party to gain access to proprietary information, customer data, or fund assets, or cause the Portfolio and/or its service providers to suffer data corruption or lose operational functionality.
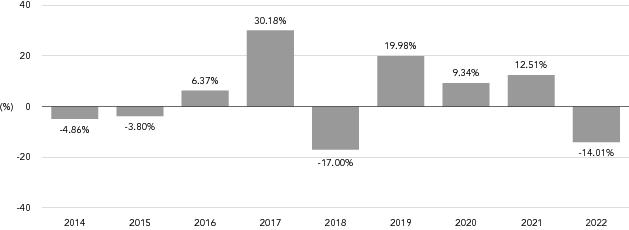
January 2013-December 2022
|
|
|
|
|
|
|
9
Periods ending December 31, 2022
|
|
|
|
|
|
|||||||||||||||||
|
1 Year |
5 Years |
10 Years | |||||||||||||||||||
|
DFA International Value Portfolio |
|
|
|
|
|
| |||||||||||||||
|
| |||||||||||||||||||||
|
Return Before Taxes |
- |
% |
|
|
|
% |
|
|
|
% |
| ||||||||||
|
| |||||||||||||||||||||
|
Return After Taxes on Distributions |
- |
% |
|
|
|
% |
|
|
|
% |
| ||||||||||
|
| |||||||||||||||||||||
|
Return After Taxes on Distributions and Sale of Portfolio Shares |
- |
% |
|
|
|
% |
|
|
|
% |
| ||||||||||
| |||||||||||||||||||||
|
MSCI World
ex USA Value Index (net dividends) |
|
- |
% |
|
|
|
% |
|
|
|
% |
| |||||||||
| |||||||||||||||||||||
Investment Advisor/Portfolio Management
Dimensional Fund Advisors LP serves as the investment advisor for the DFA International Value Portfolio and the DFA International Value Series. Dimensional Fund Advisors Ltd. and DFA Australia Limited serve as the sub-advisors for the Series. The following individuals are responsible for leading the day-to-day management of the Portfolio and the Series:
|
• |
Jed S. Fogdall, Global Head of Portfolio Management, Chairman of the Investment Committee, Vice President and Senior Portfolio Manager of the Advisor, has been a portfolio manager of the Portfolio since 2010. | |||||||||||||||||||||||||||||||||||||||||||||||||||||||||||||||||||||||||||||||||||||||||||||||||
|
• |
Arun C. Keswani, Vice President and Senior Portfolio Manager of the Advisor, has been a portfolio manager of the Portfolio since 2020. | |||||||||||||||||||||||||||||||||||||||||||||||||||||||||||||||||||||||||||||||||||||||||||||||||
|
• |
Joel P. Schneider, Deputy Head of Portfolio Management, North America, member of the Investment Committee, Vice President and Senior Portfolio Manager of the Advisor, has been a portfolio manager of the Portfolio since 2022. | |||||||||||||||||||||||||||||||||||||||||||||||||||||||||||||||||||||||||||||||||||||||||||||||||
Purchase and Redemption of Fund Shares
Investors may purchase or redeem shares of the DFA International Value Portfolio on each day that the NYSE is scheduled to be open for business by first contacting the Portfolio’s transfer agent at (888) 576-1167. Shareholders that invest in the Portfolio through a financial intermediary should contact their financial intermediary regarding purchase and redemption procedures. The Portfolio generally is available for investment only by institutional clients, clients of registered investment advisors, clients of financial institutions and a limited number of certain other investors as approved from time to time by the Advisor. All investments are subject to approval of the Advisor.
Tax Information
The dividends and distributions you receive from the DFA International Value Portfolio are taxable and generally will be taxed as ordinary income, capital gains, or some combination of both, unless you are investing through a tax-advantaged arrangement, such as a 401(k) plan or an individual retirement account, in which case distributions may be taxed as ordinary income when withdrawn from the plan or account.
Payments to Financial Intermediaries
If you purchase the DFA International Value Portfolio through a broker-dealer or other financial intermediary (such as a bank), the Portfolio and its related companies may pay the intermediary for the sale of the Portfolio shares and/or related services. These payments may create a conflict of interest by influencing the financial intermediary to recommend the Portfolio over another investment. Ask your financial advisor or visit your financial intermediary’s website for more information.
10
The investment objective of the International Core Equity Portfolio (the “Portfolio”) is to achieve long-term capital appreciation.
This table describes the fees and expenses you may pay if you buy, hold or sell shares of the International Core Equity Portfolio. You may pay other fees, such as brokerage commissions and other fees to financial intermediaries, which are not reflected in the table and Example below.
year as a percentage of the value of
your investment)
|
|
|
|
|
Management Fee |
| |
|
| ||
|
Other Expenses |
| |
|
| ||
|
Total Annual Fund Operating Expenses |
| |
|
| ||
This Example is meant to help you compare the cost of investing in the International Core Equity Portfolio with the cost of investing in other mutual funds. The Example assumes that you invest $10,000 in the Portfolio for the time periods indicated. The Example also assumes that your investment has a 5% return each year and that the Portfolio’s operating expenses remain the same. Although your actual costs may be higher or lower, based on these assumptions your costs would be:
|
|
|
|
|
|
|
|
|
1 Year |
3 Years |
5 Years |
10 Years | |||
|
$ |
$ |
$ |
$ | |||
|
| ||||||
The International Core Equity
Portfolio pays transaction costs, such as commissions, when it buys and sells
securities (or “turns over” its portfolio). A higher portfolio turnover may
indicate higher transaction costs and may result in higher taxes when Portfolio
shares are held in a taxable account. These costs, which are not reflected in
Annual Fund Operating Expenses or in the Example, affect the Portfolio’s
performance. During the most recent fiscal year, the Portfolio’s portfolio
turnover rate was
To achieve the International Core Equity Portfolio’s investment objective, Dimensional Fund Advisors LP (the “Advisor”) implements an integrated investment approach that combines research, portfolio design, portfolio management, and trading functions. As further described below, the Portfolio’s design emphasizes long-term drivers of expected returns identified by the Advisor’s research, while balancing risk through broad diversification across companies and sectors. The Advisor’s portfolio management and trading processes further balance those long-term drivers of expected returns with shorter-term drivers of expected returns and trading costs.
11
The International Core Equity Portfolio is designed to purchase a broad and diverse group of securities of non-U.S. companies in developed markets. The Portfolio invests in companies of all sizes, with increased exposure to smaller capitalization, lower relative price, and higher profitability companies as compared to their representation in the International Universe. For purposes of this Portfolio, the Advisor defines the International Universe as a market capitalization weighted set (e.g., the larger the company, the greater the proportion of the International Universe it represents) of non-U.S. companies in developed markets that have been authorized as approved markets for investment by the Advisor’s Investment Committee. The Portfolio’s increased exposure to smaller capitalization, lower relative price, and higher profitability companies may be achieved by decreasing the allocation of the Portfolio’s assets to larger capitalization, higher relative price, or lower profitability companies relative to their weight in the International Universe. An equity issuer is considered to have a high relative price (i.e., a growth stock) primarily because it has a high price in relation to its book value. An equity issuer is considered to have a low relative price (i.e., a value stock) primarily because it has a low price in relation to its book value. In assessing relative price, the Advisor may consider additional factors such as price to cash flow or price to earnings ratios. An equity issuer is considered to have high profitability because it has high earnings or profits from operations in relation to its book value or assets. The criteria the Advisor uses for assessing relative price and profitability are subject to change from time to time.
The International Core Equity Portfolio intends to purchase securities of companies associated with developed market countries that the Advisor has designated as approved markets. As a non-fundamental policy, under normal circumstances, the Portfolio will invest at least 80% of its net assets in equity securities. The Advisor determines company size on a country or region specific basis and based primarily on market capitalization. The percentage allocation of the assets of the Portfolio to securities of the largest high relative price companies will generally be reduced from between 5% and 35% of their percentage weight in the International Universe. As of December 31, 2022, securities of the largest high relative price companies in the International Universe comprised approximately 16% of the International Universe and the Advisor allocated approximately 8% of the Portfolio to securities of the largest high relative price companies in the International Universe. The percentage by which the Portfolio’s allocation to securities of the largest high relative price companies is reduced will change due to market movements and other factors.
The Advisor may also increase or reduce the International Core Equity Portfolio’s exposure to an eligible company, or exclude a company, based on shorter-term considerations, such as a company’s price momentum and investment characteristics. In assessing a company’s investment characteristics, the Advisor considers ratios such as recent changes in assets divided by total assets. The criteria the Advisor uses for assessing a company’s investment characteristics are subject to change from time to time. In addition, the Advisor seeks to reduce trading costs using a flexible trading approach that looks for opportunities to participate in the available market liquidity, while managing turnover and explicit transaction costs.
The International Core Equity Portfolio may gain exposure to companies associated with approved markets by purchasing equity securities in the form of depositary receipts, which may be listed or traded outside the issuer’s domicile country. The Portfolio also may purchase or sell futures contracts and options on futures contracts for foreign or U.S. equity securities and indices to increase or decrease equity market exposure based on actual or expected cash inflows to or outflows from the Portfolio. Because many of the Portfolio’s investments may be denominated in foreign currencies, the Portfolio may enter into foreign currency exchange transactions, including foreign currency forward contracts, in connection with the settlement of foreign securities or to transfer cash balances from one currency to another currency.
The International Core Equity Portfolio may lend its portfolio securities to generate additional income.
12
Equity Market Risk: Even a long-term investment approach cannot guarantee a profit. Economic, market, political, and issuer-specific conditions and events will cause the value of equity securities, and the Portfolio that owns them, to rise or fall. Stock markets tend to move in cycles, with periods of rising prices and periods of falling prices.
Foreign Securities and Currencies Risk: Foreign securities prices may decline or fluctuate because of: (a) economic or political actions of foreign governments, and/or (b) less regulated or liquid securities markets. Investors holding these securities may also be exposed to foreign currency risk (the possibility that foreign currency will fluctuate in value against the U.S. dollar or that a foreign government will convert, or be forced to convert, its currency to another currency, changing its value against the U.S. dollar). The Portfolio does not hedge foreign currency risk.
Depositary receipts are generally subject to the same risks as the foreign securities that they evidence or into which they may be converted. In addition, the underlying issuers of certain depositary receipts, particularly unsponsored or unregistered depositary receipts, are under no obligation to distribute shareholder communications to the holders of such receipts, or to pass through to them any voting rights with respect to the deposited securities. Depositary receipts that are not sponsored by the issuer may be less liquid and there may be less readily available public information about the issuer.
Small and Mid-Cap Company Risk: Securities of small and mid-cap companies are often less liquid than those of large companies and this could make it difficult to sell a small or mid-cap company security at a desired time or price. As a result, small and mid-cap company stocks may fluctuate relatively more in price. In general, small and mid- capitalization companies are also more vulnerable than larger companies to adverse business or economic developments and they may have more limited resources.
Profitability Investment Risk: High relative profitability stocks may perform differently from the market as a whole and an investment strategy purchasing these securities may cause the Portfolio to at times underperform equity funds that use other investment strategies.
Value Investment Risk: Value stocks may perform differently from the market as a whole and an investment strategy purchasing these securities may cause the Portfolio to at times underperform equity funds that use other investment strategies. Value stocks can react differently to political, economic, and industry developments than the market as a whole and other types of stocks. Value stocks also may underperform the market for long periods of time.
Derivatives Risk: Derivatives are instruments, such as futures, and options thereon, and foreign currency forward contracts, whose value is derived from that of other assets, rates or indices. The use of derivatives for non-hedging purposes may be considered to carry more risk than other types of investments. When the Portfolio uses derivatives, the Portfolio will be directly exposed to the risks of those derivatives. Derivative instruments are subject to a number of risks including counterparty, settlement, liquidity, interest rate, market, credit and management risks, as well as the risk of improper valuation. Changes in the value of a derivative may not correlate perfectly with the underlying asset, rate or index, and the Portfolio could lose more than the principal amount invested.
Securities Lending Risk: Securities lending involves the risk that the borrower may fail to return the securities in a timely manner or at all. As a result, the Portfolio may lose money and there may be a delay in recovering the loaned securities. The Portfolio could also lose money if it does not recover the securities and/or the value of the collateral falls, including the value of investments made with cash collateral. Securities lending also may have certain adverse tax consequences.
Operational Risk: Operational risks include human error, changes in personnel, system changes, faults in communication, and failures in systems, technology, or processes. Various operational events or circumstances are outside the Advisor’s control, including instances at third parties. The Portfolio and the Advisor seek to reduce these operational risks through controls and procedures. However, these measures do not address every possible risk and may be inadequate to address these risks.
13
Cyber Security Risk: The Portfolio’s and its service providers’ use of internet, technology and information systems may expose the Portfolio to potential risks linked to cyber security breaches of those technological or information systems. Cyber security breaches, amongst other things, could allow an unauthorized party to gain access to proprietary information, customer data, or fund assets, or cause the Portfolio and/or its service providers to suffer data corruption or lose operational functionality.
January 2013-December 2022
|
|
|
|
|
|
|
14
Periods ending December 31, 2022
|
|
|
|
|
|
| ||||||||||||||||
|
1 Year |
5 Years |
10 Years | |||||||||||||||||||
|
International Core Equity Portfolio |
|
|
|
|
|
| |||||||||||||||
|
| |||||||||||||||||||||
|
Return Before Taxes |
- |
% |
|
|
|
% |
|
|
|
% |
| ||||||||||
|
| |||||||||||||||||||||
|
Return After Taxes on Distributions |
- |
% |
|
|
|
% |
|
|
|
% |
| ||||||||||
|
| |||||||||||||||||||||
|
Return After Taxes on Distributions and Sale of Portfolio Shares |
- |
% |
|
|
|
% |
|
|
|
% |
| ||||||||||
|
| |||||||||||||||||||||
|
MSCI World
ex USA Index (net dividends) |
- |
% |
|
|
|
% |
|
|
|
% |
| ||||||||||
| |||||||||||||||||||||
Investment Advisor/Portfolio Management
Dimensional Fund Advisors LP serves as the investment advisor for the International Core Equity Portfolio. Dimensional Fund Advisors Ltd. and DFA Australia Limited serve as the sub-advisors for the Portfolio. The following individuals are responsible for leading the day-to-day management of the Portfolio:
|
• |
Jed S. Fogdall, Global Head of Portfolio Management, Chairman of the Investment Committee, Vice President and Senior Portfolio Manager of the Advisor, has been a portfolio manager of the Portfolio since 2010. | |||||||||||||||||||||||||||||||||||||||||||||||||||||||||||||||||||||||||||||||||||||||||||||||||
|
• |
Allen Pu, Deputy Head of Portfolio Management, North America, member of the Investment Committee, Vice President and Senior Portfolio Manager of the Advisor, has been a portfolio manager of the Portfolio since 2015. | |||||||||||||||||||||||||||||||||||||||||||||||||||||||||||||||||||||||||||||||||||||||||||||||||
|
• |
Mary T. Phillips, Deputy Head of Portfolio Management, North America, member of the Investment Committee, Vice President and Senior Portfolio Manager of the Advisor, has been a portfolio manager of the Portfolio since 2017. | |||||||||||||||||||||||||||||||||||||||||||||||||||||||||||||||||||||||||||||||||||||||||||||||||
|
• |
William B. Collins-Dean, Vice President and Senior Portfolio Manager of the Advisor, has been a portfolio manager of the Portfolio since 2019. | |||||||||||||||||||||||||||||||||||||||||||||||||||||||||||||||||||||||||||||||||||||||||||||||||
Purchase and Redemption of Fund Shares
Investors may purchase or redeem shares of the International Core Equity Portfolio on each day that the NYSE is scheduled to be open for business by first contacting the Portfolio’s transfer agent at (888) 576-1167. Shareholders that invest in the Portfolio through a financial intermediary should contact their financial intermediary regarding purchase and redemption procedures. The Portfolio generally is available for investment only by institutional clients, clients of registered investment advisors, clients of financial institutions and a limited number of certain other investors as approved from time to time by the Advisor. All investments are subject to approval of the Advisor.
Tax Information
The dividends and distributions you receive from the International Core Equity Portfolio are taxable and generally will be taxed as ordinary income, capital gains, or some combination of both, unless you are investing through a tax-advantaged arrangement, such as a 401(k) plan or an individual retirement account, in which case distributions may be taxed as ordinary income when withdrawn from the plan or account.
15
Payments to Financial Intermediaries
If you purchase the International Core Equity Portfolio through a broker-dealer or other financial intermediary (such as a bank), the Portfolio and its related companies may pay the intermediary for the sale of the Portfolio shares and/or related services. These payments may create a conflict of interest by influencing the financial intermediary to recommend the Portfolio over another investment. Ask your financial advisor or visit your financial intermediary’s website for more information.
16
The investment objective of the Global Small Company Portfolio (the “Portfolio”) is to achieve long-term capital appreciation.
This table describes the fees and expenses you may pay if you buy, hold or sell shares of the Global Small Company Portfolio. You may pay other fees, such as brokerage commissions and other fees to financial intermediaries, which are not reflected in the table and Example below.
year as a percentage of the value of
your investment)
|
|
|
|
|
Management Fee |
| |
|
| ||
|
Other Expenses |
| |
|
| ||
|
Acquired Fund Fees and Expenses** |
| |
|
| ||
|
Total Annual Fund Operating Expenses** |
| |
|
| ||
|
Fee Waiver and/or Expense Reimbursement*** |
| |
|
| ||
|
Total Annual Fund Operating Expenses After Fee Waiver and/or Expense Reimbursement |
| |
|
| ||
|
* |
| ||
|
** |
| ||
|
*** |
|
This Example is meant to help you compare the cost of investing in the Global Small Company Portfolio with the cost of investing in other mutual funds. The Example assumes that you invest $10,000 in the Portfolio for the time periods indicated. The Example also assumes that your investment has a 5% return each year and that the Portfolio’s operating expenses remain the same. The costs for the Portfolio reflect the net expenses of the Portfolio that result from the contractual expense waiver in the first year only. Although your actual costs may be higher or lower, based on these assumptions, your costs would be:
|
|
|
|
|
|
|
|
|
1 Year |
3 Years |
5 Years |
10 Years | |||
|
$ |
$ |
$ |
$ | |||
|
| ||||||
17
A mutual fund generally pays
transaction costs, such as commissions, when it buys and sells securities (or
“turns over” its portfolio). A higher portfolio turnover may indicate higher
transaction costs and may result in higher taxes when mutual fund shares are
held in a taxable account. The Global Small Company Portfolio does not pay
transaction costs when buying and selling shares of other mutual funds (the
“Underlying Funds”); however, the Underlying Funds pay transaction costs when
buying and selling securities for their portfolio. The transaction costs
incurred by the Underlying Funds, which are not reflected in Annual Fund
Operating Expenses or in the Example, affect the Portfolio’s performance. During
the most recent fiscal year, the Portfolio’s portfolio turnover rate was
The Global Small Company Portfolio is a “fund of funds,” which means the Portfolio generally allocates its assets among other funds managed by the Advisor (the “Underlying Funds”), although it has the ability to invest directly in securities and derivatives. To achieve the Portfolio’s and the Underlying Funds’ investment objectives, the Advisor implements an integrated investment approach that combines research, portfolio design, portfolio management, and trading functions. As further described below, the Portfolio’s and the Underlying Funds’ designs emphasize long-term drivers of expected returns identified by the Advisor’s research, while balancing risk through broad diversification across companies and sectors. The Advisor’s portfolio management and trading processes further balance those long-term drivers of expected returns with shorter-term drivers of expected returns and trading costs.
The Global Small Company Portfolio is designed to provide investors with access to securities portfolios consisting of a broad range of equity securities of primarily small companies in developed and emerging markets. The Portfolio pursues its investment objective by investing substantially all of its assets in the following Underlying Funds: The Asia Pacific Small Company Series, The Canadian Small Company Series, The Continental Small Company Series, The Emerging Markets Small Cap Series, The Japanese Small Company Series, The United Kingdom Small Company Series (each a series of The DFA Investment Trust Company), and U.S. Small Cap Portfolio (a series of DFA Investment Dimensions Group Inc.).
The Global Small Company Portfolio typically allocates its investments among the Underlying Funds in the following manner: 30% to 70% in the U.S. Small Cap Portfolio; 5% to 30% in The Continental Small Company Series; 5% to 25% in The Emerging Markets Small Cap Series; 0% to 20% in The Japanese Small Company Series; 0% to 20% in The United Kingdom Small Company Series; 0% to 15% in The Asia Pacific Company Series; and 0% to 10% in The Canadian Small Company Series. When deciding allocations to the Underlying Funds, the Portfolio takes into account, among other factors, the aggregate market capitalizations and adjustments for free float of the eligible universe of securities within each region. Periodically, the Advisor will review the allocations for the Portfolio in each Underlying Fund and may adjust allocations to the Underlying Funds or may add or remove Underlying Funds in the Portfolio without notice to shareholders. Certain Underlying Funds invest in small companies using a market capitalization weighted approach in each country or region designated by the Advisor as an approved market for investment. A company’s market capitalization is the number of its shares outstanding times its price per share. Under a market capitalization weighted approach, companies with higher market capitalizations generally represent a larger proportion of an Underlying Fund than companies with relatively lower market capitalizations. The Portfolio and Underlying Funds may emphasize certain stocks, including smaller capitalization companies, lower relative price stocks, and/or higher profitability stocks as compared to their representation in the countries and/or regions in which the Portfolio and/or Underlying Funds are authorized to invest. An equity issuer is considered to have a low relative price (i.e., a value stock) primarily because it has a low price in relation to its book value. In assessing relative price, the Advisor may consider additional factors such as price to cash flow or price to earnings ratios. An equity issuer is considered to have high profitability because it has high earnings or profits from operations in relation to its book value or assets. The criteria the Advisor uses for assessing relative price and profitability are subject to change from time to time.
The Global Small Company Portfolio, directly or indirectly through its investment in the Underlying Funds, intends to invest its assets to gain exposure to at least three different countries, including the United States. The
18
Advisor will generally seek to set country weights based on the relative market capitalizations of eligible companies within each approved market of the Underlying Funds. As of the date of the Prospectus, the Portfolio, directly or indirectly through its investment in the Underlying Funds, invests approximately 58% of its net assets in U.S. companies. This percentage will change due to market conditions.
As a non-fundamental policy, under normal circumstances, the Global Small Company Portfolio, directly or through its investments in the Underlying Funds, will invest at least 80% of its net assets in securities of small companies. The Advisor determines the maximum market capitalization of a small company with respect to each country in which the Portfolio or Underlying Fund invests. In the countries or regions authorized for investment, the Advisor first ranks eligible companies listed on selected exchanges based on the companies’ market capitalizations. The Advisor then determines the universe of eligible stocks by defining the maximum market capitalization of a small company that may be purchased by the Portfolio or Underlying Fund with respect to each country or region. Based on market capitalization data as of December 31, 2022, for the Portfolio, the market capitalization of a small company in any country in which the Portfolio or its Underlying Funds invests would be below $9,484 million. This threshold will vary by country or region. For example, based on market capitalization data as of December 31, 2022, the Advisor would consider a small company in Switzerland to have a market capitalization below $8,202 million, a small company in the United States to have a market capitalization below $7,650 million, a small company in Norway to have a market capitalization below $1,765 million, and a small company in Japan to have a market capitalization below $2,035 million. These thresholds will change due to market conditions.
The Advisor may also increase or reduce the Global Small Company Portfolio’s and/or Underlying Funds’ exposure to an eligible company, or exclude a company, based on shorter-term considerations, such as a company’s price momentum and investment characteristics. In assessing a company’s investment characteristics, the Advisor considers ratios such as recent changes in assets divided by total assets. The criteria the Advisor uses for assessing a company’s investment characteristics are subject to change from time to time. In addition, the Advisor seeks to reduce trading costs using a flexible trading approach that looks for opportunities to participate in the available market liquidity, while managing turnover and explicit transaction costs.
The Global Small Company Portfolio and each Underlying Fund may invest in affiliated and unaffiliated registered and unregistered money market funds to manage its cash pending investment in other securities or to maintain liquidity for the payment of redemptions or other purposes. Investments in money market funds may involve a duplication of certain fees and expenses.
The Global Small Company Portfolio and each Underlying Fund may gain exposure to companies associated with approved markets by purchasing equity securities in the form of depositary receipts, which may be listed or traded outside the issuer’s domicile country. The Portfolio and each Underlying Fund may purchase or sell futures contracts and options on futures contracts for equity securities and indices of its approved markets or other equity market securities or indices, including those of the United States, to increase or decrease equity market exposure based on actual or expected cash inflows to or outflows from the Portfolio or Underlying Fund. Because many of the Portfolio’s and certain Underlying Funds’ investments may be denominated in foreign currencies, the Portfolio and certain Underlying Funds may enter into foreign currency exchange transactions, including foreign currency forward contracts, in connection with the settlement of foreign securities or to transfer cash balances from one currency to another currency.
The Global Small Company Portfolio and Underlying Funds may lend their portfolio securities to generate additional income.
A summary of the investment strategies and policies of the Underlying Funds in which the Global Small Company Portfolio invests as of the date of this Prospectus is described in the Portfolio’s Prospectus in the section entitled “ADDITIONAL INFORMATION ON INVESTMENT OBJECTIVES AND POLICIES”.
19
Fund of Funds Risk: The investment performance of the Portfolio is affected by the investment performance of the Underlying Funds in which the Portfolio invests. The ability of the Portfolio to achieve its investment objective depends on the ability of the Underlying Funds to meet their investment objectives and on the Advisor’s decisions regarding the allocation of the Portfolio’s assets among the Underlying Funds. There can be no assurance that the investment objective of the Portfolio or any Underlying Fund will be achieved. When the Portfolio invests in Underlying Funds, investors are exposed to a proportionate share of the expenses of those Underlying Funds in addition to the expenses of the Portfolio. Through its investments in the Underlying Funds, the Portfolio is subject to the risks of the Underlying Funds’ investments. The risks of the Portfolio’s and Underlying Funds’ investments are described below.
Equity Market Risk: Even a long-term investment approach cannot guarantee a profit. Economic, market, political, and issuer-specific conditions and events will cause the value of equity securities, and the Portfolio that owns them, to rise or fall. Stock markets tend to move in cycles, with periods of rising prices and periods of falling prices.
Foreign Securities and Currencies Risk: Foreign securities prices may decline or fluctuate because of: (a) economic or political actions of foreign governments, and/or (b) less regulated or liquid securities markets. Investors holding these securities may also be exposed to foreign currency risk (the possibility that foreign currency will fluctuate in value against the U.S. dollar or that a foreign government will convert, or be forced to convert, its currency to another currency, changing its value against the U.S. dollar). The Underlying Funds do not hedge foreign currency risk.
Depositary receipts are generally subject to the same risks as the foreign securities that they evidence or into which they may be converted. In addition, the underlying issuers of certain depositary receipts, particularly unsponsored or unregistered depositary receipts, are under no obligation to distribute shareholder communications to the holders of such receipts, or to pass through to them any voting rights with respect to the deposited securities. Depositary receipts that are not sponsored by the issuer may be less liquid and there may be less readily available public information about the issuer.
Emerging Markets Risk: Numerous emerging market countries have a history of, and continue to experience serious, and potentially continuing, economic and political problems. Stock markets in many emerging market countries are relatively small, expensive to trade in and generally have higher risks than those in developed markets. Securities in emerging markets also may be less liquid than those in developed markets and foreigners are often limited in their ability to invest in, and withdraw assets from, these markets. Additional restrictions may be imposed under other conditions. Frontier market countries generally have smaller economies or less developed capital markets and, as a result, the risks of investing in emerging market countries are magnified in frontier market countries.
Small Company Risk: Securities of small companies are often less liquid than those of large companies and this could make it difficult to sell a small company security at a desired time or price. As a result, small company stocks may fluctuate relatively more in price. In general, smaller capitalization companies are also more vulnerable than larger companies to adverse business or economic developments and they may have more limited resources.
Profitability Investment Risk: High relative profitability stocks may perform differently from the market as a whole and an investment strategy purchasing these securities may cause the Portfolio or an Underlying Fund to at times underperform equity funds that use other investment strategies.
20
Value Investment Risk: Value stocks may perform differently from the market as a whole and an investment strategy purchasing these securities may cause the Portfolio or an Underlying Fund to at times underperform equity funds that use other investment strategies. Value stocks can react differently to political, economic, and industry developments than the market as a whole and other types of stocks. Value stocks also may underperform the market for long periods of time.
Derivatives Risk: Derivatives are instruments, such as futures, and options thereon, and foreign currency forward contracts, whose value is derived from that of other assets, rates or indices. The use of derivatives for non-hedging purposes may be considered to carry more risk than other types of investments. When the Portfolio or an Underlying Fund uses derivatives, the Portfolio or Underlying Fund will be directly exposed to the risks of those derivatives. Derivative instruments are subject to a number of risks including counterparty, settlement, liquidity, interest rate, market, credit and management risks, as well as the risk of improper valuation. Changes in the value of a derivative may not correlate perfectly with the underlying asset, rate or index, and the Portfolio or Underlying Fund could lose more than the principal amount invested.
Securities Lending Risk: Securities lending involves the risk that the borrower may fail to return the securities in a timely manner or at all. As a result, the Portfolio or an Underlying Fund may lose money and there may be a delay in recovering the loaned securities. The Portfolio or Underlying Fund could also lose money if it does not recover the securities and/or the value of the collateral falls, including the value of investments made with cash collateral. Securities lending also may have certain adverse tax consequences.
Operational Risk: Operational risks include human error, changes in personnel, system changes, faults in communication, and failures in systems, technology, or processes. Various operational events or circumstances are outside the Advisor’s control, including instances at third parties. The Portfolio and the Advisor seek to reduce these operational risks through controls and procedures. However, these measures do not address every possible risk and may be inadequate to address these risks.
Cyber Security Risk: The Portfolio’s and its service providers’ use of internet, technology and information systems may expose the Portfolio to potential risks linked to cyber security breaches of those technological or information systems. Cyber security breaches, amongst other things, could allow an unauthorized party to gain access to proprietary information, customer data, or fund assets, or cause the Portfolio and/or its service providers to suffer data corruption or lose operational functionality.
21
January 2018-December 2022
|
|
|
|
|
|
|
Periods ending December 31, 2022
|
|
|
|
|
|
| ||||||||||||||||
|
1 Year |
5 Years |
Since
| |||||||||||||||||||
|
Global Small Company Portfolio |
|
|
|
|
|
| |||||||||||||||
|
| |||||||||||||||||||||
|
Return Before Taxes |
- |
% |
|
|
|
% |
|
|
|
% |
| ||||||||||
|
| |||||||||||||||||||||
|
Return After Taxes on Distributions |
- |
% |
|
|
|
% |
|
|
|
% |
| ||||||||||
|
| |||||||||||||||||||||
|
Return After Taxes on Distributions and Sale of Portfolio Shares |
- |
% |
|
|
|
% |
|
|
|
% |
| ||||||||||
|
| |||||||||||||||||||||
|
MSCI All
Country World Small Cap Index (net dividends) |
- |
% |
|
|
|
% |
|
|
|
% |
| ||||||||||
| |||||||||||||||||||||
Investment Advisor/Portfolio Management
Dimensional Fund Advisors LP serves as the investment advisor for the Global Small Company Portfolio. Dimensional Fund Advisors Ltd. and DFA Australia Limited serve as the sub-advisors for the Portfolio. The following individuals are responsible for leading the day-to-day management of the Portfolio:
|
• |
Jed S. Fogdall, Global Head of Portfolio Management, Chairman of the Investment Committee, Vice President and Senior Portfolio Manager of the Advisor, has been a portfolio manager of the Portfolio since inception (2017). | ||
|
• |
Allen Pu, Deputy Head of Portfolio Management, North America, member of the Investment Committee, Vice President and Senior Portfolio Manager of the Advisor, has been a portfolio manager of the Portfolio since inception (2017). | ||
|
• |
Ashish P. Bhagwanjee, Vice President and Senior Portfolio Manager of the Advisor, has been a portfolio manager of the Portfolio since 2022. |
22
Purchase and Redemption of Fund Shares
Investors may purchase or redeem shares of the Global Small Company Portfolio on each day that the NYSE is scheduled to be open for business by first contacting the Portfolio’s transfer agent at (888) 576-1167. Shareholders that invest in the Portfolio through a financial intermediary should contact their financial intermediary regarding purchase and redemption procedures. The Portfolio generally is available for investment only by institutional clients, clients of registered investment advisors, clients of financial institutions and a limited number of certain other investors as approved from time to time by the Advisor. All investments are subject to approval of the Advisor.
Tax Information
The dividends and distributions you receive from the Global Small Company Portfolio are taxable and generally will be taxed as ordinary income, capital gains, or some combination of both, unless you are investing through a tax-advantaged arrangement, such as a 401(k) plan or an individual retirement account, in which case distributions may be taxed as ordinary income when withdrawn from the plan or account.
Payments to Financial Intermediaries
If you purchase the Global Small Company Portfolio through a broker-dealer or other financial intermediary (such as a bank), the Portfolio and its related companies may pay the intermediary for the sale of the Portfolio shares and/or related services. These payments may create a conflict of interest by influencing the financial intermediary to recommend the Portfolio over another investment. Ask your financial advisor or visit your financial intermediary’s website for more information.
23
The investment objective of the International Small Company Portfolio (the “Portfolio”) is to achieve long-term capital appreciation.
This table describes the fees and expenses you may pay if you buy, hold or sell shares of the International Small Company Portfolio. You may pay other fees, such as brokerage commissions and other fees to financial intermediaries, which are not reflected in the table and Example below.
year as a percentage of the value of
your investment)
|
|
|
|
|
Management Fee |
| |
|
| ||
|
Other Expenses |
| |
|
| ||
|
Acquired Fund Fees and Expenses |
| |
|
| ||
|
Total Annual Fund Operating Expenses |
| |
|
| ||
|
* |
|
This Example is meant to help you compare the cost of investing in the International Small Company Portfolio with the cost of investing in other mutual funds. The Example assumes that you invest $10,000 in the Portfolio for the time periods indicated. The Example also assumes that your investment has a 5% return each year and that the Portfolio’s operating expenses remain the same. Although your actual costs may be higher or lower, based on these assumptions your costs would be:
|
|
|
|
|
|
| |
|
1 Year |
3 Years |
5 Years |
10 Years | |||
|
$ |
$ |
$ |
$ | |||
|
| ||||||
A mutual fund generally pays
transaction costs, such as commissions, when it buys and sells securities (or
“turns over” its portfolio). A higher portfolio turnover may indicate higher
transaction costs and may result in higher taxes when mutual fund shares are
held in a taxable account. The International Small Company Portfolio does not
pay transaction costs when buying and selling shares of other mutual funds (the
“Underlying Funds”); however, the Underlying Funds pay transaction costs when
buying and selling securities for their portfolio. The transaction costs
incurred by the Underlying Funds, which are not reflected in Annual Fund
Operating Expenses or in the Example, affect the Portfolio’s performance. During
the most recent fiscal year, the Portfolio’s portfolio turnover rate was
24
The International Small Company Portfolio is a “fund of funds,” which means the Portfolio generally allocates its assets among other funds managed by Dimensional Fund Advisors LP (the “Advisor”) (the “Underlying Funds”), although it has the ability to invest directly in securities and derivatives.
To achieve the International Small Company Portfolio’s and the Underlying Funds’ investment objectives, the Advisor implements an integrated investment approach that combines research, portfolio design, portfolio management, and trading functions. As further described below, the Portfolio’s and the Underlying Funds’ designs emphasize long-term drivers of expected returns identified by the Advisor’s research, while balancing risk through broad diversification across companies and sectors. The Advisor’s portfolio management and trading processes further balance those long-term drivers of expected returns with shorter-term drivers of expected returns and trading costs.
The International Small Company Portfolio is designed to provide investors with access to securities portfolios consisting of a broad range of equity securities of primarily small Canadian, Japanese, United Kingdom, Continental European and Asia Pacific companies. The Portfolio also may have some exposure to small capitalization equity securities associated with other countries or regions. The Portfolio pursues its investment objective by investing substantially all of its assets in the following Underlying Funds: The Canadian Small Company Series, The Japanese Small Company Series, The Asia Pacific Small Company Series, The United Kingdom Small Company Series and The Continental Small Company Series of The DFA Investment Trust Company. Periodically, the Advisor will review the allocations for the Portfolio in each Underlying Fund and may adjust allocations to the Underlying Funds or may add or remove Underlying Funds in the Portfolio without notice to shareholders. Each Underlying Fund invests in small companies using a market capitalization weighted approach in each country or region designated by the Advisor as an approved market for investment. A company’s market capitalization is the number of its shares outstanding times its price per share. Under a market capitalization weighted approach, companies with higher market capitalizations generally represent a larger proportion of an Underlying Fund than companies with relatively lower market capitalizations. The Portfolio and Underlying Funds may emphasize certain stocks, including smaller capitalization companies, lower relative price stocks, and/or higher profitability stocks as compared to their representation in the countries and/or regions in which the Portfolio and/or Underlying Funds are authorized to invest. An equity issuer is considered to have a low relative price (i.e., a value stock) primarily because it has a low price in relation to its book value. In assessing relative price, the Advisor may consider additional factors such as price to cash flow or price to earnings ratios. An equity issuer is considered to have high profitability because it has high earnings or profits from operations in relation to its book value or assets. The criteria the Advisor uses for assessing relative price and profitability are subject to change from time to time. As a non-fundamental policy, under normal circumstances, the International Small Company Portfolio, through its investments in the Underlying Funds, will invest at least 80% of its net assets in securities of small companies.
The Advisor may also increase or reduce the International Small Company Portfolio’s and/or Underlying Funds’ exposure to an eligible company, or exclude a company, based on shorter-term considerations, such as a company’s price momentum and investment characteristics. In assessing a company’s investment characteristics, the Advisor considers ratios such as recent changes in assets divided by total assets. The criteria the Advisor uses for assessing a company’s investment characteristics are subject to change from time to time. In addition, the Advisor seeks to reduce trading costs using a flexible trading approach that looks for opportunities to participate in the available market liquidity, while managing turnover and explicit transaction costs.
The International Small Company Portfolio and each Underlying Fund may invest in affiliated and unaffiliated registered and unregistered money market funds to manage its cash pending investment in other securities or to maintain liquidity for the payment of redemptions or other purposes. Investments in money market funds may involve a duplication of certain fees and expenses.
Each Underlying Fund may gain exposure to companies associated with approved markets by purchasing equity securities in the form of depositary receipts, which may be listed or traded outside the issuer’s domicile country. The International Small Company Portfolio and each Underlying Fund may purchase or sell futures contracts and options on futures contracts for equity securities and indices of its approved markets or other equity market
25
securities or indices, including those of the United States, to increase or decrease equity market exposure based on actual or expected cash inflows to or outflows from the Portfolio or Underlying Fund. Because many of the Portfolio’s and the Underlying Funds’ investments may be denominated in foreign currencies, the Portfolio and each Underlying Fund may enter into foreign currency exchange transactions, including foreign currency forward contracts, in connection with the settlement of foreign securities or to transfer cash balances from one currency to another currency.
The International Small Company Portfolio and the Underlying Funds may lend their portfolio securities to generate additional income.
A summary of the investment strategies and policies of the Underlying Funds in which the International Small Company Portfolio invests as of the date of this Prospectus is described in the Portfolio’s Prospectus in the section entitled “ADDITIONAL INFORMATION ON INVESTMENT OBJECTIVES AND POLICIES”.
Fund of Funds Risk: The investment performance of the Portfolio is affected by the investment performance of the Underlying Funds in which the Portfolio invests. The ability of the Portfolio to achieve its investment objective depends on the ability of the Underlying Funds to meet their investment objectives and on the Advisor’s decisions regarding the allocation of the Portfolio’s assets among the Underlying Funds. There can be no assurance that the investment objective of the Portfolio or any Underlying Fund will be achieved. When the Portfolio invests in Underlying Funds, investors are exposed to a proportionate share of the expenses of those Underlying Funds in addition to the expenses of the Portfolio. Through its investments in the Underlying Funds, the Portfolio is subject to the risks of the Underlying Funds’ investments. The risks of the Portfolio’s and Underlying Funds’ investments are described below.
Equity Market Risk: Even a long-term investment approach cannot guarantee a profit. Economic, market, political, and issuer-specific conditions and events will cause the value of equity securities, and the Portfolio that owns them, to rise or fall. Stock markets tend to move in cycles, with periods of rising prices and periods of falling prices.
Foreign Securities and Currencies Risk: Foreign securities prices may decline or fluctuate because of: (a) economic or political actions of foreign governments, and/or (b) less regulated or liquid securities markets. Investors holding these securities may also be exposed to foreign currency risk (the possibility that foreign currency will fluctuate in value against the U.S. dollar or that a foreign government will convert, or be forced to convert, its currency to another currency, changing its value against the U.S. dollar). The Underlying Funds do not hedge foreign currency risk.
Depositary receipts are generally subject to the same risks as the foreign securities that they evidence or into which they may be converted. In addition, the underlying issuers of certain depositary receipts, particularly unsponsored or unregistered depositary receipts, are under no obligation to distribute shareholder communications to the holders of such receipts, or to pass through to them any voting rights with respect to the deposited securities. Depositary receipts that are not sponsored by the issuer may be less liquid and there may be less readily available public information about the issuer.
Small Company Risk: Securities of small companies are often less liquid than those of large companies and this could make it difficult to sell a small company security at a desired time or price. As a result, small company stocks may fluctuate relatively more in price. In general, smaller capitalization companies are also more vulnerable than larger companies to adverse business or economic developments and they may have more limited resources.
26
Profitability Investment Risk: High relative profitability stocks may perform differently from the market as a whole and an investment strategy purchasing these securities may cause the Portfolio or an Underlying Fund to at times underperform equity funds that use other investment strategies.
Value Investment Risk: Value stocks may perform differently from the market as a whole and an investment strategy purchasing these securities may cause the Portfolio or an Underlying Fund to at times underperform equity funds that use other investment strategies. Value stocks can react differently to political, economic, and industry developments than the market as a whole and other types of stocks. Value stocks also may underperform the market for long periods of time.
Derivatives Risk: Derivatives are instruments, such as futures, and options thereon, and foreign currency forward contracts, whose value is derived from that of other assets, rates or indices. The use of derivatives for non-hedging purposes may be considered to carry more risk than other types of investments. When the Portfolio or an Underlying Fund uses derivatives, the Portfolio or Underlying Fund will be directly exposed to the risks of those derivatives. Derivative instruments are subject to a number of risks including counterparty, settlement, liquidity, interest rate, market, credit and management risks, as well as the risk of improper valuation. Changes in the value of a derivative may not correlate perfectly with the underlying asset, rate or index, and the Portfolio or Underlying Fund could lose more than the principal amount invested.
Securities Lending Risk: Securities lending involves the risk that the borrower may fail to return the securities in a timely manner or at all. As a result, the Underlying Funds may lose money and there may be a delay in recovering the loaned securities. The Underlying Funds could also lose money if they do not recover the securities and/or the value of the collateral falls, including the value of investments made with cash collateral. Securities lending also may have certain adverse tax consequences. To the extent that the Portfolio holds securities directly and lends those securities, it will be also subject to the foregoing risks with respect to its loaned securities.
Operational Risk: Operational risks include human error, changes in personnel, system changes, faults in communication, and failures in systems, technology, or processes. Various operational events or circumstances are outside the Advisor’s control, including instances at third parties. The Portfolio and the Advisor seek to reduce these operational risks through controls and procedures. However, these measures do not address every possible risk and may be inadequate to address these risks.
Cyber Security Risk: The Portfolio’s and its service providers’ use of internet, technology and information systems may expose the Portfolio to potential risks linked to cyber security breaches of those technological or information systems. Cyber security breaches, amongst other things, could allow an unauthorized party to gain access to proprietary information, customer data, or fund assets, or cause the Portfolio and/or its service providers to suffer data corruption or lose operational functionality.
27
January 2013-December 2022
|
|
|
|
|
|
|
Periods ending December 31, 2022
|
|
|
|
|
|
|||||||||||||||||
|
1 Year |
5 Years |
10 Years | |||||||||||||||||||
|
International Small Company Portfolio |
|
|
|
|
|
| |||||||||||||||
|
| |||||||||||||||||||||
|
Return Before Taxes |
- |
% |
|
|
|
% |
|
|
|
% |
| ||||||||||
|
| |||||||||||||||||||||
|
Return After Taxes on Distributions |
- |
% |
|
|
- |
% |
|
|
|
% |
| ||||||||||
|
| |||||||||||||||||||||
|
Return After Taxes on Distributions and Sale of Portfolio Shares |
- |
% |
|
|
|
% |
|
|
|
% |
| ||||||||||
|
| |||||||||||||||||||||
|
MSCI World
ex USA Small Cap Index (net dividends) |
- |
% |
|
|
|
% |
|
|
|
% |
| ||||||||||
| |||||||||||||||||||||
Investment Advisor/Portfolio Management
Dimensional Fund Advisors LP serves as the investment advisor for the International Small Company Portfolio and Underlying Funds. The following individuals are responsible for leading the day-to-day management of the Portfolio:
|
• |
Jed S. Fogdall, Global Head of Portfolio Management, Chairman of the Investment Committee, Vice President and Senior Portfolio Manager of the Advisor, has been a portfolio manager of the Portfolio since 2010. | |||||||||||||||||||||||||||||||||||||||||||||||||||||||||||||||||||||||||||||||||||||||||||||||||
|
• |
Arun C. Keswani, Vice President and Senior Portfolio Manager of the Advisor, has been a portfolio manager of the Portfolio since 2015. | |||||||||||||||||||||||||||||||||||||||||||||||||||||||||||||||||||||||||||||||||||||||||||||||||
|
• |
Joel P. Schneider, Deputy Head of Portfolio Management, North America, member of the Investment Committee, Vice President and Senior Portfolio Manager of the Advisor, has been a portfolio manager of the Portfolio since 2020. | |||||||||||||||||||||||||||||||||||||||||||||||||||||||||||||||||||||||||||||||||||||||||||||||||
28
Purchase and Redemption of Fund Shares
Investors may purchase or redeem shares of the International Small Company Portfolio on each day that the NYSE is scheduled to be open for business by first contacting the Portfolio’s transfer agent at (888) 576-1167. Shareholders that invest in the Portfolio through a financial intermediary should contact their financial intermediary regarding purchase and redemption procedures. The Portfolio generally is available for investment only by institutional clients, clients of registered investment advisors, clients of financial institutions and a limited number of certain other investors as approved from time to time by the Advisor. All investments are subject to approval of the Advisor.
Tax Information
The dividends and distributions you receive from the International Small Company Portfolio are taxable and generally will be taxed as ordinary income, capital gains, or some combination of both, unless you are investing through a tax-advantaged arrangement, such as a 401(k) plan or an individual retirement account, in which case distributions may be taxed as ordinary income when withdrawn from the plan or account.
Payments to Financial Intermediaries
If you purchase the International Small Company Portfolio through a broker-dealer or other financial intermediary (such as a bank), the Portfolio and its related companies may pay the intermediary for the sale of the Portfolio shares and/or related services. These payments may create a conflict of interest by influencing the financial intermediary to recommend the Portfolio over another investment. Ask your financial advisor or visit your financial intermediary’s website for more information.
29
The investment objective of the Japanese Small Company Portfolio (the “Portfolio”) is to achieve long-term capital appreciation. The Japanese Small Company Portfolio is a Feeder Portfolio and pursues its objective by investing substantially all of its assets in its corresponding Master Fund, The Japanese Small Company Series (the “Japanese Small Company Series” or the “Series”) of The DFA Investment Trust Company (the “Trust”), which has the same investment objective and policies as the Portfolio.
This table describes the fees and expenses you may pay if you buy, hold or sell shares of the Japanese Small Company Portfolio. You may pay other fees, such as brokerage commissions and other fees to financial intermediaries, which are not reflected in the table and Example below.
year as a percentage of the value of
your investment)
|
|
|
|
|
Management Fee |
| |
|
| ||
|
Other Expenses |
| |
|
| ||
|
Total Annual Fund Operating Expenses |
| |
|
| ||
|
Fee Waiver and/or Expense Reimbursement |
| |
|
| ||
|
Total Annual Fund Operating Expenses After Fee Waiver and/or Expense Reimbursement |
| |
|
| ||
|
* |
| ||
|
** |
|
This Example is meant to help you compare the cost of investing in the Japanese Small Company Portfolio with the cost of investing in other mutual funds. The Example assumes that you invest $10,000 in the Portfolio for the time periods indicated. The Example also assumes that your investment has a 5% return each year and that the Portfolio’s operating expenses remain the same. Although your actual costs may be higher or lower, based on these assumptions your costs would be:
|
|
|
|
|
|
|
|
|
1 Year |
3 Years |
5 Years |
10 Years | |||
|
$ |
$ |
$ |
$ | |||
|
| ||||||
30
The Example reflects the aggregate annual operating expenses of the Japanese Small Company Portfolio and the Portfolio’s portion of the expenses of the Japanese Small Company Series.
The Japanese Small Company
Series pays transaction costs, such as commissions, when it buys and sells
securities (or “turns over” its portfolio). A higher portfolio turnover may
indicate higher transaction costs and may result in higher taxes when Portfolio
shares are held in a taxable account. These costs, which are not reflected in
Annual Fund Operating Expenses or in the Example, affect the Japanese Small
Company Portfolio’s performance. During the most recent fiscal year, the Series’
portfolio turnover rate was
The Japanese Small Company Portfolio is a feeder portfolio that invests substantially all of its assets in the Japanese Small Company Series. To achieve the Portfolio’s and the Series’ investment objectives, the Advisor implements an integrated investment approach that combines research, portfolio design, portfolio management, and trading functions. As further described below, the Series’ design emphasizes long-term drivers of expected returns identified by the Advisor’s research, while balancing risk through broad diversification across companies and sectors. The Advisor’s portfolio management and trading processes further balance those long-term drivers of expected returns with shorter-term drivers of expected returns and trading costs.
The Japanese Small Company Series, using a market capitalization weighted approach, is designed to purchase a broad and diverse group of readily marketable securities of small companies associated with Japan. A company’s market capitalization is the number of its shares outstanding times its price per share. Under a market capitalization weighted approach, companies with higher market capitalizations generally represent a larger proportion of the Series than companies with relatively lower market capitalizations. The Series may emphasize certain stocks, including smaller capitalization companies, lower relative price stocks, and/or higher profitability stocks as compared to their representation in the small company segment of the Japanese market. An equity issuer is considered to have a low relative price (i.e., a value stock) primarily because it has a low price in relation to its book value. In assessing relative price, the Advisor may consider additional factors such as price to cash flow or price to earnings ratios. An equity issuer is considered to have high profitability because it has high earnings or profits from operations in relation to its book value or assets. The criteria the Advisor uses for assessing relative price and profitability are subject to change from time to time.
As a non-fundamental policy, under normal circumstances, the Japanese Small Company Series will invest at least 80% of its net assets in securities of Japanese small companies. The Advisor first ranks eligible companies by market capitalization. The Advisor then determines the universe of eligible securities by defining the maximum market capitalization of a small company in Japan. Based on market capitalization data as of December 31, 2022, the Advisor would consider Japanese small companies to be those companies with a market capitalization below $2,035 million. This threshold will change due to market conditions.
The Advisor may also increase or reduce the Japanese Small Company Series’ exposure to an eligible company, or exclude a company, based on shorter-term considerations, such as a company’s price momentum and investment characteristics. In assessing a company’s investment characteristics, the Advisor considers ratios such as recent changes in assets divided by total assets. The criteria the Advisor uses for assessing a company’s investment characteristics are subject to change from time to time. In addition, the Advisor seeks to reduce trading costs using a flexible trading approach that looks for opportunities to participate in the available market liquidity, while managing turnover and explicit transaction costs.
The Japanese Small Company Series may gain exposure to companies associated with Japan by purchasing equity securities in the form of depositary receipts, which may be listed or traded outside the issuer’s domicile country. The Series and the Japanese Small Company Portfolio each may purchase or sell futures contracts and options on futures contracts for Japanese equity securities and indices or other equity market securities and indices, including those of the United States, to increase or decrease equity market exposure based on actual or
31
expected cash inflows to or outflows from the Series or Portfolio. Because many of the Series’ and the Portfolio’s investments may be denominated in foreign currencies, the Series and the Portfolio may enter into foreign currency exchange transactions, including foreign currency forward contracts, in connection with the settlement of foreign securities or to transfer cash balances from one currency to another currency.
The Japanese Small Company Series may lend its portfolio securities to generate additional income.
Equity Market Risk: Even a long-term investment approach cannot guarantee a profit. Economic, market, political, and issuer-specific conditions and events will cause the value of equity securities, and the Portfolio that owns them, to rise or fall. Stock markets tend to move in cycles, with periods of rising prices and periods of falling prices.
Foreign Securities and Currencies Risk: Foreign securities prices may decline or fluctuate because of: (a) economic or political actions of foreign governments, and/or (b) less regulated or liquid securities markets. Investors holding these securities may also be exposed to foreign currency risk (the possibility that foreign currency will fluctuate in value against the U.S. dollar or that a foreign government will convert, or be forced to convert, its currency to another currency, changing its value against the U.S. dollar). The Series does not hedge foreign currency risk.
Depositary receipts are generally subject to the same risks as the foreign securities that they evidence or into which they may be converted. In addition, the underlying issuers of certain depositary receipts, particularly unsponsored or unregistered depositary receipts, are under no obligation to distribute shareholder communications to the holders of such receipts, or to pass through to them any voting rights with respect to the deposited securities. Depositary receipts that are not sponsored by the issuer may be less liquid and there may be less readily available public information about the issuer.
Japan Market Risk: Because the Series concentrates investments in Japan, the Portfolio’s performance is expected to be closely tied to the social, political and economic conditions within Japan and to be more volatile than the performance of funds with more geographically diverse investments.
Small Company Risk: Securities of small companies are often less liquid than those of large companies and this could make it difficult to sell a small company security at a desired time or price. As a result, small company stocks may fluctuate relatively more in price. In general, smaller capitalization companies are also more vulnerable than larger companies to adverse business or economic developments and they may have more limited resources.
Profitability Investment Risk: High relative profitability stocks may perform differently from the market as a whole and an investment strategy purchasing these securities may cause the Series to at times underperform equity funds that use other investment strategies.
Value Investment Risk: Value stocks may perform differently from the market as a whole and an investment strategy purchasing these securities may cause the Series to at times underperform equity funds that use other investment strategies. Value stocks can react differently to political, economic, and industry developments than the market as a whole and other types of stocks. Value stocks also may underperform the market for long periods of time.
Derivatives Risk: Derivatives are instruments, such as futures, and options thereon, and foreign currency forward contracts, whose value is derived from that of other assets, rates or indices. The use of derivatives for
32
non-hedging purposes may be considered to carry more risk than other types of investments. When the Series and the Portfolio use derivatives, the Portfolio will be directly exposed to the risks of those derivatives. Derivative instruments are subject to a number of risks including counterparty, settlement, liquidity, interest rate, market, credit and management risks, as well as the risk of improper valuation. Changes in the value of a derivative may not correlate perfectly with the underlying asset, rate or index, and the Portfolio could lose more than the principal amount invested.
Securities Lending Risk: Securities lending involves the risk that the borrower may fail to return the securities in a timely manner or at all. As a result, the Series may lose money and there may be a delay in recovering the loaned securities. The Series could also lose money if it does not recover the securities and/or the value of the collateral falls, including the value of investments made with cash collateral. Securities lending also may have certain adverse tax consequences.
Operational Risk: Operational risks include human error, changes in personnel, system changes, faults in communication, and failures in systems, technology, or processes. Various operational events or circumstances are outside the Advisor’s control, including instances at third parties. The Portfolio and the Advisor seek to reduce these operational risks through controls and procedures. However, these measures do not address every possible risk and may be inadequate to address these risks.
Cyber Security Risk: The Portfolio’s and its service providers’ use of internet, technology and information systems may expose the Portfolio to potential risks linked to cyber security breaches of those technological or information systems. Cyber security breaches, amongst other things, could allow an unauthorized party to gain access to proprietary information, customer data, or fund assets, or cause the Portfolio and/or its service providers to suffer data corruption or lose operational functionality.
33
January 2013-December 2022
|
|
|
|
|
|
|
Periods ending December 31, 2022
|
|
|
|
|
|
| ||||||||||||||||
|
1 Year |
5 Years |
10 Years | |||||||||||||||||||
|
Japanese Small Company Portfolio |
|
|
|
|
|
| |||||||||||||||
|
| |||||||||||||||||||||
|
Return Before Taxes |
- |
% |
|
|
- |
% |
|
|
|
% |
| ||||||||||
|
| |||||||||||||||||||||
|
Return After Taxes on Distributions |
- |
% |
|
|
- |
% |
|
|
|
% |
| ||||||||||
|
| |||||||||||||||||||||
|
Return After Taxes on Distributions and Sale of Portfolio Shares |
- |
% |
|
|
- |
% |
|
|
|
% |
| ||||||||||
|
| |||||||||||||||||||||
|
MSCI Japan
Small Cap Index (net dividends) |
- |
% |
|
|
- |
% |
|
|
|
% |
| ||||||||||
| |||||||||||||||||||||
Investment Advisor/Portfolio Management
Dimensional Fund Advisors LP serves as the investment advisor for the Japanese Small Company Portfolio and Japanese Small Company Series. DFA Australia Limited serves as the sub-advisor for the Series. The following individuals are responsible for leading the day-to-day management of the Portfolio and the Series:
|
• |
Jed S. Fogdall, Global Head of Portfolio Management, Chairman of the Investment Committee, Vice President and Senior Portfolio Manager of the Advisor, has been a portfolio manager of the Portfolio since 2010. | |||||||||||||||||||||||||||||||||||||||||||||||||||||||||||||||||||||||||||||||||||||||||||||||||
|
• |
Arun C. Keswani, Vice President and Senior Portfolio Manager of the Advisor, has been a portfolio manager of the Portfolio since 2015. | |||||||||||||||||||||||||||||||||||||||||||||||||||||||||||||||||||||||||||||||||||||||||||||||||
|
• |
Joel P. Schneider, Deputy Head of Portfolio Management, North America, member of the Investment Committee, Vice President and Senior Portfolio Manager of the Advisor, has been a portfolio manager of the Portfolio since 2020. | |||||||||||||||||||||||||||||||||||||||||||||||||||||||||||||||||||||||||||||||||||||||||||||||||
34
Purchase and Redemption of Fund Shares
Investors may purchase or redeem shares of the Japanese Small Company Portfolio on each day that the NYSE is scheduled to be open for business by first contacting the Portfolio’s transfer agent at (888) 576-1167. Shareholders that invest in the Portfolio through a financial intermediary should contact their financial intermediary regarding purchase and redemption procedures. The Portfolio generally is available for investment only by institutional clients, clients of registered investment advisors, clients of financial institutions and a limited number of certain other investors as approved from time to time by the Advisor. All investments are subject to approval of the Advisor.
Tax Information
The dividends and distributions you receive from the Japanese Small Company Portfolio are taxable and generally will be taxed as ordinary income, capital gains, or some combination of both, unless you are investing through a tax-advantaged arrangement, such as a 401(k) plan or an individual retirement account, in which case distributions may be taxed as ordinary income when withdrawn from the plan or account.
Payments to Financial Intermediaries
If you purchase the Japanese Small Company Portfolio through a broker-dealer or other financial intermediary (such as a bank), the Portfolio and its related companies may pay the intermediary for the sale of the Portfolio shares and/or related services. These payments may create a conflict of interest by influencing the financial intermediary to recommend the Portfolio over another investment. Ask your financial advisor or visit your financial intermediary’s website for more information.
35
The investment objective of the Asia Pacific Small Company Portfolio (the “Portfolio”) is to achieve long-term capital appreciation. The Asia Pacific Small Company Portfolio is a Feeder Portfolio and pursues its objective by investing substantially all of its assets in its corresponding Master Fund, The Asia Pacific Small Company Series (the “Asia Pacific Small Company Series” or the “Series”) of The DFA Investment Trust Company (the “Trust”), which has the same investment objective and policies as the Portfolio.
This table describes the fees and expenses you may pay if you buy, hold or sell shares of the Asia Pacific Small Company Portfolio. You may pay other fees, such as brokerage commissions and other fees to financial intermediaries, which are not reflected in the table and Example below.
year as a percentage of the value of
your investment)
|
|
|
|
|
Management Fee |
| |
|
| ||
|
Other Expenses |
| |
|
| ||
|
Total Annual Fund Operating Expenses |
| |
|
| ||
|
Fee Waiver and/or Expense Reimbursement |
| |
|
| ||
|
Total Annual Fund Operating Expenses After Fee Waiver and/or Expense Reimbursement |
| |
|
| ||
|
* |
| ||
|
** |
|
This Example is meant to help you compare the cost of investing in the Asia Pacific Small Company Portfolio with the cost of investing in other mutual funds. The Example assumes that you invest $10,000 in the Portfolio for the time periods indicated. The Example also assumes that your investment has a 5% return each year and that the Portfolio’s operating expenses remain the same. Although your actual costs may be higher or lower, based on these assumptions your costs would be:
|
|
|
|
|
|
|
|
|
1 Year |
3 Years |
5 Years |
10 Years | |||
|
$ |
$ |
$ |
$ | |||
|
| ||||||
36
The Example reflects the aggregate annual operating expenses of the Asia Pacific Small Company Portfolio and the Portfolio’s portion of the expenses of the Asia Pacific Small Company Series.
The Asia Pacific Small Company
Series pays transaction costs, such as commissions, when it buys and sells
securities (or “turns over” its portfolio). A higher portfolio turnover may
indicate higher transaction costs and may result in higher taxes when Portfolio
shares are held in a taxable account. These costs, which are not reflected in
Annual Fund Operating Expenses or in the Example, affect the Asia Pacific Small
Company Portfolio’s performance. During the most recent fiscal year, the Series’
portfolio turnover rate was
The Asia Pacific Small Company Portfolio is a feeder portfolio that invests substantially all of its assets in the Asia Pacific Small Company Series. To achieve the Portfolio’s and the Series’ investment objectives, the Advisor implements an integrated investment approach that combines research, portfolio design, portfolio management, and trading functions. As further described below, the Series’ design emphasizes long-term drivers of expected returns identified by the Advisor’s research, while balancing risk through broad diversification across companies and sectors. The Advisor’s portfolio management and trading processes further balance those long-term drivers of expected returns with shorter-term drivers of expected returns and trading costs.
The Asia Pacific Small Company Series, using a market capitalization weighted approach, is designed to purchase a broad and diverse group of readily marketable securities of small companies associated with Australia, New Zealand and Pacific Rim Asian countries designated by the Advisor as approved markets for investment. A company’s market capitalization is the number of its shares outstanding times its price per share. Under a market capitalization weighted approach, companies with higher market capitalizations generally represent a larger proportion of the Series than companies with relatively lower market capitalizations. The Series may emphasize certain stocks, including smaller capitalization companies, lower relative price stocks, and/or higher profitability stocks as compared to their representation in the small company segment of the region in which the Series is authorized to invest. An equity issuer is considered to have a low relative price (i.e., a value stock) primarily because it has a low price in relation to its book value. In assessing relative price, the Advisor may consider additional factors such as price to cash flow or price to earnings ratios. An equity issuer is considered to have high profitability because it has high earnings or profits from operations in relation to its book value or assets. The criteria the Advisor uses for assessing relative price and profitability are subject to change from time to time.
As a non-fundamental policy, under normal circumstances, the Asia Pacific Small Company Series will invest at least 80% of its net assets in securities of small companies located in Australia, New Zealand and Pacific Rim Asian countries. The Advisor determines the maximum market capitalization of a small company with respect to each country in which the Series invests. Based on market capitalization data as of December 31, 2022, for the Series, the market capitalization of a small company in any country in which the Series invests would be below $4,411 million. This threshold will change due to market conditions.
The Advisor may also increase or reduce the Asia Pacific Small Company Series’ exposure to an eligible company, or exclude a company, based on shorter-term considerations, such as a company’s price momentum and investment characteristics. In assessing a company’s investment characteristics, the Advisor considers ratios such as recent changes in assets divided by total assets. The criteria the Advisor uses for assessing a company’s investment characteristics are subject to change from time to time. In addition, the Advisor seeks to reduce trading costs using a flexible trading approach that looks for opportunities to participate in the available market liquidity, while managing turnover and explicit transaction costs.
The Asia Pacific Small Company Series may gain exposure to companies associated with approved markets by purchasing equity securities in the form of depositary receipts, which may be listed or traded outside the issuer’s domicile country. The Series and the Asia Pacific Small Company Portfolio each may purchase or sell futures
37
contracts and options on futures contracts for Asia Pacific equity securities and indices or other equity market securities and indices, including those of the United States, to increase or decrease equity market exposure based on actual or expected cash inflows to or outflows from the Series or Portfolio. Because many of the Series’ and the Portfolio’s investments may be denominated in foreign currencies, the Series and the Portfolio may enter into foreign currency exchange transactions, including foreign currency forward contracts, in connection with the settlement of foreign securities or to transfer cash balances from one currency to another currency.
The Asia Pacific Small Company Series may lend its portfolio securities to generate additional income.
Equity Market Risk: Even a long-term investment approach cannot guarantee a profit. Economic, market, political, and issuer-specific conditions and events will cause the value of equity securities, and the Portfolio that owns them, to rise or fall. Stock markets tend to move in cycles, with periods of rising prices and periods of falling prices.
Foreign Securities and Currencies Risk: Foreign securities prices may decline or fluctuate because of: (a) economic or political actions of foreign governments, and/or (b) less regulated or liquid securities markets. Investors holding these securities may also be exposed to foreign currency risk (the possibility that foreign currency will fluctuate in value against the U.S. dollar or that a foreign government will convert, or be forced to convert, its currency to another currency, changing its value against the U.S. dollar). The Series does not hedge foreign currency risk.
Depositary receipts are generally subject to the same risks as the foreign securities that they evidence or into which they may be converted. In addition, the underlying issuers of certain depositary receipts, particularly unsponsored or unregistered depositary receipts, are under no obligation to distribute shareholder communications to the holders of such receipts, or to pass through to them any voting rights with respect to the deposited securities. Depositary receipts that are not sponsored by the issuer may be less liquid and there may be less readily available public information about the issuer.
Asia Pacific Market Risk: Because the Series concentrates investments in Asia Pacific countries, the Portfolio’s performance is expected to be closely tied to the social, political and economic conditions within such Asia Pacific countries and to be more volatile than the performance of funds with more geographically diverse investments.
Small Company Risk: Securities of small companies are often less liquid than those of large companies and this could make it difficult to sell a small company security at a desired time or price. As a result, small company stocks may fluctuate relatively more in price. In general, smaller capitalization companies are also more vulnerable than larger companies to adverse business or economic developments and they may have more limited resources.
Profitability Investment Risk: High relative profitability stocks may perform differently from the market as a whole and an investment strategy purchasing these securities may cause the Series to at times underperform equity funds that use other investment strategies.
Value Investment Risk: Value stocks may perform differently from the market as a whole and an investment strategy purchasing these securities may cause the Series to at times underperform equity funds that use other investment strategies. Value stocks can react differently to political, economic, and industry developments than the market as a whole and other types of stocks. Value stocks also may underperform the market for long periods of time.
38
Derivatives Risk: Derivatives are instruments, such as futures, and options thereon, and foreign currency forward contracts, whose value is derived from that of other assets, rates or indices. The use of derivatives for non-hedging purposes may be considered to carry more risk than other types of investments. When the Series and the Portfolio use derivatives, the Portfolio will be directly exposed to the risks of those derivatives. Derivative instruments are subject to a number of risks including counterparty, settlement, liquidity, interest rate, market, credit and management risks, as well as the risk of improper valuation. Changes in the value of a derivative may not correlate perfectly with the underlying asset, rate or index, and the Portfolio could lose more than the principal amount invested.
Securities Lending Risk: Securities lending involves the risk that the borrower may fail to return the securities in a timely manner or at all. As a result, the Series may lose money and there may be a delay in recovering the loaned securities. The Series could also lose money if it does not recover the securities and/or the value of the collateral falls, including the value of investments made with cash collateral. Securities lending also may have certain adverse tax consequences.
Operational Risk: Operational risks include human error, changes in personnel, system changes, faults in communication, and failures in systems, technology, or processes. Various operational events or circumstances are outside the Advisor’s control, including instances at third parties. The Portfolio and the Advisor seek to reduce these operational risks through controls and procedures. However, these measures do not address every possible risk and may be inadequate to address these risks.
Cyber Security Risk: The Portfolio’s and its service providers’ use of internet, technology and information systems may expose the Portfolio to potential risks linked to cyber security breaches of those technological or information systems. Cyber security breaches, amongst other things, could allow an unauthorized party to gain access to proprietary information, customer data, or fund assets, or cause the Portfolio and/or its service providers to suffer data corruption or lose operational functionality.
39
January 2013-December 2022
|
|
|
|
|
|
|
Periods ending December 31, 2022
|
|
|
|
|
|
| ||||||||||||||||
|
1 Year |
5 Years |
10 Years | |||||||||||||||||||
|
Asia Pacific Small Company Portfolio |
|
|
|
|
|
| |||||||||||||||
|
| |||||||||||||||||||||
|
Return Before Taxes |
- |
% |
|
|
|
% |
|
|
|
% |
| ||||||||||
|
| |||||||||||||||||||||
|
Return After Taxes on Distributions |
- |
% |
|
|
- |
% |
|
|
|
% |
| ||||||||||
|
| |||||||||||||||||||||
|
Return After Taxes on Distributions and Sale of Portfolio Shares |
- |
% |
|
|
|
% |
|
|
|
% |
| ||||||||||
|
| |||||||||||||||||||||
|
MSCI Pacific
ex Japan Small Cap Index (net dividends) |
- |
% |
|
|
|
% |
|
|
|
% |
| ||||||||||
| |||||||||||||||||||||
Investment Advisor/Portfolio Management
Dimensional Fund Advisors LP serves as the investment advisor for the Asia Pacific Small Company Portfolio and Asia Pacific Small Company Series. DFA Australia Limited serves as the sub-advisor for the Series. The following individuals are responsible for leading the day-to-day management of the Portfolio and the Series:
|
• |
Jed S. Fogdall, Global Head of Portfolio Management, Chairman of the Investment Committee, Vice President and Senior Portfolio Manager of the Advisor, has been a portfolio manager of the Portfolio since 2010. | |||||||||||||||||||||||||||||||||||||||||||||||||||||||||||||||||||||||||||||||||||||||||||||||||
|
• |
Arun C. Keswani, Vice President and Senior Portfolio Manager of the Advisor, has been a portfolio manager of the Portfolio since 2015. | |||||||||||||||||||||||||||||||||||||||||||||||||||||||||||||||||||||||||||||||||||||||||||||||||
|
• |
Joel P. Schneider, Deputy Head of Portfolio Management, North America, member of the Investment Committee, Vice President and Senior Portfolio Manager of the Advisor, has been a portfolio manager of the Portfolio since 2022. | |||||||||||||||||||||||||||||||||||||||||||||||||||||||||||||||||||||||||||||||||||||||||||||||||
40
Purchase and Redemption of Fund Shares
Investors may purchase or redeem shares of the Asia Pacific Small Company Portfolio on each day that the NYSE is scheduled to be open for business by first contacting the Portfolio’s transfer agent at (888) 576-1167. Shareholders that invest in the Portfolio through a financial intermediary should contact their financial intermediary regarding purchase and redemption procedures. The Portfolio generally is available for investment only by institutional clients, clients of registered investment advisors, clients of financial institutions and a limited number of certain other investors as approved from time to time by the Advisor. All investments are subject to approval of the Advisor.
Tax Information
The dividends and distributions you receive from the Asia Pacific Small Company Portfolio are taxable and generally will be taxed as ordinary income, capital gains, or some combination of both, unless you are investing through a tax-advantaged arrangement, such as a 401(k) plan or an individual retirement account, in which case distributions may be taxed as ordinary income when withdrawn from the plan or account.
Payments to Financial Intermediaries
If you purchase the Asia Pacific Small Company Portfolio through a broker-dealer or other financial intermediary (such as a bank), the Portfolio and its related companies may pay the intermediary for the sale of the Portfolio shares and/or related services. These payments may create a conflict of interest by influencing the financial intermediary to recommend the Portfolio over another investment. Ask your financial advisor or visit your financial intermediary’s website for more information.
41
The investment objective of the United Kingdom Small Company Portfolio (the “Portfolio”) is to achieve long-term capital appreciation. The United Kingdom Small Company Portfolio is a Feeder Portfolio and pursues its objective by investing substantially all of its assets in its corresponding Master Fund, The United Kingdom Small Company Series (the “United Kingdom Small Company Series” or the “Series”) of The DFA Investment Trust Company (the “Trust”), which has the same investment objective and policies as the Portfolio.
This table describes the fees and expenses you may pay if you buy, hold or sell shares of the United Kingdom Small Company Portfolio. You may pay other fees, such as brokerage commissions and other fees to financial intermediaries, which are not reflected in the table and Example below.
year as a percentage of the value of
your investment)
|
|
|
|
|
Management Fee |
| |
|
| ||
|
Other Expenses |
| |
|
| ||
|
Total Annual Fund Operating Expenses |
| |
|
| ||
|
Fee Waiver and/or Expense Reimbursement*** |
| |
|
| ||
|
Total Annual Fund Operating Expenses After Fee Waiver and/or Expense Reimbursement |
| |
|
| ||
|
* |
| ||
|
** |
| ||
|
*** |
|
This Example is meant to help you compare the cost of investing in the United Kingdom Small Company Portfolio with the cost of investing in other mutual funds. The Example assumes that you invest $10,000 in the Portfolio for the time periods indicated. The Example also assumes that your investment has a 5% return each year and that the Portfolio’s operating expenses remain the same. The costs for the Portfolio reflect the net
42
expenses of the Portfolio that result from the Temporary Fee Waiver in the first year only. Although your actual costs may be higher or lower, based on these assumptions your costs would be:
|
|
|
|
|
|
|
|
|
1 Year |
3 Years |
5 Years |
10 Years | |||
|
$ |
$ |
$ |
$ | |||
|
| ||||||
The Example reflects the aggregate annual operating expenses of the United Kingdom Small Company Portfolio and the Portfolio’s portion of the expenses of the United Kingdom Small Company Series.
The United Kingdom Small
Company Series pays transaction costs, such as commissions, when it buys and
sells securities (or “turns over” its portfolio). A higher portfolio turnover
may indicate higher transaction costs and may result in higher taxes when
Portfolio shares are held in a taxable account. These costs, which are not
reflected in Annual Fund Operating Expenses or in the Example, affect the United
Kingdom Small Company Portfolio’s performance. During the most recent fiscal
year, the Series’ portfolio turnover rate was
The United Kingdom Small Company Portfolio is a feeder portfolio that invests substantially all of its assets in the United Kingdom Small Company Series. To achieve the Portfolio’s and the Series’ investment objectives, the Advisor implements an integrated investment approach that combines research, portfolio design, portfolio management, and trading functions. As further described below, the Series’ design emphasizes long-term drivers of expected returns identified by the Advisor’s research, while balancing risk through broad diversification across companies and sectors. The Advisor’s portfolio management and trading processes further balance those long-term drivers of expected returns with shorter-term drivers of expected returns and trading costs.
The United Kingdom Small Company Series, using a market capitalization weighted approach, is designed to purchase a broad and diverse group of readily marketable securities of small companies associated with the United Kingdom. A company’s market capitalization is the number of its shares outstanding times its price per share. Under a market capitalization weighted approach, companies with higher market capitalizations generally represent a larger proportion of the Series than companies with relatively lower market capitalizations. The Series may emphasize certain stocks, including smaller capitalization companies, lower relative price stocks, and/or higher profitability stocks as compared to their representation in the small company segment of the United Kingdom market. An equity issuer is considered to have a low relative price (i.e., a value stock) primarily because it has a low price in relation to its book value. In assessing relative price, the Advisor may consider additional factors such as price to cash flow or price to earnings ratios. An equity issuer is considered to have high profitability because it has high earnings or profits from operations in relation to its book value or assets. The criteria the Advisor uses for assessing relative price and profitability are subject to change from time to time.
As a non-fundamental policy, under normal circumstances, the United Kingdom Small Company Series will invest at least 80% of its net assets in securities of United Kingdom small companies. Based on market capitalization data as of December 31, 2022, the Advisor would consider United Kingdom small companies to be those companies with a market capitalization below $3,773 million. This threshold will change due to market conditions.
The Advisor may also increase or reduce the United Kingdom Small Company Series’ exposure to an eligible company, or exclude a company, based on shorter-term considerations, such as a company’s price momentum and investment characteristics. In assessing a company’s investment characteristics, the Advisor considers ratios such as recent changes in assets divided by total assets. The criteria the Advisor uses for assessing a company’s investment characteristics are subject to change from time to time. In addition, the Advisor seeks to reduce trading costs using a flexible trading approach that looks for opportunities to participate in the available market liquidity, while managing turnover and explicit transaction costs.
43
The United Kingdom Small Company Series may gain exposure to companies associated with the United Kingdom by purchasing equity securities in the form of depositary receipts, which may be listed or traded outside the issuer’s domicile country. The Series and the United Kingdom Small Company Portfolio each may purchase or sell futures contracts and options on futures contracts for United Kingdom equity securities and indices or other equity market securities and indices, including those of the United States, to increase or decrease equity market exposure based on actual or expected cash inflows to or outflows from the Series or Portfolio. Because many of the Series’ and the Portfolio’s investments may be denominated in foreign currencies, the Series and the Portfolio may enter into foreign currency exchange transactions, including foreign currency forward contracts, in connection with the settlement of foreign securities or to transfer cash balances from one currency to another currency.
The United Kingdom Small Company Series may lend its portfolio securities to generate additional income.
Equity Market Risk: Even a long-term investment approach cannot guarantee a profit. Economic, market, political, and issuer-specific conditions and events will cause the value of equity securities, and the Portfolio that owns them, to rise or fall. Stock markets tend to move in cycles, with periods of rising prices and periods of falling prices.
Foreign Securities and Currencies Risk: Foreign securities prices may decline or fluctuate because of: (a) economic or political actions of foreign governments, and/or (b) less regulated or liquid securities markets. Investors holding these securities may also be exposed to foreign currency risk (the possibility that foreign currency will fluctuate in value against the U.S. dollar or that a foreign government will convert, or be forced to convert, its currency to another currency, changing its value against the U.S. dollar). The Series does not hedge foreign currency risk.
Depositary receipts are generally subject to the same risks as the foreign securities that they evidence or into which they may be converted. In addition, the underlying issuers of certain depositary receipts, particularly unsponsored or unregistered depositary receipts, are under no obligation to distribute shareholder communications to the holders of such receipts, or to pass through to them any voting rights with respect to the deposited securities. Depositary receipts that are not sponsored by the issuer may be less liquid and there may be less readily available public information about the issuer.
United Kingdom Market Risk: Because the Series concentrates investments in the United Kingdom, the Portfolio’s performance is expected to be closely tied to the social, political and economic conditions within the United Kingdom and to be more volatile than the performance of funds with more geographically diverse investments.
Small Company Risk: Securities of small companies are often less liquid than those of large companies and this could make it difficult to sell a small company security at a desired time or price. As a result, small company stocks may fluctuate relatively more in price. In general, smaller capitalization companies are also more vulnerable than larger companies to adverse business or economic developments and they may have more limited resources.
Profitability Investment Risk: High relative profitability stocks may perform differently from the market as a whole and an investment strategy purchasing these securities may cause the Series to at times underperform equity funds that use other investment strategies.
44
Value Investment Risk: Value stocks may perform differently from the market as a whole and an investment strategy purchasing these securities may cause the Series to at times underperform equity funds that use other investment strategies. Value stocks can react differently to political, economic, and industry developments than the market as a whole and other types of stocks. Value stocks also may underperform the market for long periods of time.
Derivatives Risk: Derivatives are instruments, such as futures, and options thereon, and foreign currency forward contracts, whose value is derived from that of other assets, rates or indices. The use of derivatives for non-hedging purposes may be considered to carry more risk than other types of investments. When the Series and the Portfolio use derivatives, the Portfolio will be directly exposed to the risks of those derivatives. Derivative instruments are subject to a number of risks including counterparty, settlement, liquidity, interest rate, market, credit and management risks, as well as the risk of improper valuation. Changes in the value of a derivative may not correlate perfectly with the underlying asset, rate or index, and the Portfolio could lose more than the principal amount invested.
Securities Lending Risk: Securities lending involves the risk that the borrower may fail to return the securities in a timely manner or at all. As a result, the Series may lose money and there may be a delay in recovering the loaned securities. The Series could also lose money if it does not recover the securities and/or the value of the collateral falls, including the value of investments made with cash collateral. Securities lending also may have certain adverse tax consequences.
Operational Risk: Operational risks include human error, changes in personnel, system changes, faults in communication, and failures in systems, technology, or processes. Various operational events or circumstances are outside the Advisor’s control, including instances at third parties. The Portfolio and the Advisor seek to reduce these operational risks through controls and procedures. However, these measures do not address every possible risk and may be inadequate to address these risks.
Cyber Security Risk: The Portfolio’s and its service providers’ use of internet, technology and information systems may expose the Portfolio to potential risks linked to cyber security breaches of those technological or information systems. Cyber security breaches, amongst other things, could allow an unauthorized party to gain access to proprietary information, customer data, or fund assets, or cause the Portfolio and/or its service providers to suffer data corruption or lose operational functionality.
45
January 2013-December 2022
|
|
|
|
|
|
|
Periods ending December 31, 2022
|
|
|
|
|
|
| ||||||||||||||||
|
1 Year |
5 Years |
10 Years | |||||||||||||||||||
|
United Kingdom Small Company Portfolio |
|
|
|
|
|
| |||||||||||||||
|
| |||||||||||||||||||||
|
Return Before Taxes |
- |
% |
|
|
- |
% |
|
|
|
% |
| ||||||||||
|
| |||||||||||||||||||||
|
Return After Taxes on Distributions |
- |
% |
|
|
- |
% |
|
|
|
% |
| ||||||||||
|
| |||||||||||||||||||||
|
Return After Taxes on Distributions and Sale of Portfolio Shares |
- |
% |
|
|
- |
% |
|
|
|
% |
| ||||||||||
|
| |||||||||||||||||||||
|
MSCI UK
Small Cap Index (net dividends) |
- |
% |
|
|
- |
% |
|
|
|
% |
| ||||||||||
|
| |||||||||||||||||||||
Investment Advisor/Portfolio Management
Dimensional Fund Advisors LP serves as the investment advisor for the United Kingdom Small Company Portfolio and United Kingdom Small Company Series. Dimensional Fund Advisors Ltd. serves as the sub-advisor for the Series. The following individuals are responsible for leading the day-to-day management of the Portfolio and the Series:
|
• |
Jed S. Fogdall, Global Head of Portfolio Management, Chairman of the Investment Committee, Vice President and Senior Portfolio Manager of the Advisor, has been a portfolio manager of the Portfolio since 2010. | |||||||||||||||||||||||||||||||||||||||||||||||||||||||||||||||||||||||||||||||||||||||||||||||||
|
• |
Arun C. Keswani, Vice President and Senior Portfolio Manager of the Advisor, has been a portfolio manager of the Portfolio since 2015. | |||||||||||||||||||||||||||||||||||||||||||||||||||||||||||||||||||||||||||||||||||||||||||||||||
|
• |
Joel P. Schneider, Deputy Head of Portfolio Management, North America, member of the Investment Committee, Vice President and Senior Portfolio Manager of the Advisor, has been a portfolio manager of the Portfolio since 2020. | |||||||||||||||||||||||||||||||||||||||||||||||||||||||||||||||||||||||||||||||||||||||||||||||||
46
Purchase and Redemption of Fund Shares
Investors may purchase or redeem shares of the United Kingdom Small Company Portfolio on each day that the NYSE is scheduled to be open for business by first contacting the Portfolio’s transfer agent at (888) 576-1167. Shareholders that invest in the Portfolio through a financial intermediary should contact their financial intermediary regarding purchase and redemption procedures. The Portfolio generally is available for investment only by institutional clients, clients of registered investment advisors, clients of financial institutions and a limited number of certain other investors as approved from time to time by the Advisor. All investments are subject to approval of the Advisor.
Tax Information
The dividends and distributions you receive from the United Kingdom Small Company Portfolio are taxable and generally will be taxed as ordinary income, capital gains, or some combination of both, unless you are investing through a tax-advantaged arrangement, such as a 401(k) plan or an individual retirement account, in which case distributions may be taxed as ordinary income when withdrawn from the plan or account.
Payments to Financial Intermediaries
If you purchase the United Kingdom Small Company Portfolio through a broker-dealer or other financial intermediary (such as a bank), the Portfolio and its related companies may pay the intermediary for the sale of the Portfolio shares and/or related services. These payments may create a conflict of interest by influencing the financial intermediary to recommend the Portfolio over another investment. Ask your financial advisor or visit your financial intermediary’s website for more information.
47
The investment objective of the Continental Small Company Portfolio (the “Portfolio”) is to achieve long-term capital appreciation. The Continental Small Company Portfolio is a Feeder Portfolio and pursues its objective by investing substantially all of its assets in its corresponding Master Fund, The Continental Small Company Series (the “Continental Small Company Series” or the “Series”) of The DFA Investment Trust Company (the “Trust”), which has the same investment objective and policies as the Portfolio.
This table describes the fees and expenses you may pay if you buy, hold or sell shares of the Continental Small Company Portfolio. You may pay other fees, such as brokerage commissions and other fees to financial intermediaries, which are not reflected in the table and Example below.
year as a percentage of the value of
your investment)
|
|
|
|
|
Management Fee |
| |
|
| ||
|
Other Expenses |
| |
|
| ||
|
Total Annual Fund Operating Expenses |
| |
|
| ||
|
Fee Waiver and/or Expense Reimbursement |
| |
|
| ||
|
Total Annual Fund Operating Expenses After Fee Waiver and/or Expense Reimbursement |
| |
|
| ||
|
* |
| ||
|
** |
|
This Example is meant to help you compare the cost of investing in the Continental Small Company Portfolio with the cost of investing in other mutual funds. The Example assumes that you invest $10,000 in the Portfolio for the time periods indicated. The Example also assumes that your investment has a 5% return each year and that the Portfolio’s operating expenses remain the same. Although your actual costs may be higher or lower, based on these assumptions your costs would be:
|
|
|
|
|
|
|
|
|
1 Year |
3 Years |
5 Years |
10 Years | |||
|
$ |
$ |
$ |
$ | |||
|
| ||||||
48
The Example reflects the aggregate annual operating expenses of the Continental Small Company Portfolio and the Portfolio’s portion of the expenses of the Continental Small Company Series.
The Continental Small Company
Series pays transaction costs, such as commissions, when it buys and sells
securities (or “turns over” its portfolio). A higher portfolio turnover may
indicate higher transaction costs and may result in higher taxes when Portfolio
shares are held in a taxable account. These costs, which are not reflected in
Annual Fund Operating Expenses or in the Example, affect the Continental Small
Company Portfolio’s performance. During the most recent fiscal year, the Series’
portfolio turnover rate was
The Continental Small Company Portfolio is a feeder portfolio that invests substantially all of its assets in the Continental Small Company Series. To achieve the Portfolio’s and the Series’ investment objectives, the Advisor implements an integrated investment approach that combines research, portfolio design, portfolio management, and trading functions. As further described below, the Series’ design emphasizes long-term drivers of expected returns identified by the Advisor’s research, while balancing risk through broad diversification across companies and sectors. The Advisor’s portfolio management and trading processes further balance those long-term drivers of expected returns with shorter-term drivers of expected returns and trading costs.
The Continental Small Company Series, using a market capitalization weighted approach, is designed to purchase a broad and diverse group of readily marketable securities of small companies associated with European countries designated by the Advisor as approved markets for investment. A company’s market capitalization is the number of its shares outstanding times its price per share. Under a market capitalization weighted approach, companies with higher market capitalizations generally represent a larger proportion of the Series than companies with relatively lower market capitalizations. The Series may emphasize certain stocks, including smaller capitalization companies, lower relative price stocks, and/or higher profitability stocks as compared to their representation in the small company segment of the region in which the Series is authorized to invest. An equity issuer is considered to have a low relative price (i.e., a value stock) primarily because it has a low price in relation to its book value. In assessing relative price, the Advisor may consider additional factors such as price to cash flow or price to earnings ratios. An equity issuer is considered to have high profitability because it has high earnings or profits from operations in relation to its book value or assets. The criteria the Advisor uses for assessing relative price and profitability are subject to change from time to time.
As a non-fundamental policy, under normal circumstances, the Continental Small Company Series will invest at least 80% of its net assets in securities of small companies located in continental Europe. The Advisor determines the maximum market capitalization of a small company with respect to each country or region in which the Series invests. Based on market capitalization data as of December 31, 2022, for the Series, the market capitalization of a small company in any country or region in which the Series invests would be below $8,202 million. This threshold will change due to market conditions. The Series also may invest up to 20% of its net assets in small companies associated with non-European countries that the Advisor has identified as approved markets for investment.
The Advisor may also increase or reduce the Continental Small Company Series’ exposure to an eligible company, or exclude a company, based on shorter-term considerations, such as a company’s price momentum and investment characteristics. In assessing a company’s investment characteristics, the Advisor considers ratios such as recent changes in assets divided by total assets. The criteria the Advisor uses for assessing a company’s investment characteristics are subject to change from time to time. In addition, the Advisor seeks to reduce trading costs using a flexible trading approach that looks for opportunities to participate in the available market liquidity, while managing turnover and explicit transaction costs.
The Continental Small Company Series may gain exposure to companies associated with approved markets by purchasing equity securities in the form of depositary receipts, which may be listed or traded outside the issuer’s
49
domicile country. The Series and the Continental Small Company Portfolio each may purchase or sell futures contracts and options on futures contracts for continental European equity securities and indices or other equity market securities and indices, including those of the United States, to increase or decrease equity market exposure based on actual or expected cash inflows to or outflows from the Series or Portfolio. Because many of the Series’ and the Portfolio’s investments may be denominated in foreign currencies, the Series and the Portfolio may enter into foreign currency exchange transactions, including foreign currency forward contracts, in connection with the settlement of foreign securities or to transfer cash balances from one currency to another currency.
The Continental Small Company Series may lend its portfolio securities to generate additional income.
Equity Market Risk: Even a long-term investment approach cannot guarantee a profit. Economic, market, political, and issuer-specific conditions and events will cause the value of equity securities, and the Portfolio that owns them, to rise or fall. Stock markets tend to move in cycles, with periods of rising prices and periods of falling prices.
Foreign Securities and Currencies Risk: Foreign securities prices may decline or fluctuate because of: (a) economic or political actions of foreign governments, and/or (b) less regulated or liquid securities markets. Investors holding these securities may also be exposed to foreign currency risk (the possibility that foreign currency will fluctuate in value against the U.S. dollar or that a foreign government will convert, or be forced to convert, its currency to another currency, changing its value against the U.S. dollar). The Series does not hedge foreign currency risk.
Depositary receipts are generally subject to the same risks as the foreign securities that they evidence or into which they may be converted. In addition, the underlying issuers of certain depositary receipts, particularly unsponsored or unregistered depositary receipts, are under no obligation to distribute shareholder communications to the holders of such receipts, or to pass through to them any voting rights with respect to the deposited securities. Depositary receipts that are not sponsored by the issuer may be less liquid and there may be less readily available public information about the issuer.
European Market Risk: Because the Series concentrates investments in European countries, the Portfolio’s performance is expected to be closely tied to the social, political and economic conditions within such European countries and to be more volatile than the performance of funds with more geographically diverse investments.
Small Company Risk: Securities of small companies are often less liquid than those of large companies and this could make it difficult to sell a small company security at a desired time or price. As a result, small company stocks may fluctuate relatively more in price. In general, smaller capitalization companies are also more vulnerable than larger companies to adverse business or economic developments and they may have more limited resources.
Profitability Investment Risk: High relative profitability stocks may perform differently from the market as a whole and an investment strategy purchasing these securities may cause the Series to at times underperform equity funds that use other investment strategies.
Value Investment Risk: Value stocks may perform differently from the market as a whole and an investment strategy purchasing these securities may cause the Series to at times underperform equity funds that use other investment strategies. Value stocks can react differently to political, economic, and industry developments than
50
the market as a whole and other types of stocks. Value stocks also may underperform the market for long periods of time.
Derivatives Risk: Derivatives are instruments, such as futures, and options thereon, and foreign currency forward contracts, whose value is derived from that of other assets, rates or indices. The use of derivatives for non-hedging purposes may be considered to carry more risk than other types of investments. When the Series and the Portfolio use derivatives, the Portfolio will be directly exposed to the risks of those derivatives. Derivative instruments are subject to a number of risks including counterparty, settlement, liquidity, interest rate, market, credit and management risks, as well as the risk of improper valuation. Changes in the value of a derivative may not correlate perfectly with the underlying asset, rate or index, and the Portfolio could lose more than the principal amount invested.
Securities Lending Risk: Securities lending involves the risk that the borrower may fail to return the securities in a timely manner or at all. As a result, the Series may lose money and there may be a delay in recovering the loaned securities. The Series could also lose money if it does not recover the securities and/or the value of the collateral falls, including the value of investments made with cash collateral. Securities lending also may have certain adverse tax consequences.
Operational Risk: Operational risks include human error, changes in personnel, system changes, faults in communication, and failures in systems, technology, or processes. Various operational events or circumstances are outside the Advisor’s control, including instances at third parties. The Portfolio and the Advisor seek to reduce these operational risks through controls and procedures. However, these measures do not address every possible risk and may be inadequate to address these risks.
Cyber Security Risk: The Portfolio’s and its service providers’ use of internet, technology and information systems may expose the Portfolio to potential risks linked to cyber security breaches of those technological or information systems. Cyber security breaches, amongst other things, could allow an unauthorized party to gain access to proprietary information, customer data, or fund assets, or cause the Portfolio and/or its service providers to suffer data corruption or lose operational functionality.
51
January 2013-December 2022
|
|
|
|
|
|
|
Periods ending December 31, 2022
|
|
|
|
|
|
| ||||||||||||||||
|
1 Year |
5 Years |
10 Years | |||||||||||||||||||
|
Continental Small Company Portfolio |
|
|
|
|
|
| |||||||||||||||
|
| |||||||||||||||||||||
|
Return Before Taxes |
- |
% |
|
|
|
% |
|
|
|
% |
| ||||||||||
|
| |||||||||||||||||||||
|
Return After Taxes on Distributions |
- |
% |
|
|
|
% |
|
|
|
% |
| ||||||||||
|
| |||||||||||||||||||||
|
Return After Taxes on Distributions and Sale of Portfolio Shares |
- |
% |
|
|
|
% |
|
|
|
% |
| ||||||||||
|
| |||||||||||||||||||||
|
MSCI Europe
ex UK Small Cap Index (net dividends) |
- |
% |
|
|
|
% |
|
|
|
% |
| ||||||||||
| |||||||||||||||||||||
Investment Advisor/Portfolio Management
Dimensional Fund Advisors LP serves as the investment advisor for the Continental Small Company Portfolio and Continental Small Company Series. Dimensional Fund Advisors Ltd. serves as the sub-advisor for the Series. The following individuals are responsible for leading the day-to-day management of the Portfolio and the Series:
|
• |
Jed S. Fogdall, Global Head of Portfolio Management, Chairman of the Investment Committee, Vice President and Senior Portfolio Manager of the Advisor, has been a portfolio manager of the Portfolio since 2010. | |||||||||||||||||||||||||||||||||||||||||||||||||||||||||||||||||||||||||||||||||||||||||||||||||
|
• |
Arun C. Keswani, Vice President and Senior Portfolio Manager of the Advisor, has been a portfolio manager of the Portfolio since 2015. | |||||||||||||||||||||||||||||||||||||||||||||||||||||||||||||||||||||||||||||||||||||||||||||||||
|
• |
Joel P. Schneider, Deputy Head of Portfolio Management, North America, member of the Investment Committee, Vice President and Senior Portfolio Manager of the Advisor, has been a portfolio manager of the Portfolio since 2020. | |||||||||||||||||||||||||||||||||||||||||||||||||||||||||||||||||||||||||||||||||||||||||||||||||
52
Purchase and Redemption of Fund Shares
Investors may purchase or redeem shares of the Continental Small Company Portfolio on each day that the NYSE is scheduled to be open for business by first contacting the Portfolio’s transfer agent at (888) 576-1167. Shareholders that invest in the Portfolio through a financial intermediary should contact their financial intermediary regarding purchase and redemption procedures. The Portfolio generally is available for investment only by institutional clients, clients of registered investment advisors, clients of financial institutions and a limited number of certain other investors as approved from time to time by the Advisor. All investments are subject to approval of the Advisor.
Tax Information
The dividends and distributions you receive from the Continental Small Company Portfolio are taxable and generally will be taxed as ordinary income, capital gains, or some combination of both, unless you are investing through a tax-advantaged arrangement, such as a 401(k) plan or an individual retirement account, in which case distributions may be taxed as ordinary income when withdrawn from the plan or account.
Payments to Financial Intermediaries
If you purchase the Continental Small Company Portfolio through a broker-dealer or other financial intermediary (such as a bank), the Portfolio and its related companies may pay the intermediary for the sale of the Portfolio shares and/or related services. These payments may create a conflict of interest by influencing the financial intermediary to recommend the Portfolio over another investment. Ask your financial advisor or visit your financial intermediary’s website for more information.
53
The investment objective of the DFA International Real Estate Securities Portfolio (the “Portfolio”) is to achieve long-term capital appreciation.
This table describes the fees and expenses you may pay if you buy, hold or sell shares of the DFA International Real Estate Securities Portfolio. You may pay other fees, such as brokerage commissions and other fees to financial intermediaries, which are not reflected in the table and Example below.
year as a percentage of the value of
your investment)
|
|
|
|
|
Management Fee |
| |
|
| ||
|
Other Expenses |
| |
| ||
|
Total Annual Fund Operating Expenses |
| |
|
| ||
This Example is meant to help you compare the cost of investing in the DFA International Real Estate Securities Portfolio with the cost of investing in other mutual funds. The Example assumes that you invest $10,000 in the Portfolio for the time periods indicated. The Example also assumes that your investment has a 5% return each year and that the Portfolio’s operating expenses remain the same. Although your actual costs may be higher or lower, based on these assumptions your costs would be:
|
|
|
|
|
|
|
|
|
1 Year |
3 Years |
5 Years |
10 Years | |||
|
$ |
$ |
$ |
$ | |||
|
| ||||||
The DFA International Real
Estate Securities Portfolio pays transaction costs, such as commissions, when it
buys and sells securities (or “turns over” its portfolio). A higher portfolio
turnover may indicate higher transaction costs and may result in higher taxes
when Portfolio shares are held in a taxable account. These costs, which are not
reflected in Annual Fund Operating Expenses or in the Example, affect the
Portfolio’s performance. During the most recent fiscal year, the Portfolio’s
portfolio turnover rate was
To achieve the DFA International Real Estate Securities Portfolio’s investment objective, Dimensional Fund Advisors LP (the “Advisor”) implements an integrated investment approach that combines research, portfolio design, portfolio management, and trading functions.
The Portfolio, using a market capitalization weighted approach, purchases a broad and diverse set of securities of non-U.S. companies principally engaged in the real estate industry, including developed and emerging markets, with a particular focus on non-U.S. real estate investment trusts (“REITs”) and companies the Advisor considers to
54
be REIT-like entities. The Portfolio invests in companies of all sizes. A company’s market capitalization is the number of its shares outstanding times its price per share. Under a market capitalization weighted approach, companies with higher market capitalizations generally represent a larger proportion of the Portfolio than companies with relatively lower market capitalizations. The Advisor may adjust the representation in the Portfolio of an eligible company, or exclude a company, after considering such factors as free float, price momentum, trading strategies, liquidity, size, relative price, profitability, and other factors that the Advisor determines to be appropriate. An equity issuer is considered to have a low relative price (i.e., a value stock) primarily because it has a low price in relation to its book value. In assessing relative price, the Advisor may consider additional factors such as price to cash flow or price to earnings ratios. An equity issuer is considered to have high profitability because it has high earnings or profits from operations in relation to its book value or assets. The criteria the Advisor uses for assessing relative price and profitability are subject to change from time to time. The Advisor also may limit or fix the Portfolio’s exposure to a particular country or issuer.
The DFA International Real Estate Securities Portfolio considers a company to be principally engaged in the real estate industry if the company’s principal activities include ownership, management, development, construction, or sale of residential, commercial or industrial real estate. REITs and REIT-like entities are types of real estate companies that pool investors’ funds for investment primarily in income producing real estate or real estate related loans or interests.
The DFA International Real Estate Securities Portfolio intends to purchase securities of companies associated with developed and emerging markets countries that the Advisor has designated as approved markets for investment. As a non-fundamental policy, under normal circumstances, at least 80% of the Portfolio’s net assets will be invested in securities of companies in the real estate industry. The Portfolio concentrates (i.e., invests more than 25% of its net assets) its investments in securities of companies in the real estate industry. The Portfolio generally considers a company to be principally engaged in the real estate industry if the company (i) derives at least 50% of its revenue or profits from the ownership, management, development, construction, or sale of residential, commercial, industrial, or other real estate; (ii) has at least 50% of the value of its assets invested in residential, commercial, industrial, or other real estate; or (iii) is organized as a REIT or REIT-like entity. The Portfolio also may invest in stapled securities, where one or more of the underlying securities represents interests in a company or subsidiary in the real estate industry.
The DFA International Real Estate Securities Portfolio may gain exposure to companies associated with approved markets by purchasing equity securities in the form of depositary receipts, which may be listed or traded outside the issuer’s domicile country. The Portfolio may purchase or sell futures contracts and options on futures contracts for equity securities and indices to increase or decrease equity market exposure based on actual or expected cash inflows to or outflows from the Portfolio. Because many of the Portfolio’s investments may be denominated in foreign currencies, the Portfolio may enter into foreign currency exchange transactions, including foreign currency forward contracts, in connection with the settlement of foreign securities or to transfer cash balances from one currency to another currency.
The DFA International Real Estate Securities Portfolio may lend its portfolio securities to generate additional income.
Equity Market Risk: Even a long-term investment approach cannot guarantee a profit. Economic, market, political, and issuer-specific conditions and events will cause the value of equity securities, and the Portfolio that owns them, to rise or fall. Stock markets tend to move in cycles, with periods of rising prices and periods of falling prices.
55
Foreign Securities and Currencies Risk: Foreign securities prices may decline or fluctuate because of: (a) economic or political actions of foreign governments, and/or (b) less regulated or liquid securities markets. Investors holding these securities may also be exposed to foreign currency risk (the possibility that foreign currency will fluctuate in value against the U.S. dollar or that a foreign government will convert, or be forced to convert, its currency to another currency, changing its value against the U.S. dollar). The Portfolio does not hedge foreign currency risk.
Depositary receipts are generally subject to the same risks as the foreign securities that they evidence or into which they may be converted. In addition, the underlying issuers of certain depositary receipts, particularly unsponsored or unregistered depositary receipts, are under no obligation to distribute shareholder communications to the holders of such receipts, or to pass through to them any voting rights with respect to the deposited securities. Depositary receipts that are not sponsored by the issuer may be less liquid and there may be less readily available public information about the issuer.
Small and Mid-Cap Company Risk: Securities of small and mid-cap companies are often less liquid than those of large companies and this could make it difficult to sell a small or mid-cap company security at a desired time or price. As a result, small and mid-cap company stocks may fluctuate relatively more in price. In general, small and mid- capitalization companies are also more vulnerable than larger companies to adverse business or economic developments and they may have more limited resources.
Risks of Concentrating in the Real Estate Industry: The Portfolio concentrates (i.e., invests more than 25% of its net assets) its investments in securities of companies in the real estate industry. The exclusive focus by the Portfolio on the real estate industry will cause the Portfolio to be exposed to the general risks of direct real estate ownership. The value of securities in the real estate industry can be affected by changes in real estate values and rental income, property taxes, and tax and regulatory requirements. Also, the value of securities in the real estate industry may decline with changes in interest rates. Investing in REITs and REIT-like entities involves certain unique risks in addition to those risks associated with investing in the real estate industry in general. REITs and REIT-like entities are dependent upon management skill, may not be diversified, and are subject to heavy cash flow dependency and self-liquidation. REITs and REIT-like entities also are subject to the possibility of failing to qualify for tax free pass-through of income. Also, many foreign REIT-like entities are deemed for tax purposes as passive foreign investment companies (PFICs), which could result in the receipt of taxable dividends to shareholders at an unfavorable tax rate. Also, because REITs and REIT-like entities typically are invested in a limited number of projects or in a particular market segment, these entities are more susceptible to adverse developments affecting a single project or market segment than more broadly diversified investments. The performance of the Portfolio may be materially different from the broad equity market.
Emerging Markets Risk: Numerous emerging market countries have a history of, and continue to experience serious, and potentially continuing, economic and political problems. Stock markets in many emerging market countries are relatively small, expensive to trade in and generally have higher risks than those in developed markets. Securities in emerging markets also may be less liquid than those in developed markets and foreigners are often limited in their ability to invest in, and withdraw assets from, these markets. Additional restrictions may be imposed under other conditions. Frontier market countries generally have smaller economies or less developed capital markets and, as a result, the risks of investing in emerging market countries are magnified in frontier market countries.
Derivatives Risk: Derivatives are instruments, such as futures, and options thereon, and foreign currency forward contracts, whose value is derived from that of other assets, rates or indices. The use of derivatives for non-hedging purposes may be considered to carry more risk than other types of investments. When the Portfolio uses derivatives, the Portfolio will be directly exposed to the risks of those derivatives. Derivative instruments are subject to a number of risks including counterparty, settlement, liquidity, interest rate, market, credit and management risks, as well as the risk of improper valuation. Changes in the value of a derivative may not correlate perfectly with the underlying asset, rate or index, and the Portfolio could lose more than the principal amount invested.
Securities Lending Risk: Securities lending involves the risk that the borrower may fail to return the securities in a timely manner or at all. As a result, the Portfolio may lose money and there may be a delay in recovering the loaned securities. The Portfolio could also lose money if it does not recover the securities and/or the value of the
56
collateral falls, including the value of investments made with cash collateral. Securities lending also may have certain adverse tax consequences.
Operational Risk: Operational risks include human error, changes in personnel, system changes, faults in communication, and failures in systems, technology, or processes. Various operational events or circumstances are outside the Advisor’s control, including instances at third parties. The Portfolio and the Advisor seek to reduce these operational risks through controls and procedures. However, these measures do not address every possible risk and may be inadequate to address these risks.
Cyber Security Risk: The Portfolio’s and its service providers’ use of internet, technology and information systems may expose the Portfolio to potential risks linked to cyber security breaches of those technological or information systems. Cyber security breaches, amongst other things, could allow an unauthorized party to gain access to proprietary information, customer data, or fund assets, or cause the Portfolio and/or its service providers to suffer data corruption or lose operational functionality.
January 2013-December 2022
|
|
|
|
|
|
|
57
Periods ending December 31, 2022
|
|
|
|
|
|
| ||||||||||||||||
|
1 Year |
5 Years |
10 Years | |||||||||||||||||||
|
DFA International Real Estate Securities Portfolio |
|
|
|
|
|
| |||||||||||||||
|
| |||||||||||||||||||||
|
Return Before Taxes |
- |
% |
|
|
- |
% |
|
|
|
% |
| ||||||||||
|
| |||||||||||||||||||||
|
Return After Taxes on Distributions |
- |
% |
|
|
- |
% |
|
|
- |
% |
| ||||||||||
|
| |||||||||||||||||||||
|
Return After Taxes on Distributions and Sale of Portfolio Shares |
- |
% |
|
|
- |
% |
|
|
|
% |
| ||||||||||
|
| |||||||||||||||||||||
|
S&P
Global ex U.S. REIT Index(1) (net
dividends) |
- |
% |
|
|
- |
% |
|
|
|
% |
| ||||||||||
| |||||||||||||||||||||
|
(1) |
| |||||||||||||||||||||||||||||||||||||||||||||||||||||||||||||||||||||||||||||||||||||||||||||||||
Investment Advisor/Portfolio Management
Dimensional Fund Advisors LP serves as the investment advisor for the DFA International Real Estate Securities Portfolio. Dimensional Fund Advisors Ltd. and DFA Australia Limited serve as the sub-advisors for the Portfolio. The following individuals are responsible for leading the day-to-day management of the Portfolio:
|
• |
Jed S. Fogdall, Global Head of Portfolio Management, Chairman of the Investment Committee, Vice President and Senior Portfolio Manager of the Advisor, has been a portfolio manager of the Portfolio since 2010. | |||||||||||||||||||||||||||||||||||||||||||||||||||||||||||||||||||||||||||||||||||||||||||||||||
|
• |
Allen Pu, Deputy Head of Portfolio Management, North America, member of the Investment Committee, Vice President and Senior Portfolio Manager of the Advisor, has been a portfolio manager of the Portfolio since 2015. | |||||||||||||||||||||||||||||||||||||||||||||||||||||||||||||||||||||||||||||||||||||||||||||||||
|
• |
Mary T. Phillips, Deputy Head of Portfolio Management, North America, member of the Investment Committee, Vice President and Senior Portfolio Manager of the Advisor, has been a portfolio manager of the Portfolio since 2017. | |||||||||||||||||||||||||||||||||||||||||||||||||||||||||||||||||||||||||||||||||||||||||||||||||
|
• |
William B. Collins-Dean, Vice President and Senior Portfolio Manager of the Advisor, has been a portfolio manager of the Portfolio since 2019. | |||||||||||||||||||||||||||||||||||||||||||||||||||||||||||||||||||||||||||||||||||||||||||||||||
Purchase and Redemption of Fund Shares
Investors may purchase or redeem shares of the DFA International Real Estate Securities Portfolio on each day that the NYSE is scheduled to be open for business by first contacting the Portfolio’s transfer agent at (888) 576-1167. Shareholders that invest in the Portfolio through a financial intermediary should contact their financial intermediary regarding purchase and redemption procedures. The Portfolio generally is available for investment only by institutional clients, clients of registered investment advisors, clients of financial institutions and a limited number of certain other investors as approved from time to time by the Advisor. All investments are subject to approval of the Advisor.
Tax Information
The dividends and distributions you receive from the DFA International Real Estate Securities Portfolio are taxable and generally will be taxed as ordinary income, capital gains, or some combination of both, unless you are investing through a tax-advantaged arrangement, such as a 401(k) plan or an individual retirement account, in which case distributions may be taxed as ordinary income when withdrawn from the plan or account. See “Dividends, Capital Gains Distributions and Taxes—Tax Considerations” in the Portfolio’s Prospectus for special tax considerations with respect to the Portfolio.
58
Payments to Financial Intermediaries
If you purchase the DFA International Real Estate Securities Portfolio through a broker-dealer or other financial intermediary (such as a bank), the Portfolio and its related companies may pay the intermediary for the sale of the Portfolio shares and/or related services. These payments may create a conflict of interest by influencing the financial intermediary to recommend the Portfolio over another investment. Ask your financial advisor or visit your financial intermediary’s website for more information.
59
The investment objective of the DFA Global Real Estate Securities Portfolio (the “Portfolio”) is to achieve long-term capital appreciation.
This table describes the fees and expenses you may pay if you buy, hold or sell shares of the DFA Global Real Estate Securities Portfolio. You may pay other fees, such as brokerage commissions and other fees to financial intermediaries, which are not reflected in the table and Example below.
year as a percentage of the value of
your investment)
|
|
|
|
|
Management Fee |
| |
|
| ||
|
Other Expenses |
| |
|
| ||
|
Acquired Fund Fees and Expenses |
| |
|
| ||
|
Total Annual Fund Operating Expenses |
| |
|
| ||
|
Fee Waiver and/or Expense Reimbursement** |
| |
|
| ||
|
Total Annual Fund Operating Expenses After Fee Waiver and/or Expense Reimbursement |
| |
|
| ||
|
* |
| |||||||||||||||||||||||||||||||||||||||||||||||||||||||||||||||||||||||||||||||||||||||||||||||||
|
** |
| |||||||||||||||||||||||||||||||||||||||||||||||||||||||||||||||||||||||||||||||||||||||||||||||||
This Example is meant to help you compare the cost of investing in the DFA Global Real Estate Securities Portfolio with the cost of investing in other mutual funds. The Example assumes that you invest $10,000 in the Portfolio for the time periods indicated. The Example also assumes that your investment has a 5% return each year and that the Portfolio’s operating expenses remain the same. The costs for the Portfolio reflect the net expenses of the Portfolio that result from the contractual expense waiver in the first year only. Although your actual costs may be higher or lower, based on these assumptions your costs would be:
|
|
|
|
|
|
|
|
|
1 Year |
3 Years |
5 Years |
10 Years | |||
|
$ |
$ |
$ |
$ | |||
|
| ||||||
A mutual fund generally pays transaction costs, such as commissions, when it buys and sells securities (or “turns over” its portfolio). A higher portfolio turnover may indicate higher transaction costs and may result in higher taxes when mutual fund shares are held in a taxable account. The DFA Global Real Estate Securities Portfolio
60
does not pay transaction costs
when buying and selling shares of the Underlying Funds; however, the Underlying
Funds pay transaction costs when buying and selling securities for their
portfolio and the Portfolio pays transaction costs when buying and selling
securities directly. These costs, which are not reflected in Annual Fund
Operating Expenses or in the Example, affect the Portfolio’s performance. During
the most recent fiscal year, the Portfolio’s portfolio turnover rate was
To achieve the DFA Global Real Estate Securities Portfolio’s investment objective, the Advisor implements an integrated investment approach that combines research, portfolio design, portfolio management, and trading functions. The Portfolio seeks to achieve exposure to a broad portfolio of securities of U.S. and non-U.S. companies in the real estate industry, with a focus on real estate investment trusts (“REITs”) or companies that the Advisor considers to be REIT-like entities. The Portfolio invests in companies of all sizes. The Portfolio may pursue its investment objective by investing its assets in the DFA Real Estate Securities Portfolio, DFA International Real Estate Securities Portfolio (the “Underlying Funds”), and/or directly in securities of companies in the real estate industry. Periodically, the Advisor will review the allocations for the Portfolio in each Underlying Fund and may adjust allocations to the Underlying Funds or may add or remove Underlying Funds in the Portfolio without notice to shareholders. The Portfolio and Underlying Funds generally consider a company to be principally engaged in the real estate industry if the company (i) derives at least 50% of its revenue or profits from the ownership, management, development, construction, or sale of residential, commercial, industrial, or other real estate; (ii) has at least 50% of the value of its assets invested in residential, commercial, industrial, or other real estate; or (iii) is organized as a REIT or REIT-like entity. REITs and REIT-like entities are types of real estate companies that pool investors’ funds for investment primarily in income producing real estate or real estate related loans or interests. The Portfolio and each Underlying Fund invest in companies principally engaged in the real estate industry in its designated market using a market capitalization weighted approach. A company’s market capitalization is the number of its shares outstanding times its price per share. Under a market capitalization weighted approach, companies with higher market capitalizations generally represent a larger proportion of the Portfolio and each Underlying Fund than companies with relatively lower market capitalizations. The Advisor may adjust the representation in the Portfolio or the Underlying Funds of an eligible company, or exclude a company, after considering such factors as free float, price momentum, trading strategies, liquidity, size, relative price, profitability, and other factors that the Advisor determines to be appropriate. An equity issuer is considered to have a low relative price (i.e., a value stock) primarily because it has a low price in relation to its book value. In assessing relative price, the Advisor may consider additional factors such as price to cash flow or price to earnings ratios. An equity issuer is considered to have high profitability because it has high earnings or profits from operations in relation to its book value or assets. The criteria the Advisor uses for assessing relative price and profitability are subject to change from time to time. The Advisor also may limit or fix the Portfolio’s exposure to a particular country or issuer.
As a non-fundamental policy, under normal circumstances, at least 80% of the DFA Global Real Estate Securities Portfolio’s net assets will be invested directly, or indirectly through its investment in the Underlying Funds, in securities of companies in the real estate industry. The Portfolio concentrates (i.e., invests more than 25% of its net assets) its investments in securities of companies in the real estate industry. In addition to, or in place of, investments in the Underlying Funds, the Portfolio also is permitted to invest directly in the same types of securities of companies in the real estate industry that are eligible investments for the Underlying Funds. The Portfolio and each Underlying Fund intend to purchase securities of companies associated with countries that the Advisor has identified as approved markets for investment for the Portfolio or Underlying Fund. The Portfolio, directly or indirectly through its investment in the Underlying Funds, intends to invest its assets to gain exposure to at least three different countries, including the United States. The Advisor will generally seek to set country weights based on the relative market capitalizations of eligible companies within each approved market of the Underlying Funds. As of the date of the Prospectus, the Portfolio, directly or indirectly through its investment in the Underlying Funds, invests approximately 65% of its net assets in U.S. companies. This percentage will change due to market conditions.
The DFA Global Real Estate Securities Portfolio and each Underlying Fund may purchase or sell futures contracts and options on futures contracts for equity securities and indices to increase or decrease equity market exposure
61
based on actual or expected cash inflows to or outflows from the Portfolio or Underlying Fund. Because many of the Portfolio’s and an Underlying Fund’s investments may be denominated in foreign currencies, the Portfolio and Underlying Fund may enter into foreign currency exchange transactions, including foreign currency forward contracts, in connection with the settlement of foreign securities or to transfer cash balances from one currency to another currency.
The DFA Global Real Estate Securities Portfolio and the Underlying Funds may lend their portfolio securities to generate additional income.
A summary of the investment strategies and policies of the Underlying Funds in which the DFA Global Real Estate Securities Portfolio invests as of the date of this Prospectus (other than the Underlying Funds that are included elsewhere in the Portfolio’s Prospectus) is described in the Portfolio’s Prospectus in the section entitled “ADDITIONAL INFORMATION ON INVESTMENT OBJECTIVES AND POLICIES”.
Fund of Funds Risk: The investment performance of the Portfolio is affected by the investment performance of the Underlying Funds in which the Portfolio invests. The ability of the Portfolio to achieve its investment objective depends on the ability of the Underlying Funds to meet their investment objectives and on the Advisor’s decisions regarding the allocation of the Portfolio’s assets among Underlying Funds. The Portfolio may allocate assets to an Underlying Fund or asset class that under performs other funds or asset classes. There can be no assurance that the investment objective of the Portfolio or any Underlying Fund will be achieved. When the Portfolio invests in Underlying Funds, investors are exposed to a proportionate share of the expenses of those Underlying Funds in addition to the expenses of the Portfolio. Through its investments in the Underlying Funds, the Portfolio is subject to the risks of the Underlying Funds’ investments. The risks of the Portfolio’s and Underlying Funds’ investments are described below.
Equity Market Risk: Even a long-term investment approach cannot guarantee a profit. Economic, market, political, and issuer-specific conditions and events will cause the value of equity securities, and the Portfolio or Underlying Fund that owns them, to rise or fall. Stock markets tend to move in cycles, with periods of rising prices and periods of falling prices.
Foreign Securities and Currencies Risk: Foreign securities prices may decline or fluctuate because of: (a) economic or political actions of foreign governments, and/or (b) less regulated or liquid securities markets. Investors holding these securities may also be exposed to foreign currency risk (the possibility that foreign currency will fluctuate in value against the U.S. dollar or that a foreign government will convert, or be forced to convert, its currency to another currency, changing its value against the U.S. dollar). The Underlying Funds do not hedge foreign currency risk.
Small and Mid-Cap Company Risk: Securities of small and mid-cap companies are often less liquid than those of large companies and this could make it difficult to sell a small or mid-cap company security at a desired time or price. As a result, small and mid-cap company stocks may fluctuate relatively more in price. In general, small and mid-capitalization companies are also more vulnerable than larger companies to adverse business or economic developments and they may have more limited resources.
Risks of Concentrating in the Real Estate Industry: The Portfolio concentrates (i.e., invests more than 25% of its net assets) its investments in securities of companies in the real estate industry. The exclusive focus by the Portfolio on the real estate industry will cause the Portfolio to be exposed to the general risks of direct real estate ownership. The value of securities in the real estate industry can be affected by changes in real estate values and rental income, property taxes, and tax and regulatory requirements. Also, the value of securities in the real estate
62
industry may decline with changes in interest rates. Investing in REITs and REIT-like entities involves certain unique risks in addition to those risks associated with investing in the real estate industry in general. REITs and REIT-like entities are dependent upon management skill, may not be diversified, and are subject to heavy cash flow dependency and self-liquidation. REITs and REIT-like entities also are subject to the possibility of failing to qualify for tax free pass-through of income. Also, many foreign REIT-like entities are deemed for tax purposes as passive foreign investment companies (PFICs), which could result in the receipt of taxable dividends to shareholders at an unfavorable tax rate. Also, because REITs and REIT-like entities typically are invested in a limited number of projects or in a particular market segment, these entities are more susceptible to adverse developments affecting a single project or market segment than more broadly diversified investments. The performance of the Portfolio may be materially different from the broad equity market.
Emerging Markets Risk: Numerous emerging market countries have a history of, and continue to experience serious, and potentially continuing, economic and political problems. Stock markets in many emerging market countries are relatively small, expensive to trade in and generally have higher risks than those in developed markets. Securities in emerging markets also may be less liquid than those in developed markets and foreigners are often limited in their ability to invest in, and withdraw assets from, these markets. Additional restrictions may be imposed under other conditions. Frontier market countries generally have smaller economies or less developed capital markets and, as a result, the risks of investing in emerging market countries are magnified in frontier market countries.
Derivatives Risk: Derivatives are instruments, such as futures, and options thereon, and foreign currency forward contracts, whose value is derived from that of other assets, rates or indices. The use of derivatives for non-hedging purposes may be considered to carry more risk than other types of investments. When the Portfolio or an Underlying Fund uses derivatives, the Portfolio or Underlying Fund will be directly exposed to the risks of those derivatives. Derivative instruments are subject to a number of risks including counterparty, settlement, liquidity, interest rate, market, credit and management risks, as well as the risk of improper valuation. Changes in the value of a derivative may not correlate perfectly with the underlying asset, rate or index, and the Portfolio or Underlying Fund could lose more than the principal amount invested.
Securities Lending Risk: Securities lending involves the risk that the borrower may fail to return the securities in a timely manner or at all. As a result, the Underlying Funds may lose money and there may be a delay in recovering the loaned securities. The Underlying Funds could also lose money if it does not recover the securities and/or the value of the collateral falls, including the value of investments made with cash collateral. Securities lending also may have certain adverse tax consequences. To the extent that the Portfolio holds securities directly and lends those securities, it will be also subject to the foregoing risks with respect to its loaned securities.
Operational Risk: Operational risks include human error, changes in personnel, system changes, faults in communication, and failures in systems, technology, or processes. Various operational events or circumstances are outside the Advisor’s control, including instances at third parties. The Portfolio and the Advisor seek to reduce these operational risks through controls and procedures. However, these measures do not address every possible risk and may be inadequate to address these risks.
Cyber Security Risk: The Portfolio’s and its service providers’ use of internet, technology and information systems may expose the Portfolio to potential risks linked to cyber security breaches of those technological or information systems. Cyber security breaches, amongst other things, could allow an unauthorized party to gain access to proprietary information, customer data, or fund assets, or cause the Portfolio and/or its service providers to suffer data corruption or lose operational functionality.
63
performance.
January 2013-December 2022
|
|
|
|
|
|
|
Periods ending December 31, 2022
|
|
|
|
|
|
| ||||||||||||||||
|
1 Year |
5 Years |
10 Years | |||||||||||||||||||
|
DFA Global Real Estate Securities Portfolio |
|
|
|
|
|
| |||||||||||||||
|
| |||||||||||||||||||||
|
Return Before Taxes |
- |
% |
|
|
|
% |
|
|
|
% |
| ||||||||||
|
| |||||||||||||||||||||
|
Return After Taxes on Distributions |
- |
% |
|
|
|
% |
|
|
|
% |
| ||||||||||
|
| |||||||||||||||||||||
|
Return After Taxes on Distributions and Sale of Portfolio Shares |
- |
% |
|
|
|
% |
|
|
|
% |
| ||||||||||
|
| |||||||||||||||||||||
|
S&P
Global REIT Index(1) (net
dividends) |
- |
% |
|
|
|
% |
|
|
|
% |
| ||||||||||
| |||||||||||||||||||||
|
(1) |
| |||||||||||||||||||||||||||||||||||||||||||||||||||||||||||||||||||||||||||||||||||||||||||||||||
Investment Advisor/Portfolio Management
Dimensional Fund Advisors LP serves as the investment advisor for the DFA Global Real Estate Securities Portfolio and the Underlying Funds. Dimensional Fund Advisors Ltd. and DFA Australia Limited serve as the sub-advisors for the Portfolio and one of the Underlying Funds. The following individuals are responsible for leading day-to-day management of the Portfolio:
64
|
• |
Jed S. Fogdall, Global Head of Portfolio Management, Chairman of the Investment Committee, Vice President and Senior Portfolio Manager of the Advisor, has been a portfolio manager of the Portfolio since 2010. | |||||||||||||||||||||||||||||||||||||||||||||||||||||||||||||||||||||||||||||||||||||||||||||||||
|
• |
Allen Pu, Deputy Head of Portfolio Management, North America, member of the Investment Committee, Vice President and Senior Portfolio Manager of the Advisor, has been a portfolio manager of the Portfolio since 2015. | |||||||||||||||||||||||||||||||||||||||||||||||||||||||||||||||||||||||||||||||||||||||||||||||||
|
• |
Mary T. Phillips, Deputy Head of Portfolio Management, North America, member of the Investment Committee, Vice President and Senior Portfolio Manager of the Advisor, has been a portfolio manager of the Portfolio since 2017. | |||||||||||||||||||||||||||||||||||||||||||||||||||||||||||||||||||||||||||||||||||||||||||||||||
|
• |
William B. Collins-Dean, Vice President and Senior Portfolio Manager of the Advisor, has been a portfolio manager of the Portfolio since 2019. | |||||||||||||||||||||||||||||||||||||||||||||||||||||||||||||||||||||||||||||||||||||||||||||||||
|
• |
Ashish P. Bhagwanjee, Vice President and Senior Portfolio Manager of the Advisor, has been a portfolio manager of the Portfolio since 2020. | |||||||||||||||||||||||||||||||||||||||||||||||||||||||||||||||||||||||||||||||||||||||||||||||||
Purchase and Redemption of Fund Shares
Investors may purchase or redeem shares of the DFA Global Real Estate Securities Portfolio on each day that the NYSE is scheduled to be open for business by first contacting the Portfolio’s transfer agent at (888) 576-1167. Shareholders that invest in the Portfolio through a financial intermediary should contact their financial intermediary regarding purchase and redemption procedures. The Portfolio generally is available for investment only by institutional clients, clients of registered investment advisors, clients of financial institutions and a limited number of certain other investors as approved from time to time by the Advisor. All investments are subject to approval of the Advisor.
Tax Information
The dividends and distributions you receive from the DFA Global Real Estate Securities Portfolio are taxable and generally will be taxed as ordinary income, capital gains, or some combination of both, unless you are investing through a tax-advantaged arrangement, such as a 401(k) plan or an individual retirement account, in which case distributions may be taxed as ordinary income when withdrawn from the plan or account. See “Dividends, Capital Gains Distributions and Taxes—Tax Considerations” in the Portfolio’s Prospectus for special tax considerations with respect to the Portfolio.
Payments to Financial Intermediaries
If you purchase the DFA Global Real Estate Securities Portfolio through a broker-dealer or other financial intermediary (such as a bank), the Portfolio and its related companies may pay the intermediary for the sale of the Portfolio shares and/or related services. These payments may create a conflict of interest by influencing the financial intermediary to recommend the Portfolio over another investment. Ask your financial advisor or visit your financial intermediary’s website for more information.
65
The investment objective of the DFA International Small Cap Value Portfolio (the “Portfolio”) is to achieve long-term capital appreciation.
This table describes the fees and expenses you may pay if you buy, hold or sell shares of the DFA International Small Cap Value Portfolio. You may pay other fees, such as brokerage commissions and other fees to financial intermediaries, which are not reflected in the table and Example below.
year as a percentage of the value of
your investment)
|
|
|
|
|
Management Fee |
| |
|
| ||
|
Other Expenses |
| |
|
| ||
|
Total Annual Fund Operating Expenses |
| |
|
| ||
|
* |
|
This Example is meant to help you compare the cost of investing in the DFA International Small Cap Value Portfolio with the cost of investing in other mutual funds. The Example assumes that you invest $10,000 in the Portfolio for the time periods indicated. The Example also assumes that your investment has a 5% return each year and that the Portfolio’s operating expenses remain the same. Although your actual costs may be higher or lower, based on these assumptions your costs would be:
|
|
|
|
|
|
| |
|
1 Year |
3 Years |
5 Years |
10 Years | |||
|
$ |
$ |
$ |
$ | |||
|
| ||||||
The DFA International Small
Cap Value Portfolio pays transaction costs, such as commissions, when it buys
and sells securities (or “turns over” its portfolio). A higher portfolio
turnover may indicate higher transaction costs and may result in higher taxes
when Portfolio shares are held in a taxable account. These costs, which are not
reflected in Annual Fund Operating Expenses or in the Example, affect the
Portfolio’s performance. During the most recent fiscal year, the Portfolio’s
portfolio turnover rate was
To achieve the DFA International Small Cap Value Portfolio’s investment objective, Dimensional Fund Advisors LP (the “Advisor”) implements an integrated investment approach that combines research, portfolio design, portfolio management, and trading functions. As further described below, the Portfolio’s design emphasizes long-term drivers of expected returns identified by the Advisor’s research, while balancing risk through broad
66
diversification across companies and sectors. The Advisor’s portfolio management and trading processes further balance those long-term drivers of expected returns with shorter-term drivers of expected returns and trading costs.
The DFA International Small Cap Value Portfolio, using a market capitalization weighted approach, is designed to purchase securities of small, non-U.S. companies in countries with developed markets that the Advisor determines to be value stocks at the time of purchase. A company’s market capitalization is the number of its shares outstanding times its price per share. Under a market capitalization weighted approach, companies with higher market capitalizations generally represent a larger proportion of the Portfolio than companies with relatively lower market capitalizations. The Portfolio may emphasize certain stocks, including smaller capitalization companies, lower relative price stocks, and/or higher profitability stocks as compared to their representation in the small-cap value segment of developed ex-U.S. markets. An equity issuer is considered to have a low relative price (i.e., a value stock) primarily because it has a low price in relation to its book value. In assessing relative price, the Advisor may consider additional factors such as price to cash flow or price to earnings ratios. An equity issuer is considered to have high profitability because it has high earnings or profits from operations in relation to its book value or assets. The criteria the Advisor uses for assessing relative price and profitability are subject to change from time to time.
The DFA International Small Cap Value Portfolio intends to purchase securities of small value companies associated with developed market countries that the Advisor has designated as approved markets. As a non-fundamental policy, under normal circumstances, the Portfolio will invest at least 80% of its net assets in securities of small companies in the particular markets in which it invests. The Advisor determines the maximum market capitalization of a small company with respect to each country in which the Portfolio invests. In the countries or regions authorized for investment, the Advisor first ranks eligible companies listed on selected exchanges based on the companies’ market capitalizations. The Advisor then determines the universe of eligible securities by defining the maximum market capitalization of a small company that may be purchased by the Portfolio with respect to each country or region. Based on market capitalization data as of December 31, 2022, for the Portfolio, the market capitalization of a small company in any country in which the Portfolio invests would be below $8,202 million. This threshold will vary by country or region. For example, based on market capitalization data as of December 31, 2022, the Advisor would consider a small company in Switzerland to have a market capitalization below $8,202 million, a small company in Norway to have a market capitalization below $1,765 million, and a small company in Japan to have a market capitalization below $2,035 million. These thresholds will change due to market conditions.
The Advisor may also increase or reduce the DFA International Small Cap Value Portfolio’s exposure to an eligible company, or exclude a company, based on shorter-term considerations, such as a company’s price momentum and investment characteristics. In assessing a company’s investment characteristics, the Advisor considers ratios such as recent changes in assets divided by total assets. The criteria the Advisor uses for assessing a company’s investment characteristics are subject to change from time to time. In addition, the Advisor seeks to reduce trading costs using a flexible trading approach that looks for opportunities to participate in the available market liquidity, while managing turnover and explicit transaction costs.
The DFA International Small Cap Value Portfolio may gain exposure to companies associated with approved markets by purchasing equity securities in the form of depositary receipts, which may be listed or traded outside the issuer’s domicile country. The Portfolio also may purchase or sell futures contracts and options on futures contracts for foreign and U.S. equity securities and indices to increase or decrease equity market exposure based on actual or expected cash inflows to or outflows from the Portfolio. Because many of the Portfolio’s investments may be denominated in foreign currencies, the Portfolio may enter into foreign currency exchange transactions, including foreign currency forward contracts, in connection with the settlement of foreign securities or to transfer cash balances from one currency to another currency.
The DFA International Small Cap Value Portfolio may lend its portfolio securities to generate additional income.
67
Equity Market Risk: Even a long-term investment approach cannot guarantee a profit. Economic, market, political, and issuer-specific conditions and events will cause the value of equity securities, and the Portfolio that owns them, to rise or fall. Stock markets tend to move in cycles, with periods of rising prices and periods of falling prices.
Small Company Risk: Securities of small companies are often less liquid than those of large companies and this could make it difficult to sell a small company security at a desired time or price. As a result, small company stocks may fluctuate relatively more in price. In general, smaller capitalization companies are also more vulnerable than larger companies to adverse business or economic developments and they may have more limited resources.
Foreign Securities and Currencies Risk: Foreign securities prices may decline or fluctuate because of: (a) economic or political actions of foreign governments, and/or (b) less regulated or liquid securities markets. Investors holding these securities may also be exposed to foreign currency risk (the possibility that foreign currency will fluctuate in value against the U.S. dollar or that a foreign government will convert, or be forced to convert, its currency to another currency, changing its value against the U.S. dollar). The Portfolio does not hedge foreign currency risk.
Depositary receipts are generally subject to the same risks as the foreign securities that they evidence or into which they may be converted. In addition, the underlying issuers of certain depositary receipts, particularly unsponsored or unregistered depositary receipts, are under no obligation to distribute shareholder communications to the holders of such receipts, or to pass through to them any voting rights with respect to the deposited securities. Depositary receipts that are not sponsored by the issuer may be less liquid and there may be less readily available public information about the issuer.
Value Investment Risk: Value stocks may perform differently from the market as a whole and an investment strategy purchasing these securities may cause the Portfolio to at times underperform equity funds that use other investment strategies. Value stocks can react differently to political, economic, and industry developments than the market as a whole and other types of stocks. Value stocks also may underperform the market for long periods of time.
Profitability Investment Risk: High relative profitability stocks may perform differently from the market as a whole and an investment strategy purchasing these securities may cause the Portfolio to at times underperform equity funds that use other investment strategies.
Derivatives Risk: Derivatives are instruments, such as futures, and options thereon, and foreign currency forward contracts, whose value is derived from that of other assets, rates or indices. The use of derivatives for non-hedging purposes may be considered to carry more risk than other types of investments. When the Portfolio uses derivatives, the Portfolio will be directly exposed to the risks of those derivatives. Derivative instruments are subject to a number of risks including counterparty, settlement, liquidity, interest rate, market, credit and management risks, as well as the risk of improper valuation. Changes in the value of a derivative may not correlate perfectly with the underlying asset, rate or index, and the Portfolio could lose more than the principal amount invested.
Securities Lending Risk: Securities lending involves the risk that the borrower may fail to return the securities in a timely manner or at all. As a result, the Portfolio may lose money and there may be a delay in recovering the loaned securities. The Portfolio could also lose money if it does not recover the securities and/or the value of the collateral falls, including the value of investments made with cash collateral. Securities lending also may have certain adverse tax consequences.
68
Operational Risk: Operational risks include human error, changes in personnel, system changes, faults in communication, and failures in systems, technology, or processes. Various operational events or circumstances are outside the Advisor’s control, including instances at third parties. The Portfolio and the Advisor seek to reduce these operational risks through controls and procedures. However, these measures do not address every possible risk and may be inadequate to address these risks.
Cyber Security Risk: The Portfolio’s and its service providers’ use of internet, technology and information systems may expose the Portfolio to potential risks linked to cyber security breaches of those technological or information systems. Cyber security breaches, amongst other things, could allow an unauthorized party to gain access to proprietary information, customer data, or fund assets, or cause the Portfolio and/or its service providers to suffer data corruption or lose operational functionality.
January 2013-December 2022
|
|
|
|
|
|
|
69
Periods ending December 31, 2022
|
|
|
|
|
|
| ||||||||||||||||
|
1 Year |
5 Years |
10 Years | |||||||||||||||||||
|
DFA International Small Cap Value Portfolio |
|
|
|
|
|
| |||||||||||||||
|
| |||||||||||||||||||||
|
Return Before Taxes |
- |
% |
|
|
- |
% |
|
|
|
% |
| ||||||||||
|
| |||||||||||||||||||||
|
Return After Taxes on Distributions |
- |
% |
|
|
- |
% |
|
|
|
% |
| ||||||||||
|
| |||||||||||||||||||||
|
Return After Taxes on Distributions and Sale of Portfolio Shares |
- |
% |
|
|
- |
% |
|
|
|
% |
| ||||||||||
| |||||||||||||||||||||
|
MSCI World
ex USA Small Value Index (net dividend) |
|
- |
% |
|
|
|
% |
|
|
|
% |
| |||||||||
| |||||||||||||||||||||
Investment Advisor/Portfolio Management
Dimensional Fund Advisors LP serves as the investment advisor for the DFA International Small Cap Value Portfolio. Dimensional Fund Advisors Ltd. and DFA Australia Limited serve as the sub-advisors for the Portfolio. The following individuals are responsible for leading the day-to-day management of the Portfolio:
|
• |
Jed S. Fogdall, Global Head of Portfolio Management, Chairman of the Investment Committee, Vice President and Senior Portfolio Manager of the Advisor, has been a portfolio manager of the Portfolio since 2010. | |||||||||||||||||||||||||||||||||||||||||||||||||||||||||||||||||||||||||||||||||||||||||||||||||
|
• |
Arun C. Keswani, Vice President and Senior Portfolio Manager of the Advisor, has been a portfolio manager of the Portfolio since 2015. | |||||||||||||||||||||||||||||||||||||||||||||||||||||||||||||||||||||||||||||||||||||||||||||||||
|
• |
Joel P. Schneider, Deputy Head of Portfolio Management, North America, member of the Investment Committee, Vice President and Senior Portfolio Manager of the Advisor, has been a portfolio manager of the Portfolio since 2020. | |||||||||||||||||||||||||||||||||||||||||||||||||||||||||||||||||||||||||||||||||||||||||||||||||
Purchase and Redemption of Fund Shares
Investors may purchase or redeem shares of the DFA International Small Cap Value Portfolio on each day that the NYSE is scheduled to be open for business by first contacting the Portfolio’s transfer agent at (888) 576-1167. Shareholders that invest in the Portfolio through a financial intermediary should contact their financial intermediary regarding purchase and redemption procedures. The Portfolio generally is available for investment only by institutional clients, clients of registered investment advisors, clients of financial institutions and a limited number of certain other investors as approved from time to time by the Advisor. All investments are subject to approval of the Advisor.
Tax Information
The dividends and distributions you receive from the DFA International Small Cap Value Portfolio are taxable and generally will be taxed as ordinary income, capital gains, or some combination of both, unless you are investing through a tax-advantaged arrangement, such as a 401(k) plan or an individual retirement account, in which case distributions may be taxed as ordinary income when withdrawn from the plan or account.
Payments to Financial Intermediaries
If you purchase the DFA International Small Cap Value Portfolio through a broker-dealer or other financial intermediary (such as a bank), the Portfolio and its related companies may pay the intermediary for the sale of the Portfolio shares and/or related services. These payments may create a conflict of interest by influencing the financial intermediary to recommend the Portfolio over another investment. Ask your financial advisor or visit your financial intermediary’s website for more information.
70
The investment objective of the International Vector Equity Portfolio (the “Portfolio”) is to achieve long-term capital appreciation.
This table describes the fees and expenses you may pay if you buy, hold or sell shares of the International Vector Equity Portfolio. You may pay other fees, such as brokerage commissions and other fees to financial intermediaries, which are not reflected in the table and Example below.
year as a percentage of the value of
your investment)
|
|
|
|
|
Management Fee |
| |
|
| ||
|
Other Expenses |
| |
|
| ||
|
Total Annual Fund Operating Expenses |
| |
|
| ||
|
* |
|
This Example is meant to help you compare the cost of investing in the International Vector Equity Portfolio with the cost of investing in other mutual funds. The Example assumes that you invest $10,000 in the Portfolio for the time periods indicated. The Example also assumes that your investment has a 5% return each year and that the Portfolio’s operating expenses remain the same. Although your actual costs may be higher or lower, based on these assumptions your costs would be:
|
|
|
|
|
|
| |
|
1 Year |
3 Years |
5 Years |
10 Years | |||
|
$ |
$ |
$ |
$ | |||
|
| ||||||
The International Vector
Equity Portfolio pays transaction costs, such as commissions, when it buys and
sells securities (or “turns over” its portfolio). A higher portfolio turnover
may indicate higher transaction costs and may result in higher taxes when
Portfolio shares are held in a taxable account. These costs, which are not
reflected in Annual Fund Operating Expenses or in the Example, affect the
Portfolio’s performance. During the most recent fiscal year, the Portfolio’s
portfolio turnover rate was
To achieve the International Vector Equity Portfolio’s investment objective, Dimensional Fund Advisors LP (the “Advisor”) implements an integrated investment approach that combines research, portfolio design, portfolio management, and trading functions. As further described below, the Portfolio’s design emphasizes long-term drivers of expected returns identified by the Advisor’s research, while balancing risk through broad diversification
71
across companies and sectors. The Advisor’s portfolio management and trading processes further balance those long-term drivers of expected returns with shorter-term drivers of expected returns and trading costs.
The International Vector Equity Portfolio is designed to purchase a broad and diverse group of securities of non-U.S. companies in developed markets. The Portfolio invests in companies of all sizes, with increased exposure to smaller capitalization, lower relative price, and higher profitability companies as compared to their representation in the International Universe. For purposes of this Portfolio, the Advisor defines the International Universe as a market capitalization weighted set (e.g., the larger the company, the greater the proportion of the International Universe it represents) of non-U.S. companies in developed markets that have been authorized for investment by the Advisor’s Investment Committee. The Portfolio’s increased exposure to smaller capitalization, lower relative price, and higher profitability companies may be achieved by decreasing the allocation of the Portfolio’s assets to larger capitalization, higher relative price, or lower profitability companies relative to their weight in the International Universe or by avoiding purchases in that segment of the market. An equity issuer is considered to have a high relative price (i.e., a growth stock) primarily because it has a high price in relation to its book value. An equity issuer is considered to have a low relative price (i.e., a value stock) primarily because it has a low price in relation to its book value. In assessing relative price, the Advisor may consider additional factors such as price to cash flow or price to earnings ratios. An equity issuer is considered to have high profitability because it has high earnings or profits from operations in relation to its book value or assets. The criteria the Advisor uses for assessing relative price and profitability are subject to change from time to time.
The Advisor determines company size on a country or region specific basis and based primarily on market capitalization. The Advisor will also establish a minimum market capitalization that a company must meet in order to be considered for purchase, which minimum will change due to market conditions.
The International Vector Equity Portfolio intends to purchase securities of companies associated with developed market countries that the Advisor has designated as approved markets for investment. As a non-fundamental policy, under normal circumstances, the Portfolio will invest at least 80% of its net assets in equity securities. The percentage allocation of the assets of the Portfolio to securities of the largest high relative price companies will generally be reduced by between 5% and 50% of their percentage weight in the International Universe. For example, as of December 31, 2022, securities of the largest high relative price companies in the International Universe comprised approximately 16% of the International Universe and the Advisor allocated approximately less than 1% of the Portfolio to securities of the largest high relative price companies in the International Universe. The percentage by which the Portfolio’s allocation to securities of the largest high relative price companies is reduced, as compared to their representation in the International Universe, will change due to market movements and other factors.
The Advisor may also increase or reduce the International Vector Equity Portfolio’s exposure to an eligible company, or exclude a company, based on shorter-term considerations, such as a company’s price momentum and investment characteristics. In assessing a company’s investment characteristics, the Advisor considers ratios such as recent changes in assets divided by total assets. The criteria the Advisor uses for assessing a company’s investment characteristics are subject to change from time to time. In addition, the Advisor seeks to reduce trading costs using a flexible trading approach that looks for opportunities to participate in the available market liquidity, while managing turnover and explicit transaction costs.
The International Vector Equity Portfolio may gain exposure to companies associated with approved markets by purchasing equity securities in the form of depositary receipts, which may be listed or traded outside the issuer’s domicile country. The Portfolio may purchase or sell futures contracts and options on futures contracts for foreign or U.S. equity securities and indices to increase or decrease equity market exposure based on actual or expected cash inflows to or outflows from the Portfolio. Because many of the Portfolio’s investments may be denominated in foreign currencies, the Portfolio may enter into foreign currency exchange transactions, including foreign currency forward contracts, in connection with the settlement of foreign securities or to transfer cash balances from one currency to another currency.
The International Vector Equity Portfolio may lend its portfolio securities to generate additional income.
72
Equity Market Risk: Even a long-term investment approach cannot guarantee a profit. Economic, market, political, and issuer-specific conditions and events will cause the value of equity securities, and the Portfolio that owns them, to rise or fall. Stock markets tend to move in cycles, with periods of rising prices and periods of falling prices.
Small and Mid-Cap Company Risk: Securities of small and mid-cap companies are often less liquid than those of large companies and this could make it difficult to sell a small or mid-cap company security at a desired time or price. As a result, small and mid-cap company stocks may fluctuate relatively more in price. In general, small and mid- capitalization companies are also more vulnerable than larger companies to adverse business or economic developments and they may have more limited resources.
Foreign Securities and Currencies Risk: Foreign securities prices may decline or fluctuate because of: (a) economic or political actions of foreign governments, and/or (b) less regulated or liquid securities markets. Investors holding these securities may also be exposed to foreign currency risk (the possibility that foreign currency will fluctuate in value against the U.S. dollar or that a foreign government will convert, or be forced to convert, its currency to another currency, changing its value against the U.S. dollar). The Portfolio does not hedge foreign currency risk.
Depositary receipts are generally subject to the same risks as the foreign securities that they evidence or into which they may be converted. In addition, the underlying issuers of certain depositary receipts, particularly unsponsored or unregistered depositary receipts, are under no obligation to distribute shareholder communications to the holders of such receipts, or to pass through to them any voting rights with respect to the deposited securities. Depositary receipts that are not sponsored by the issuer may be less liquid and there may be less readily available public information about the issuer.
Profitability Investment Risk: High relative profitability stocks may perform differently from the market as a whole and an investment strategy purchasing these securities may cause the Portfolio to at times underperform equity funds that use other investment strategies.
Value Investment Risk: Value stocks may perform differently from the market as a whole and an investment strategy purchasing these securities may cause the Portfolio to at times underperform equity funds that use other investment strategies. Value stocks can react differently to political, economic, and industry developments than the market as a whole and other types of stocks. Value stocks also may underperform the market for long periods of time.
Derivatives Risk: Derivatives are instruments, such as futures, and options thereon, and foreign currency forward contracts, whose value is derived from that of other assets, rates or indices. The use of derivatives for non-hedging purposes may be considered to carry more risk than other types of investments. When the Portfolio uses derivatives, the Portfolio will be directly exposed to the risks of those derivatives. Derivative instruments are subject to a number of risks including counterparty, settlement, liquidity, interest rate, market, credit and management risks, as well as the risk of improper valuation. Changes in the value of a derivative may not correlate perfectly with the underlying asset, rate or index, and the Portfolio could lose more than the principal amount invested.
Securities Lending Risk: Securities lending involves the risk that the borrower may fail to return the securities in a timely manner or at all. As a result, the Portfolio may lose money and there may be a delay in recovering the loaned securities. The Portfolio could also lose money if it does not recover the securities and/or the value of the collateral falls, including the value of investments made with cash collateral. Securities lending also may have certain adverse tax consequences.
73
Operational Risk: Operational risks include human error, changes in personnel, system changes, faults in communication, and failures in systems, technology, or processes. Various operational events or circumstances are outside the Advisor’s control, including instances at third parties. The Portfolio and the Advisor seek to reduce these operational risks through controls and procedures. However, these measures do not address every possible risk and may be inadequate to address these risks.
Cyber Security Risk: The Portfolio’s and its service providers’ use of internet, technology and information systems may expose the Portfolio to potential risks linked to cyber security breaches of those technological or information systems. Cyber security breaches, amongst other things, could allow an unauthorized party to gain access to proprietary information, customer data, or fund assets, or cause the Portfolio and/or its service providers to suffer data corruption or lose operational functionality.
January 2013-December 2022
|
|
|
|
|
|
|
74
Periods ending December 31, 2022
|
|
|
|
|
|
| ||||||||||||||||
|
1 Year |
5 Years |
10 Years | |||||||||||||||||||
|
International Vector Equity Portfolio |
|
|
|
|
|
| |||||||||||||||
|
| |||||||||||||||||||||
|
Return Before Taxes |
- |
% |
|
|
|
% |
|
|
|
% |
| ||||||||||
|
| |||||||||||||||||||||
|
Return After Taxes on Distributions |
- |
% |
|
|
|
% |
|
|
|
% |
| ||||||||||
|
| |||||||||||||||||||||
|
Return After Taxes on Distributions and Sale of Portfolio Shares |
- |
% |
|
|
|
% |
|
|
|
% |
| ||||||||||
|
| |||||||||||||||||||||
|
MSCI World
ex USA Index (net dividends) |
- |
% |
|
|
|
% |
|
|
|
% |
| ||||||||||
| |||||||||||||||||||||
Investment Advisor/Portfolio Management
Dimensional Fund Advisors LP serves as the investment advisor for the International Vector Equity Portfolio. Dimensional Fund Advisors Ltd. and DFA Australia Limited serve as the sub-advisors for the Portfolio. The following individuals are responsible for leading the day-to-day management of the Portfolio:
|
• |
Jed S. Fogdall, Global Head of Portfolio Management, Chairman of the Investment Committee, Vice President and Senior Portfolio Manager of the Advisor, has been a portfolio manager of the Portfolio since 2010. | |||||||||||||||||||||||||||||||||||||||||||||||||||||||||||||||||||||||||||||||||||||||||||||||||
|
• |
Allen Pu, Deputy Head of Portfolio Management, North America, member of the Investment Committee, Vice President and Senior Portfolio Manager of the Advisor, has been a portfolio manager of the Portfolio since 2015. | |||||||||||||||||||||||||||||||||||||||||||||||||||||||||||||||||||||||||||||||||||||||||||||||||
|
• |
Mary T. Phillips, Deputy Head of Portfolio Management, North America, member of the Investment Committee, Vice President and Senior Portfolio Manager of the Advisor, has been a portfolio manager of the Portfolio since 2017. | |||||||||||||||||||||||||||||||||||||||||||||||||||||||||||||||||||||||||||||||||||||||||||||||||
|
• |
William B. Collins-Dean, Vice President and Senior Portfolio Manager of the Advisor, has been a portfolio manager of the Portfolio since 2019. | |||||||||||||||||||||||||||||||||||||||||||||||||||||||||||||||||||||||||||||||||||||||||||||||||
Purchase and Redemption of Fund Shares
Investors may purchase or redeem shares of the International Vector Equity Portfolio on each day that the NYSE is scheduled to be open for business by first contacting the Portfolio’s transfer agent at (888) 576-1167. Shareholders that invest in the Portfolio through a financial intermediary should contact their financial intermediary regarding purchase and redemption procedures. The Portfolio generally is available for investment only by institutional clients, clients of registered investment advisors, clients of financial institutions and a limited number of certain other investors as approved from time to time by the Advisor. All investments are subject to approval of the Advisor.
Tax Information
The dividends and distributions you receive from the International Vector Equity Portfolio are taxable and generally will be taxed as ordinary income, capital gains, or some combination of both, unless you are investing through a tax-advantaged arrangement, such as a 401(k) plan or an individual retirement account, in which case distributions may be taxed as ordinary income when withdrawn from the plan or account.
75
Payments to Financial Intermediaries
If you purchase the International Vector Equity Portfolio through a broker-dealer or other financial intermediary (such as a bank), the Portfolio and its related companies may pay the intermediary for the sale of the Portfolio shares and/or related services. These payments may create a conflict of interest by influencing the financial intermediary to recommend the Portfolio over another investment. Ask your financial advisor or visit your financial intermediary’s website for more information.
76
The investment objective of the International High Relative Profitability Portfolio (the “Portfolio”) is to achieve long-term capital appreciation.
This table describes the fees and expenses you may pay if you buy, hold or sell shares of the International High Relative Profitability Portfolio. You may pay other fees, such as brokerage commissions and other fees to financial intermediaries, which are not reflected in the table and Example below.
year as a percentage of the value of
your investment)
|
|
|
|
|
Management Fee |
| |
|
| ||
|
Other Expenses |
| |
|
| ||
|
Total Annual Fund Operating Expenses |
| |
|
| ||
This Example is meant to help you compare the cost of investing in the International High Relative Profitability Portfolio with the cost of investing in other mutual funds. The Example assumes that you invest $10,000 in the Portfolio for the time periods indicated. The Example also assumes that your investment has a 5% return each year and that the Portfolio’s operating expenses remain the same. Although your actual costs may be higher or lower, based on these assumptions, your costs would be:
|
|
|
|
|
|
|
|
|
1 Year |
3 Years |
5 Years |
10 Years | |||
|
$ |
$ |
$ |
$ | |||
|
| ||||||
The International High
Relative Profitability Portfolio pays transaction costs, such as commissions,
when it buys and sells securities (or “turns over” its portfolio). A higher
portfolio turnover may indicate higher transaction costs and may result in
higher taxes when mutual fund shares are held in a taxable account. These costs,
which are not reflected in Annual Fund Operating Expenses or in the Example,
affect the Portfolio’s performance. During the most recent fiscal year, the
Portfolio’s portfolio turnover rate was
To achieve the International High Relative Profitability Portfolio’s investment objective, Dimensional Fund Advisors LP (the “Advisor”) implements an integrated investment approach that combines research, portfolio design, portfolio management, and trading functions. As further described below, the Portfolio’s design emphasizes long-term drivers of expected returns identified by the Advisor’s research, while balancing risk through broad diversification across companies and sectors. The Advisor’s portfolio management and trading processes further balance those long-term drivers of expected returns with shorter-term drivers of expected returns and trading costs.
77
The International High Relative Profitability Portfolio is designed to purchase securities of large non-U.S. companies that the Advisor determines to have high profitability relative to other large capitalization companies in the same country or region, at the time of purchase. An equity issuer is considered to have high profitability because it has high earnings or profits from operations in relation to its book value or assets. The Portfolio may emphasize certain stocks, including smaller capitalization companies, lower relative price stocks, and/or higher profitability stocks as compared to their representation in the large-cap high profitability segments of developed non-U.S. markets. The Portfolio’s increased exposure to such stocks may be achieved by overweighting and/or underweighting eligible stocks based on their market capitalization, relative price, and/or profitability characteristics. An equity issuer is considered to have a low relative price (i.e., a value stock) primarily because it has a low price in relation to its book value. In assessing relative price, the Advisor may consider additional factors such as price to cash flow or price to earnings ratios. The criteria the Advisor uses for assessing relative price and profitability are subject to change from time to time.
The International High Relative Profitability Portfolio intends to purchase securities of large non-U.S. companies associated with developed market countries that the Advisor has designated as approved markets. As a non-fundamental policy, under normal circumstances, the Portfolio will invest at least 80% of its net assets in securities of companies in the particular non-U.S. markets in which the Portfolio invests. The Advisor determines the minimum market capitalization of a large company with respect to each country or region in which the Portfolio invests. Based on market capitalization data as of December 31, 2022, the market capitalization of a large company in any country or region in which the Portfolio invests would be $1,325 million or above. This threshold will change due to market conditions.
The Advisor may also increase or reduce the International High Relative Profitability Portfolio’s exposure to an eligible company, or exclude a company, based on shorter-term considerations, such as a company’s price momentum. In addition, the Advisor seeks to reduce trading costs using a flexible trading approach that looks for opportunities to participate in the available market liquidity, while managing turnover and explicit transaction costs.
The International High Relative Profitability Portfolio may gain exposure to companies in an approved market by purchasing equity securities in the form of depositary receipts, which may be listed or traded outside the issuer’s domicile country. The Portfolio also may purchase or sell futures contracts and options on futures contracts for foreign or U.S. equity securities and indices to increase or decrease equity market exposure based on actual or expected cash inflows to or outflows from the Portfolio. Because many of the Portfolio’s investments may be denominated in foreign currencies, the Portfolio may enter into foreign currency exchange transactions, including foreign currency forward contracts, in connection with the settlement of foreign securities or to transfer cash balances from one currency to another currency. The Portfolio may invest in exchange-traded funds (ETFs) for the purpose of gaining exposure to the equity markets while maintaining liquidity.
The International High Relative Profitability Portfolio may lend its portfolio securities to generate additional income.
Foreign Securities and Currencies Risk: Foreign securities prices may decline or fluctuate because of: (a) economic or political actions of foreign governments, and/or (b) less regulated or liquid securities markets. Investors holding these securities may also be exposed to foreign currency risk (the possibility that foreign currency will fluctuate in value against the U.S. dollar or that a foreign government will convert, or be forced to convert, its currency to another currency, changing its value against the U.S. dollar). The Portfolio does not hedge foreign currency risk.
78
Depositary receipts are generally subject to the same risks as the foreign securities that they evidence or into which they may be converted. In addition, the underlying issuers of certain depositary receipts, particularly unsponsored or unregistered depositary receipts, are under no obligation to distribute shareholder communications to the holders of such receipts, or to pass through to them any voting rights with respect to the deposited securities. Depositary receipts that are not sponsored by the issuer may be less liquid and there may be less readily available public information about the issuer.
Equity Market Risk: Even a long-term investment approach cannot guarantee a profit. Economic, market, political, and issuer-specific conditions and events will cause the value of equity securities, and the Portfolio that owns them, to rise or fall. Stock markets tend to move in cycles, with periods of rising prices and periods of falling prices.
Profitability Investment Risk: High relative profitability stocks may perform differently from the market as a whole and an investment strategy purchasing these securities may cause the Portfolio to at times underperform equity funds that use other investment strategies.
Value Investment Risk: Value stocks may perform differently from the market as a whole and an investment strategy purchasing these securities may cause the Portfolio to at times underperform equity funds that use other investment strategies. Value stocks can react differently to political, economic, and industry developments than the market as a whole and other types of stocks. Value stocks also may underperform the market for long periods of time.
Derivatives Risk: Derivatives are instruments, such as futures contracts, and options thereon, and foreign currency forward contracts, whose value is derived from that of other assets, rates or indices. The use of derivatives for non-hedging purposes may be considered to carry more risk than other types of investments. When the Portfolio uses derivatives, the Portfolio will be directly exposed to the risks of those derivatives. Derivative instruments are subject to a number of risks including counterparty, settlement, liquidity, interest rate, market, credit and management risks, as well as the risk of improper valuation. Changes in the value of a derivative may not correlate perfectly with the underlying asset, rate or index, and the Portfolio could lose more than the principal amount invested.
Securities Lending Risk: Securities lending involves the risk that the borrower may fail to return the securities in a timely manner or at all. As a result, the Portfolio may lose money and there may be a delay in recovering the loaned securities. The Portfolio could also lose money if it does not recover the securities and/or the value of the collateral falls, including the value of investments made with cash collateral. Securities lending also may have certain adverse tax consequences.
Operational Risk: Operational risks include human error, changes in personnel, system changes, faults in communication, and failures in systems, technology, or processes. Various operational events or circumstances are outside the Advisor’s control, including instances at third parties. The Portfolio and the Advisor seek to reduce these operational risks through controls and procedures. However, these measures do not address every possible risk and may be inadequate to address these risks.
Cyber Security Risk: The Portfolio’s and its service providers’ use of internet, technology and information systems may expose the Portfolio to potential risks linked to cyber security breaches of those technological or information systems. Cyber security breaches, amongst other things, could allow an unauthorized party to gain access to proprietary information, customer data, or fund assets, or cause the Portfolio and/or its service providers to suffer data corruption or lose operational functionality.
79
performance.
January 2018-December 2022
|
|
|
|
|
|
|
Periods ending December 31, 2022
|
|
|
|
|
|
| ||||||||||||||||
|
1 Year |
5 Years |
Since
| |||||||||||||||||||
|
International High Relative Profitability Portfolio |
|
|
|
|
|
| |||||||||||||||
|
| |||||||||||||||||||||
|
Return Before Taxes |
- |
% |
|
|
|
% |
|
|
|
% |
| ||||||||||
|
| |||||||||||||||||||||
|
Return After Taxes on Distributions |
- |
% |
|
|
|
% |
|
|
|
% |
| ||||||||||
|
| |||||||||||||||||||||
|
Return After Taxes on Distributions and Sale of Portfolio Shares |
- |
% |
|
|
|
% |
|
|
|
% |
| ||||||||||
|
| |||||||||||||||||||||
|
MSCI World
ex USA Index (net dividends) |
- |
% |
|
|
|
% |
|
|
|
% |
| ||||||||||
| |||||||||||||||||||||
80
Investment Advisor/Portfolio Management
Dimensional Fund Advisors LP serves as the investment advisor for the International High Relative Profitability Portfolio. Dimensional Fund Advisors Ltd. and DFA Australia Limited serve as the sub-advisors for the Portfolio. The following individuals are responsible for leading the day-to-day management of the Portfolio:
|
• |
Jed S. Fogdall, Global Head of Portfolio Management, Chairman of the Investment Committee, Vice President and Senior Portfolio Manager of the Advisor, has been a portfolio manager of the Portfolio since inception (2017). | ||
|
• |
Arun C. Keswani, Vice President and Senior Portfolio Manager of the Advisor, has been a portfolio manager of the Portfolio since 2020. | ||
|
• |
Joel P. Schneider, Deputy Head of Portfolio Management, North America, member of the Investment Committee, Vice President and Senior Portfolio Manager of the Advisor, has been a portfolio manager of the Portfolio since 2022. |
Purchase and Redemption of Fund Shares
Investors may purchase or redeem shares of the International High Relative Profitability Portfolio on each day that the NYSE is scheduled to be open for business by first contacting the Portfolio’s transfer agent at (888) 576-1167. Shareholders that invest in the Portfolio through a financial intermediary should contact their financial intermediary regarding purchase and redemption procedures. The Portfolio generally is available for investment only by institutional clients, clients of registered investment advisors, clients of financial institutions and a limited number of certain other investors as approved from time to time by the Advisor. All investments are subject to approval of the Advisor.
Tax Information
The dividends and distributions you receive from the International High Relative Profitability Portfolio are taxable and generally will be taxed as ordinary income, capital gains, or some combination of both, unless you are investing through a tax-advantaged arrangement, such as a 401(k) plan or an individual retirement account, in which case distributions may be taxed as ordinary income when withdrawn from the plan or account.
Payments to Financial Intermediaries
If you purchase the International High Relative Profitability Portfolio through a broker-dealer or other financial intermediary (such as a bank), the Portfolio and its related companies may pay the intermediary for the sale of the Portfolio shares and/or related services. These payments may create a conflict of interest by influencing the financial intermediary to recommend the Portfolio over another investment. Ask your financial advisor or visit your financial intermediary’s website for more information.
81
The investment objective of the World ex U.S. Value Portfolio (the “Portfolio”) is to achieve long-term capital appreciation.
This table describes the fees and expenses you may pay if you buy, hold or sell shares of the World ex U.S. Value Portfolio. You may pay other fees, such as brokerage commissions and other fees to financial intermediaries, which are not reflected in the table and Example below.
year as a percentage of the value of
your investment)
|
|
|
|
|
Management Fee |
| |
|
| ||
|
Other Expenses |
| |
|
| ||
|
Acquired Fund Fees and Expenses |
| |
|
| ||
|
Total Annual Fund Operating Expenses |
| |
|
| ||
|
Fee Waiver and/or Expense Reimbursement** |
| |
|
| ||
|
Total Annual Fund Operating Expenses After Fee Waiver and/or Expense Reimbursement |
| |
|
| ||
|
* |
| ||
|
** |
|
This Example is meant to help you compare the cost of investing in the World ex U.S. Value Portfolio with the cost of investing in other mutual funds. The Example assumes that you invest $10,000 in the Portfolio for the time periods indicated. The Example also assumes that your investment has a 5% return each year and that the Portfolio’s operating expenses remain the same. The costs for the Portfolio reflect the net expenses of the Portfolio that result from the contractual expense waiver in the first year only. Although your actual costs may be higher or lower, based on these assumptions your costs would be:
|
|
|
|
|
|
|
|
|
1 Year |
3 Years |
5 Years |
10 Years | |||
|
$ |
$ |
$ |
$ | |||
|
| ||||||
A mutual fund generally pays transaction costs, such as commissions, when it buys and sells securities (or “turns over” its portfolio). A higher portfolio turnover may indicate higher transaction costs and may result in higher taxes when mutual fund shares are held in a taxable account. The World ex U.S. Value Portfolio does not pay
82
transaction costs when buying
and selling shares of other mutual funds (the “Underlying Funds”); however, the
Underlying Funds pay transaction costs when buying and selling securities for
their portfolios. The transaction costs incurred by the Underlying Funds, which
are not reflected in Annual Fund Operating Expenses or in the Example, affect
the Portfolio’s performance. During the most recent fiscal year, the Portfolio’s
portfolio turnover rate was
To achieve the World ex U.S. Value Portfolio’s and the Underlying Funds’ investment objectives, Dimensional Fund Advisors LP (the “Advisor”) implements an integrated investment approach that combines research, portfolio design, portfolio management, and trading functions. As further described below, the Portfolio’s and the Underlying Funds’ designs emphasize long-term drivers of expected returns identified by the Advisor’s research, while balancing risk through broad diversification across companies and sectors. The Advisor’s portfolio management and trading processes further balance those long-term drivers of expected returns with shorter-term drivers of expected returns and trading costs.
The World ex U.S. Value Portfolio seeks to achieve its investment objective through exposure to a broad portfolio of securities of non-U.S. companies associated with countries with developed and emerging markets, which may include frontier markets (emerging market countries in an earlier stage of development), that the Advisor believes to be value stocks at the time of purchase. To achieve this exposure, the Advisor will generally purchase shares of The DFA International Value Series (the “DFA International Value Series”), DFA International Small Cap Value Portfolio, and Dimensional Emerging Markets Value Fund (the “Underlying Funds”), which are other funds managed by the Advisor. The Portfolio currently intends to allocate its investments among the Underlying Funds in the following manner: 50% to 80% in the DFA International Value Series; 5% to 20% in the DFA International Small Cap Value Portfolio; and 15% to 45% in the Dimensional Emerging Markets Value Fund. Periodically, the Advisor will review the allocations for the Portfolio in each Underlying Fund and may adjust allocations to the Underlying Funds or may add or remove Underlying Funds in the Portfolio without notice to shareholders. In addition to, or in place of, investments in the Underlying Funds, the Portfolio also is permitted to invest directly in the same types of securities of companies that are described in this Prospectus as eligible investments for the Underlying Funds. An equity issuer is considered to have a low relative price (i.e., a value stock) primarily because it has a low price in relation to its book value. In assessing relative price, the Advisor may consider additional factors such as price to cash flow or price to earnings ratios. The Advisor may consider the relative market capitalization weighting of developed and emerging markets within the universe of eligible securities when allocating Portfolio investments among the Underlying Funds or securities.
The DFA International Value Series invests in large value companies associated with developed market countries and the DFA International Small Cap Value Portfolio invests in small value companies associated with developed market countries. Generally, the Advisor determines if a company is large or small based on its market capitalization. A company’s market capitalization is the number of its shares outstanding times its price per share. Under a market capitalization weighted approach, companies with higher market capitalizations generally represent a larger proportion of an Underlying Fund than companies with relatively lower market capitalizations. The Dimensional Emerging Markets Value Fund may purchase securities of value companies associated with emerging markets, including frontier markets, across all market capitalizations. With respect to each Underlying Fund, the Advisor may limit or fix the Underlying Fund’s exposure to a particular country, region or issuer. The Portfolio and Underlying Funds may emphasize certain stocks, including smaller capitalization companies, lower relative price stocks, and/or higher profitability stocks as compared to their representation in the countries and/or regions in which the Portfolio and/or Underlying Funds are authorized to invest. An equity issuer is considered to have high profitability because it has high earnings or profits from operations in relation to its book value or assets. The criteria the Advisor uses for assessing relative price and profitability are subject to change from time to time.
The World ex U.S. Value Portfolio and each Underlying Fund intend to purchase securities of companies associated with countries that the Advisor has identified as approved markets for investment for such Portfolio or Underlying Fund. As a non-fundamental policy, under normal circumstances, at least 80% of the Portfolio’s net
83
assets will be invested directly, or indirectly through its investment in the Underlying Funds, in securities of non-U.S. companies.
The Advisor may also increase or reduce the World ex U.S. Value Portfolio’s and/or Underlying Funds’ exposure to an eligible company, or exclude a company, based on shorter-term considerations, such as a company’s price momentum and investment characteristics. In assessing a company’s investment characteristics, the Advisor considers ratios such as recent changes in assets divided by total assets. The criteria the Advisor uses for assessing a company’s investment characteristics are subject to change from time to time. In addition, the Advisor seeks to reduce trading costs using a flexible trading approach that looks for opportunities to participate in the available market liquidity, while managing turnover and explicit transaction costs.
The World ex U.S. Value Portfolio and Underlying Funds may gain exposure to companies associated with approved markets by purchasing equity securities in the form of depositary receipts which may be domiciled or traded outside the issuer’s domicile country.
The World ex U.S. Value Portfolio and each Underlying Fund may purchase or sell futures contracts and options on futures contracts for equity securities and indices to increase or decrease equity market exposure based on actual or expected cash inflows to or outflows from the Portfolio or Underlying Fund. Because many of the Portfolio’s and Underlying Funds’ investments may be denominated in foreign currencies, the Portfolio and each Underlying Fund may enter into foreign currency exchange transactions, including foreign currency forward contracts, in connection with the settlement of foreign securities or to transfer cash balances from one currency to another currency.
The World ex U.S. Value Portfolio and Underlying Funds may lend their portfolio securities to generate additional income.
A summary of the investment strategies and policies of the Underlying Funds in which the World ex U.S. Value Portfolio invests as of the date of this Prospectus (other than the Underlying Funds that are included elsewhere in the Portfolio’s Prospectus) is described in the Portfolio’s Prospectus in the section entitled “ADDITIONAL INFORMATION ON INVESTMENT OBJECTIVES AND POLICIES”.
Fund of Funds Risk: The investment performance of the Portfolio is affected by the investment performance of the Underlying Funds in which the Portfolio invests. The ability of the Portfolio to achieve its investment objective depends on the ability of the Underlying Funds to meet their investment objectives and on the Advisor’s decisions regarding the allocation of the Portfolio’s assets among Underlying Funds. The Portfolio may allocate assets to an Underlying Fund or asset class that underperforms other funds or asset classes. There can be no assurance that the investment objective of the Portfolio or any Underlying Fund will be achieved. When the Portfolio invests in Underlying Funds, investors are exposed to a proportionate share of the expenses of those Underlying Funds in addition to the expenses of the Portfolio. Through its investments in the Underlying Funds, the Portfolio is subject to the risks of the Underlying Funds’ investments. The risks of the Portfolio’s and Underlying Funds’ investments are described below.
Equity Market Risk: Even a long-term investment approach cannot guarantee a profit. Economic, market, political, and issuer-specific conditions and events will cause the value of equity securities, and the Portfolio or Underlying Fund that owns them, to rise or fall. Stock markets tend to move in cycles, with periods of rising prices and periods of falling prices.
84
Foreign Securities and Currencies Risk: Foreign securities prices may decline or fluctuate because of: (a) economic or political actions of foreign governments, and/or (b) less regulated or liquid securities markets. Investors holding these securities may also be exposed to foreign currency risk (the possibility that foreign currency will fluctuate in value against the U.S. dollar or that a foreign government will convert, or be forced to convert, its currency to another currency, changing its value against the U.S. dollar). The Underlying Funds do not hedge foreign currency risk.
Depositary receipts are generally subject to the same risks as the foreign securities that they evidence or into which they may be converted. In addition, the underlying issuers of certain depositary receipts, particularly unsponsored or unregistered depositary receipts, are under no obligation to distribute shareholder communications to the holders of such receipts, or to pass through to them any voting rights with respect to the deposited securities. Depositary receipts that are not sponsored by the issuer may be less liquid and there may be less readily available public information about the issuer.
Small and Mid-Cap Company Risk: Securities of small and mid-cap companies are often less liquid than those of large companies and this could make it difficult to sell a small or mid-cap company security at a desired time or price. As a result, small and mid-cap company stocks may fluctuate relatively more in price. In general, small and mid- capitalization companies are also more vulnerable than larger companies to adverse business or economic developments and they may have more limited resources.
Value Investment Risk: Value stocks may perform differently from the market as a whole and an investment strategy purchasing these securities may cause the Portfolio or an Underlying Fund to at times underperform equity funds that use other investment strategies. Value stocks can react differently to political, economic, and industry developments than the market as a whole and other types of stocks. Value stocks also may underperform the market for long periods of time.
Profitability Investment Risk: High relative profitability stocks may perform differently from the market as a whole and an investment strategy purchasing these securities may cause the Portfolio or an Underlying Fund to at times underperform equity funds that use other investment strategies.
Emerging Markets Risk: Numerous emerging market countries have a history of, and continue to experience serious, and potentially continuing, economic and political problems. Stock markets in many emerging market countries are relatively small, expensive to trade in and generally have higher risks than those in developed markets. Securities in emerging markets also may be less liquid than those in developed markets and foreigners are often limited in their ability to invest in, and withdraw assets from, these markets. Additional restrictions may be imposed under other conditions. Frontier market countries generally have smaller economies or less developed capital markets and, as a result, the risks of investing in emerging market countries are magnified in frontier market countries.
Derivatives Risk: Derivatives are instruments, such as futures, and options thereon, and foreign currency forward contracts, whose value is derived from that of other assets, rates or indices. The use of derivatives for non-hedging purposes may be considered to carry more risk than other types of investments. When the Portfolio or an Underlying Fund uses derivatives, the Portfolio or Underlying Fund will be exposed to the risks of those derivatives. Derivative instruments are subject to a number of risks including counterparty, settlement, liquidity, interest rate, market, credit and management risks, as well as the risk of improper valuation. Changes in the value of a derivative may not correlate perfectly with the underlying asset, rate or index, and the Portfolio or Underlying Fund could lose more than the principal amount invested.
Securities Lending Risk: Securities lending involves the risk that the borrower may fail to return the securities in a timely manner or at all. As a result, an Underlying Fund may lose money and there may be a delay in recovering the loaned securities. An Underlying Fund could also lose money if it does not recover the securities and/or the value of the collateral falls, including the value of investments made with cash collateral. Securities lending also may have certain adverse tax consequences. To the extent that the Portfolio holds securities directly and lends those securities, it will be also subject to the foregoing risks with respect to its loaned securities.
Operational Risk: Operational risks include human error, changes in personnel, system changes, faults in communication, and failures in systems, technology, or processes. Various operational events or circumstances
85
are outside the Advisor’s control, including instances at third parties. The Portfolio and the Advisor seek to reduce these operational risks through controls and procedures. However, these measures do not address every possible risk and may be inadequate to address these risks.
Cyber Security Risk: The Portfolio’s and its service providers’ use of internet, technology and information systems may expose the Portfolio to potential risks linked to cyber security breaches of those technological or information systems. Cyber security breaches, amongst other things, could allow an unauthorized party to gain access to proprietary information, customer data, or fund assets, or cause the Portfolio and/or its service providers to suffer data corruption or lose operational functionality.
January 2013-December 2022
|
|
|
|
|
|
|
86
Periods ending December 31, 2022
|
|
|
|
|
|
|||||||||||||||||
|
1 Year |
5 Years |
10 Years | |||||||||||||||||||
|
World ex U.S. Value Portfolio |
|
|
|
|
|
| |||||||||||||||
|
| |||||||||||||||||||||
|
Return Before Taxes |
- |
% |
|
|
|
% |
|
|
|
% |
| ||||||||||
|
| |||||||||||||||||||||
|
Return After Taxes on Distributions |
- |
% |
|
|
- |
% |
|
|
|
% |
| ||||||||||
|
| |||||||||||||||||||||
|
Return After Taxes on Distributions and Sale of Portfolio Shares |
- |
% |
|
|
|
% |
|
|
|
% |
| ||||||||||
|
| |||||||||||||||||||||
|
MSCI All Country
World ex USA Value Index (net dividends) |
|
- |
% |
|
|
- |
% |
|
|
|
% |
| |||||||||
| |||||||||||||||||||||
Investment Advisor/Portfolio Management
Dimensional Fund Advisors LP serves as the investment advisor for the World ex U.S. Value Portfolio and the Underlying Funds. Dimensional Fund Advisors Ltd. and DFA Australia Limited serve as the sub-advisors for the Portfolio and the Underlying Funds. The following individuals are responsible for leading the day-to-day management of the Portfolio:
|
• |
Jed S. Fogdall, Global Head of Portfolio Management, Chairman of the Investment Committee, Vice President and Senior Portfolio Manager of the Advisor, has been a portfolio manager of the Portfolio since inception (2010). | ||
|
• |
Allen Pu, Deputy Head of Portfolio Management, North America, member of the Investment Committee, Vice President and Senior Portfolio Manager of the Advisor, has been a portfolio manager of the Portfolio since 2017. | ||
|
• |
Ashish P. Bhagwanjee, Vice President and Senior Portfolio Manager of the Advisor, has been a portfolio manager of the Portfolio since 2022. |
Purchase and Redemption of Fund Shares
Investors may purchase or redeem shares of the World ex U.S. Value Portfolio on each day that the NYSE is scheduled to be open for business by first contacting the Portfolio’s transfer agent at (888) 576-1167. Shareholders that invest in the Portfolio through a financial intermediary should contact their financial intermediary regarding purchase and redemption procedures. The Portfolio generally is available for investment only by institutional clients, clients of registered investment advisors, clients of financial institutions and a limited number of certain other investors as approved from time to time by the Advisor. All investments are subject to approval of the Advisor.
Tax Information
The dividends and distributions you receive from the World ex U.S. Value Portfolio are taxable and generally will be taxed as ordinary income, capital gains, or some combination of both, unless you are investing through a tax-advantaged arrangement, such as a 401(k) plan or an individual retirement account, in which case distributions may be taxed as ordinary income when withdrawn from the plan or account.
87
Payments to Financial Intermediaries
If you purchase the World ex U.S. Value Portfolio through a broker-dealer or other financial intermediary (such as a bank), the Portfolio and its related companies may pay the intermediary for the sale of the Portfolio shares and/or related services. These payments may create a conflict of interest by influencing the financial intermediary to recommend the Portfolio over another investment. Ask your financial advisor or visit your financial intermediary’s website for more information.
88
The investment objective of the World ex U.S. Core Equity Portfolio (the “Portfolio”) is to achieve long-term capital appreciation.
This table describes the fees and expenses you may pay if you buy, hold or sell shares of the World ex U.S. Core Equity Portfolio. You may pay other fees, such as brokerage commissions and other fees to financial intermediaries, which are not reflected in the table and Example below.
year as a percentage of the value of
your investment)
|
|
|
|
|
Management Fee |
| |
|
| ||
|
Other Expenses |
| |
|
| ||
|
Total Annual Fund Operating Expenses |
| |
|
| ||
This Example is meant to help you compare the cost of investing in the World ex U.S. Core Equity Portfolio with the cost of investing in other mutual funds. The Example assumes that you invest $10,000 in the Portfolio for the time periods indicated. The Example also assumes that your investment has a 5% return each year and that the Portfolio’s operating expenses remain the same. Although your actual costs may be higher or lower, based on these assumptions, your costs would be:
|
|
|
|
|
|
|
|
|
1 Year |
3 Years |
5 Years |
10 Years | |||
|
$ |
$ |
$ |
$ | |||
|
| ||||||
The World ex U.S. Core Equity
Portfolio pays transaction costs, such as commissions, when it buys and sells
securities (or “turns over” its portfolio). A higher portfolio turnover may
indicate higher transaction costs and may result in higher taxes when mutual
fund shares are held in a taxable account. These costs, which are not reflected
in Annual Fund Operating Expenses or in the Example, affect the Portfolio’s
performance. During the most recent fiscal year, the Portfolio’s portfolio
turnover rate was
To achieve the World ex U.S. Core Equity Portfolio’s investment objective, Dimensional Fund Advisors LP (the “Advisor”) implements an integrated investment approach that combines research, portfolio design, portfolio management, and trading functions. As further described below, the Portfolio’s design emphasizes long-term drivers of expected returns identified by the Advisor’s research, while balancing risk through broad diversification across companies and sectors. The Advisor’s portfolio management and trading processes further balance those long-term drivers of expected returns with shorter-term drivers of expected returns and trading costs.
89
The World ex U.S. Core Equity Portfolio is designed to provide exposure to a broad and diverse group of securities of non-U.S. companies in countries with developed and emerging markets. The Portfolio invests in companies of all sizes, with increased exposure to smaller capitalization, lower relative price, and higher profitability companies as compared to their representation in the non-U.S. Universe. For purposes of the Portfolio, the Advisor defines the non-U.S. Universe as a market capitalization weighted set (e.g., the larger the company, the greater the proportion of the non-U.S. Universe it represents) of non-U.S. companies in developed and emerging markets that have been authorized for investment as approved markets by the Advisor’s Investment Committee. The Portfolio’s increased exposure to smaller capitalization, lower relative price, and higher profitability companies may be achieved by decreasing the allocation of the Portfolio’s assets to larger capitalization, higher relative price, or lower profitability companies relative to their weight in the non-U.S. Universe. An equity issuer is considered to have a high relative price (i.e., a growth stock) primarily because it has a high price in relation to its book value. An equity issuer is considered to have a low relative price (i.e., a value stock) primarily because it has a low price in relation to its book value. In assessing relative price, the Advisor may consider additional factors such as price to cash flow or price to earnings ratios. An equity issuer is considered to have high profitability because it has high earnings or profits from operations in relation to its book value or assets. The criteria the Advisor uses for assessing relative price and profitability are subject to change from time to time. The Advisor determines company size on a country or region specific basis and based primarily on market capitalization. As a non-fundamental policy, under normal circumstances, the Portfolio will invest at least 80% of its net assets in non-U.S. equity securities and/or investments that provide exposure to non-U.S. securities.
The Advisor may also increase or reduce the World ex U.S. Core Equity Portfolio’s exposure to an eligible company, or exclude a company, based on shorter-term considerations, such as a company’s price momentum and investment characteristics. In assessing a company’s investment characteristics, the Advisor considers ratios such as recent changes in assets divided by total assets. The criteria the Advisor uses for assessing a company’s investment characteristics are subject to change from time to time. In addition, the Advisor seeks to reduce trading costs using a flexible trading approach that looks for opportunities to participate in the available market liquidity, while managing turnover and explicit transaction costs.
The World ex U.S. Core Equity Portfolio may gain exposure to companies associated with approved markets by purchasing equity securities in the form of depositary receipts, which may be listed or traded outside the issuer’s domicile country. The Portfolio may also invest in China A-shares (equity securities of companies listed in China) and variable interest entities (special structures that utilize contractual arrangements to provide exposure to certain Chinese companies). The Portfolio may purchase or sell futures contracts and options on futures contracts for foreign or U.S. equity securities and indices to increase or decrease equity market exposure based on actual or expected cash inflows to or outflows from the Portfolio. Because many of the Portfolio’s investments may be denominated in foreign currencies, the Portfolio may enter into foreign currency exchange transactions, including foreign currency forward contracts, in connection with the settlement of foreign securities or to transfer cash balances from one currency to another currency.
The World ex U.S. Core Equity Portfolio may lend its portfolio securities to generate additional income.
Equity Market Risk: Even a long-term investment approach cannot guarantee a profit. Economic, market, political, and issuer-specific conditions and events will cause the value of equity securities, and the Portfolio that owns them, to rise or fall. Stock markets tend to move in cycles, with periods of rising prices and periods of falling prices.
90
Profitability Investment Risk: High relative profitability stocks may perform differently from the market as a whole and an investment strategy purchasing these securities may cause the Portfolio to at times underperform equity funds that use other investment strategies.
Value Investment Risk: Value stocks may perform differently from the market as a whole and an investment strategy purchasing these securities may cause the Portfolio to at times underperform equity funds that use other investment strategies. Value stocks can react differently to political, economic, and industry developments than the market as a whole and other types of stocks. Value stocks also may underperform the market for long periods of time.
Small and Mid-Cap Company Risk: Securities of small and mid-cap companies are often less liquid than those of large companies and this could make it difficult to sell a small or mid-cap company security at a desired time or price. As a result, small and mid-cap company stocks may fluctuate relatively more in price. In general, small and mid- capitalization companies are also more vulnerable than larger companies to adverse business or economic developments and they may have more limited resources.
Foreign Securities and Currencies Risk: Foreign securities prices may decline or fluctuate because of: (a) economic or political actions of foreign governments, and/or (b) less regulated or liquid securities markets. Investors holding these securities may also be exposed to foreign currency risk (the possibility that foreign currency will fluctuate in value against the U.S. dollar or that a foreign government will convert, or be forced to convert, its currency to another currency, changing its value against the U.S. dollar). The Portfolio does not hedge foreign currency risk.
Depositary receipts are generally subject to the same risks as the foreign securities that they evidence or into which they may be converted. In addition, the underlying issuers of certain depositary receipts, particularly unsponsored or unregistered depositary receipts, are under no obligation to distribute shareholder communications to the holders of such receipts, or to pass through to them any voting rights with respect to the deposited securities. Depositary receipts that are not sponsored by the issuer may be less liquid and there may be less readily available public information about the issuer.
Emerging Markets Risk: Numerous emerging market countries have a history of, and continue to experience serious, and potentially continuing, economic and political problems. Stock markets in many emerging market countries are relatively small, expensive to trade in and generally have higher risks than those in developed markets. Securities in emerging markets also may be less liquid than those in developed markets and foreigners are often limited in their ability to invest in, and withdraw assets from, these markets. Additional restrictions may be imposed under other conditions. Frontier market countries generally have smaller economies or less developed capital markets and, as a result, the risks of investing in emerging market countries are magnified in frontier market countries.
China Investments Risk: There are special risks associated with investments in China and Taiwan, which are considered emerging market countries by the Portfolio. The Chinese government has implemented significant economic reforms in order to liberalize trade policy, promote foreign investment in the economy, reduce government control of the economy and develop market mechanisms. But there can be no assurance that these reforms will continue or that they will be effective. Despite reforms and privatizations of companies in certain sectors, the Chinese government still exercises substantial influence over many aspects of the private sector and may own or control many companies. The Chinese government continues to maintain a major role in economic policy making and investing in China involves risks of losses due to expropriation, nationalization, confiscation of assets and property, and the imposition of restrictions on foreign investments and on repatriation of capital invested.
A reduction in spending on Chinese products and services or the institution of additional tariffs or other trade barriers, including as a result of heightened trade tensions between China and the United States may also have an adverse impact on the Chinese economy. In addition, investments in Taiwan could be adversely affected by its political and economic relationship with China. Certain securities issued by companies located or operating in China, such as China A-shares, are also subject to trading restrictions, quota limitations and less market liquidity, which could pose risks to the Portfolio. The Series may also invest in special structures that utilize contractual arrangements to provide exposure to certain Chinese companies, known as variable interest entities (“VIEs”), that
91
operate in sectors in which China restricts and/or prohibits foreign investments. The Chinese government’s acceptance of the VIE structure is evolving. It is uncertain whether Chinese officials and regulators will withdraw their acceptance of the structure or whether Chinese courts or arbitration bodies would decline to enforce the contractual rights of foreign investors, each of which would likely have significant, detrimental, and possibly permanent losses on the value of such investments.
Derivatives Risk: Derivatives are instruments, such as futures, and options thereon, and foreign currency forward contracts, whose value is derived from that of other assets, rates or indices. The use of derivatives for non-hedging purposes may be considered to carry more risk than other types of investments. When the Portfolio uses derivatives, the Portfolio will be directly exposed to the risks of those derivatives. Derivative instruments are subject to a number of risks including counterparty, settlement, liquidity, interest rate, market, credit and management risks, as well as the risk of improper valuation. Changes in the value of a derivative may not correlate perfectly with the underlying asset, rate or index, and the Portfolio could lose more than the principal amount invested.
Securities Lending Risk: Securities lending involves the risk that the borrower may fail to return the securities in a timely manner or at all. As a result, the Portfolio may lose money and there may be a delay in recovering the loaned securities. The Portfolio could also lose money if it does not recover the securities and/or the value of the collateral falls, including the value of investments made with cash collateral. Securities lending also may have certain adverse tax consequences.
Operational Risk: Operational risks include human error, changes in personnel, system changes, faults in communication, and failures in systems, technology, or processes. Various operational events or circumstances are outside the Advisor’s control, including instances at third parties. The Portfolio and the Advisor seek to reduce these operational risks through controls and procedures. However, these measures do not address every possible risk and may be inadequate to address these risks.
Cyber Security Risk: The Portfolio’s and its service providers’ use of internet, technology and information systems may expose the Portfolio to potential risks linked to cyber security breaches of those technological or information systems. Cyber security breaches, amongst other things, could allow an unauthorized party to gain access to proprietary information, customer data, or fund assets, or cause the Portfolio and/or its service providers to suffer data corruption or lose operational functionality.
92
January 2014-December 2022
|
|
|
|
|
|
|
Periods ending December 31, 2022
|
|
|
|
|
|
| ||||||||||||||||
|
1 Year |
5 Years |
Since
| |||||||||||||||||||
|
World ex U.S. Core Equity Portfolio |
|
|
|
|
|
| |||||||||||||||
|
| |||||||||||||||||||||
|
Return Before Taxes |
- |
% |
|
|
|
% |
|
|
|
% |
| ||||||||||
|
| |||||||||||||||||||||
|
Return After Taxes on Distributions |
- |
% |
|
|
|
% |
|
|
|
% |
| ||||||||||
|
| |||||||||||||||||||||
|
Return After Taxes on Distributions and Sale of Portfolio Shares |
- |
% |
|
|
|
% |
|
|
|
% |
| ||||||||||
|
| |||||||||||||||||||||
|
MSCI All
Country World ex USA Index (net dividends) |
- |
% |
|
|
|
% |
|
|
|
% |
| ||||||||||
| |||||||||||||||||||||
Investment Advisor/Portfolio Management
Dimensional Fund Advisors LP serves as the investment advisor for the World ex U.S. Core Equity Portfolio. Dimensional Fund Advisors Ltd. and DFA Australia Limited serve as the sub-advisors for the Portfolio. The following individuals are responsible for leading the day-to-day management of the Portfolio:
|
• |
Jed S. Fogdall, Global Head of Portfolio Management, Chairman of the Investment Committee, Vice President and Senior Portfolio Manager of the Advisor, has been a portfolio manager of the Portfolio since inception (2013). | |||||||||||||||||||||||||||||||||||||||||||||||||||||||||||||||||||||||||||||||||||||||||||||||||
|
• |
Allen Pu, Deputy Head of Portfolio Management, North America, member of the Investment Committee, Vice President and Senior Portfolio Manager of the Advisor, has been a portfolio manager of the Portfolio since 2015. | |||||||||||||||||||||||||||||||||||||||||||||||||||||||||||||||||||||||||||||||||||||||||||||||||
|
• |
Mary T. Phillips, Deputy Head of Portfolio Management, North America, member of the Investment Committee, Vice President and Senior Portfolio Manager of the Advisor, has been a portfolio manager of the Portfolio since 2017. | |||||||||||||||||||||||||||||||||||||||||||||||||||||||||||||||||||||||||||||||||||||||||||||||||
93
|
• |
William B. Collins-Dean, Vice President and Senior Portfolio Manager of the Advisor, has been a portfolio manager of the Portfolio since 2019. |
Purchase and Redemption of Fund Shares
Investors may purchase or redeem shares of the World ex U.S. Core Equity Portfolio on each day that the NYSE is scheduled to be open for business by first contacting the Portfolio’s transfer agent at (888) 576-1167. Shareholders that invest in the Portfolio through a financial intermediary should contact their financial intermediary regarding purchase and redemption procedures. The Portfolio generally is available for investment only by institutional clients, clients of registered investment advisors, clients of financial institutions and a limited number of certain other investors as approved from time to time by the Advisor. All investments are subject to approval of the Advisor.
Tax Information
The dividends and distributions you receive from the World ex U.S. Core Equity Portfolio are taxable and generally will be taxed as ordinary income, capital gains, or some combination of both, unless you are investing through a tax-advantaged arrangement, such as a 401(k) plan or an individual retirement account, in which case distributions may be taxed as ordinary income when withdrawn from the plan or account.
Payments to Financial Intermediaries
If you purchase the World ex U.S. Core Equity Portfolio through a broker-dealer or other financial intermediary (such as a bank), the Portfolio and its related companies may pay the intermediary for the sale of the Portfolio shares and/or related services. These payments may create a conflict of interest by influencing the financial intermediary to recommend the Portfolio over another investment. Ask your financial advisor or visit your financial intermediary’s website for more information.
94
The investment objective of the World Core Equity Portfolio (the “Portfolio”) is to achieve long-term capital appreciation.
This table describes the fees and expenses you may pay if you buy, hold or sell shares of the World Core Equity Portfolio. You may pay other fees, such as brokerage commissions and other fees to financial intermediaries, which are not reflected in the table and Example below.
year as a percentage of the value of
your investment)
|
|
|
|
|
Management Fee |
| |
|
| ||
|
Other Expenses |
| |
|
| ||
|
Acquired Fund Fees and Expenses* |
| |
|
| ||
|
Total Annual Fund Operating Expenses* |
| |
|
| ||
|
Fee Waiver and/or Expense Reimbursement** |
| |
|
| ||
|
Total Annual Fund Operating Expenses After Fee Waiver and/or Expense Reimbursement |
| |
|
| ||
|
|
||||||||||||||||||||||||||||||||||||||||||||||||||||||||||||||||||||||||||||||||||||||||||||||||||
|
** |
| |||||||||||||||||||||||||||||||||||||||||||||||||||||||||||||||||||||||||||||||||||||||||||||||||
This Example is meant to help you compare the cost of investing in the World Core Equity Portfolio with the cost of investing in other mutual funds. The Example assumes that you invest $10,000 in the Portfolio for the time periods indicated. The Example also assumes that your investment has a 5% return each year and that the Portfolio’s operating expenses remain the same. The costs for the Portfolio reflect the net expenses of the Portfolio that result from the contractual expense waiver in the first year only. Although your actual costs may be higher or lower, based on these assumptions, your costs would be:
|
|
|
|
|
|
|
|
|
1 Year |
3 Years |
5 Years |
10 Years | |||
|
$ |
$ |
$ |
$ | |||
|
| ||||||
A mutual fund generally pays transaction costs, such as commissions, when it buys and sells securities (or “turns over” its portfolio). A higher portfolio turnover may indicate higher transaction costs and may result in higher taxes when mutual fund shares are held in a taxable account. The World Core Equity Portfolio does not pay transaction costs when buying and selling shares of other mutual funds (the “Underlying Funds”); however, the
95
Underlying Funds pay
transaction costs when buying and selling securities for their portfolios. The
transaction costs incurred by the Underlying Funds, which are not reflected in
Annual Fund Operating Expenses or in the Example, affect the Portfolio’s
performance. During the most recent fiscal year, the Portfolio’s portfolio
turnover rate was
The World Core Equity Portfolio is a “fund of funds,” which means that the Portfolio generally allocates its assets among other mutual funds managed by the Advisor although it also has the ability to invest directly in securities. To achieve the Portfolio’s and the Underlying Funds’ investment objectives, the Advisor implements an integrated investment approach that combines research, portfolio design, portfolio management, and trading functions. As further described below, the Portfolio’s and the Underlying Funds’ designs emphasize long-term drivers of expected returns identified by the Advisor’s research, while balancing risk through broad diversification across companies and sectors. The Advisor’s portfolio management and trading processes further balance those long-term drivers of expected returns with shorter-term drivers of expected returns and trading costs.
The World Core Equity Portfolio is designed to provide exposure to a broad portfolio of securities of both U.S. companies and non-U.S. companies associated with countries with developed and emerging markets, which may include frontier markets (emerging markets in an earlier stage of development), by primarily purchasing shares of U.S. Core Equity 1 Portfolio, International Core Equity Portfolio and Emerging Markets Core Equity Portfolio (the “Underlying Funds”). Certain Underlying Funds may emphasize securities of smaller, lower relative price, and higher profitability companies. The Portfolio may have exposure to companies in all the market capitalization ranges.
The World Core Equity Portfolio typically allocates its investments among the Underlying Funds in the following manner: 35% to 80% in the U.S. Core Equity 1 Portfolio; 15% to 55% in the International Core Equity Portfolio; and 5% to 20% in the Emerging Markets Core Equity Portfolio. Allocations by the Portfolio among the Underlying Funds within the ranges described above are determined by the relative value of the eligible universe of companies of the Underlying Funds. Periodically, the Advisor will review the allocations for the Portfolio in each Underlying Fund and may adjust allocations to the Underlying Funds or may add or remove Underlying Funds in the Portfolio without notice to shareholders.
As a non-fundamental policy, under normal circumstances, at least 80% of the World Core Equity Portfolio’s net assets will be invested directly, or indirectly through its investment in the Underlying Funds, in equity securities.
The Advisor may also increase or reduce the World Core Equity Portfolio’s and/or Underlying Funds’ exposure to an eligible company, or exclude a company, based on shorter-term considerations, such as a company’s price momentum and investment characteristics. In assessing a company’s investment characteristics, the Advisor considers ratios such as recent changes in assets divided by total assets. The criteria the Advisor uses for assessing a company’s investment characteristics are subject to change from time to time. In addition, the Advisor seeks to reduce trading costs using a flexible trading approach that looks for opportunities to participate in the available market liquidity, while managing turnover and explicit transaction costs.
The World Core Equity Portfolio and each Underlying Fund may purchase or sell futures contracts and options on futures contracts for equity securities and indices to increase or decrease equity market exposure based on actual or expected cash inflows to or outflows from the Portfolio or Underlying Fund. Because many of the Portfolio’s and certain Underlying Funds’ investments may be denominated in foreign currencies, the Portfolio and certain Underlying Funds may enter into foreign currency exchange transactions, including foreign currency forward contracts, in connection with the settlement of foreign securities or to transfer cash balances from one currency to another currency. The Portfolio and each Underlying Fund may invest in exchange-traded funds (ETFs) for the purposes of gaining exposure to the equity markets, while maintaining liquidity. In addition to money market instruments and other short-term investments, the Portfolio and each Underlying Fund may invest in affiliated and unaffiliated registered and unregistered money market funds. The Portfolio and Underlying Funds may invest in such money market funds and other short-term investments to manage cash pending investment in other
96
securities or to maintain liquidity for the payment of redemptions or other purposes. Investments in ETFs and money market funds may involve a duplication of certain fees and expenses.
The World Core Equity Portfolio and Underlying Funds may lend their portfolio securities to generate additional income.
A summary of the investment strategies and policies of the Underlying Funds in which the World Core Equity Portfolio invests as of the date of this Prospectus (other than the Underlying Funds that are included elsewhere in the Portfolio’s Prospectus) is described in the Portfolio’s Prospectus in the section entitled “ADDITIONAL INFORMATION ON INVESTMENT OBJECTIVES AND POLICIES”.
Fund of Funds Risk: The investment performance of the Portfolio is affected by the investment performance of the Underlying Funds in which the Portfolio invests. The ability of the Portfolio to achieve its investment objective depends on the ability of the Underlying Funds to meet their investment objectives and on the Advisor’s decisions regarding the allocation of the Portfolio’s assets among the Underlying Funds. The Portfolio may allocate assets to an Underlying Fund or asset class that underperforms other funds or asset classes. There can be no assurance that the investment objective of the Portfolio or any Underlying Fund will be achieved. When the Portfolio invests in Underlying Funds, investors are exposed to a proportionate share of the expenses of those Underlying Funds in addition to the expenses of the Portfolio. Through its investments in the Underlying Funds, the Portfolio is subject to the risks of the Underlying Funds’ investments. The risks of the Portfolio’s and Underlying Funds’ investments are described below.
Equity Market Risk: Even a long-term investment approach cannot guarantee a profit. Economic, market, political, and issuer-specific conditions and events will cause the value of equity securities, and the Portfolio or Underlying Fund that owns them, to rise or fall. Stock markets tend to move in cycles, with periods of rising prices and periods of falling prices.
Foreign Securities and Currencies Risk: Foreign securities prices may decline or fluctuate because of: (a) economic or political actions of foreign governments, and/or (b) less regulated or liquid securities markets. Investors holding these securities may also be exposed to foreign currency risk (the possibility that foreign currency will fluctuate in value against the U.S. dollar or that a foreign government will convert, or be forced to convert, its currency to another currency, changing its value against the U.S. dollar). The Underlying Funds do not hedge foreign currency risk.
Depositary receipts are generally subject to the same risks as the foreign securities that they evidence or into which they may be converted. In addition, the underlying issuers of certain depositary receipts, particularly unsponsored or unregistered depositary receipts, are under no obligation to distribute shareholder communications to the holders of such receipts, or to pass through to them any voting rights with respect to the deposited securities. Depositary receipts that are not sponsored by the issuer may be less liquid and there may be less readily available public information about the issuer.
Small and Mid-Cap Company Risk: Securities of small and mid-cap companies are often less liquid than those of large companies and this could make it difficult to sell a small or mid-cap company security at a desired time or price. As a result, small and mid-cap company stocks may fluctuate relatively more in price. In general, small and mid-capitalization companies are also more vulnerable than larger companies to adverse business or economic developments and they may have more limited resources.
97
Profitability Investment Risk: High relative profitability stocks may perform differently from the market as a whole and an investment strategy purchasing these securities may cause the Portfolio or an Underlying Fund to at times underperform equity funds that use other investment strategies.
Value Investment Risk: Value stocks may perform differently from the market as a whole and an investment strategy purchasing these securities may cause the Portfolio or an Underlying Fund to at times underperform equity funds that use other investment strategies. Value stocks can react differently to political, economic, and industry developments than the market as a whole and other types of stocks. Value stocks also may underperform the market for long periods of time.
Emerging Markets Risk: Numerous emerging market countries have a history of, and continue to experience serious, and potentially continuing, economic and political problems. Stock markets in many emerging market countries are relatively small, expensive to trade in and generally have higher risks than those in developed markets. Securities in emerging markets also may be less liquid than those in developed markets and foreigners are often limited in their ability to invest in, and withdraw assets from, these markets. Additional restrictions may be imposed under other conditions. Frontier market countries generally have smaller economies or less developed capital markets and, as a result, the risks of investing in emerging market countries are magnified in frontier market countries.
Derivatives Risk: Derivatives are instruments, such as futures, and options thereon, and foreign currency forward contracts, whose value is derived from that of other assets, rates or indices. The use of derivatives for non-hedging purposes may be considered to carry more risk than other types of investments. When the Portfolio or an Underlying Fund uses derivatives, the Portfolio or Underlying Fund will be directly exposed to the risks of those derivatives. Derivative instruments are subject to a number of risks including counterparty, settlement, liquidity, interest rate, market, credit and management risks, as well as the risk of improper valuation. Changes in the value of a derivative may not correlate perfectly with the underlying asset, rate or index, and the Portfolio or Underlying Fund could lose more than the principal amount invested.
Securities Lending Risk: Securities lending involves the risk that the borrower may fail to return the securities in a timely manner or at all. As a result, an Underlying Fund may lose money and there may be a delay in recovering the loaned securities. An Underlying Fund could also lose money if it does not recover the securities and/or the value of the collateral falls, including the value of investments made with cash collateral. Securities lending also may have certain adverse tax consequences. To the extent that the Portfolio holds securities directly and lends those securities, it will be also subject to the foregoing risks with respect to its loaned securities.
Operational Risk: Operational risks include human error, changes in personnel, system changes, faults in communication, and failures in systems, technology, or processes. Various operational events or circumstances are outside the Advisor’s control, including instances at third parties. The Portfolio and the Advisor seek to reduce these operational risks through controls and procedures. However, these measures do not address every possible risk and may be inadequate to address these risks.
Cyber Security Risk: The Portfolio’s and its service providers’ use of internet, technology and information systems may expose the Portfolio to potential risks linked to cyber security breaches of those technological or information systems. Cyber security breaches, amongst other things, could allow an unauthorized party to gain access to proprietary information, customer data, or fund assets, or cause the Portfolio and/or its service providers to suffer data corruption or lose operational functionality.
98
January 2013-December 2022
|
|
|
|
|
|
|
Periods ending December 31, 2022
|
|
|
|
|
|
| ||||||||||||||||
|
1 Year |
5 Years |
10 Years | |||||||||||||||||||
|
World Core Equity Portfolio |
|
|
|
|
|
| |||||||||||||||
|
| |||||||||||||||||||||
|
Return Before Taxes |
- |
% |
|
|
|
% |
|
|
|
% |
| ||||||||||
|
| |||||||||||||||||||||
|
Return After Taxes on Distributions |
- |
% |
|
|
|
% |
|
|
|
% |
| ||||||||||
|
| |||||||||||||||||||||
|
Return After Taxes on Distributions and Sale of Portfolio Shares |
- |
% |
|
|
|
% |
|
|
|
% |
| ||||||||||
|
| |||||||||||||||||||||
|
MSCI All
Country World Index (net dividends) |
- |
% |
|
|
|
% |
|
|
|
% |
| ||||||||||
| |||||||||||||||||||||
Investment Advisor/Portfolio Management
Dimensional Fund Advisors LP serves as the investment advisor for the World Core Equity Portfolio and the Underlying Funds. Dimensional Fund Advisors Ltd. and DFA Australia Limited serve as the sub-advisors for the Portfolio and certain of the Underlying Funds. The following individuals are responsible for leading the day-to-day management of the Portfolio:
|
• |
Jed S. Fogdall, Global Head of Portfolio Management, Chairman of the Investment Committee, Vice President and Senior Portfolio Manager of the Advisor, has been a portfolio manager of the Portfolio since inception (2012). |
99
|
• |
Allen Pu, Deputy Head of Portfolio Management, North America, member of the Investment Committee, Vice President and Senior Portfolio Manager of the Advisor, has been a portfolio manager of the Portfolio since 2015. | ||
|
• |
Mary T. Phillips, Deputy Head of Portfolio Management, North America, member of the Investment Committee, Vice President and Senior Portfolio Manager of the Advisor, has been a portfolio manager of the Portfolio since 2017. | ||
|
• |
Ashish P. Bhagwanjee, Vice President and Senior Portfolio Manager of the Advisor, has been a portfolio manager of the Portfolio since 2020. |
Purchase and Redemption of Fund Shares
Investors may purchase or redeem shares of the World Core Equity Portfolio on each day that the NYSE is scheduled to be open for business by first contacting the Portfolio’s transfer agent at (888) 576-1167. Shareholders that invest in the Portfolio through a financial intermediary should contact their financial intermediary regarding purchase and redemption procedures. The Portfolio generally is available for investment only by institutional clients, clients of registered investment advisors, clients of financial institutions and a limited number of certain other investors as approved from time to time by the Advisor. All investments are subject to approval of the Advisor.
Tax Information
The dividends and distributions you receive from the World Core Equity Portfolio are taxable and generally will be taxed as ordinary income, capital gains, or some combination of both, unless you are investing through a tax-advantaged arrangement, such as a 401(k) plan or an individual retirement account, in which case distributions may be taxed as ordinary income when withdrawn from the plan or account.
Payments to Financial Intermediaries
If you purchase the World Core Equity Portfolio through a broker-dealer or other financial intermediary (such as a bank), the Portfolio and its related companies may pay the intermediary for the sale of the Portfolio shares and/or related services. These payments may create a conflict of interest by influencing the financial intermediary to recommend the Portfolio over another investment. Ask your financial advisor or visit your financial intermediary’s website for more information.
100
The investment objective of the Selectively Hedged Global Equity Portfolio (the “Portfolio”) is to achieve long-term capital appreciation.
This table describes the fees and expenses you may pay if you buy, hold or sell shares of the Selectively Hedged Global Equity Portfolio. You may pay other fees, such as brokerage commissions and other fees to financial intermediaries, which are not reflected in the table and Example below.
year as a percentage of the value of
your investment)
|
|
|
|
|
Management Fee |
| |
|
| ||
|
Other Expenses |
| |
|
| ||
|
Acquired Fund Fees and Expenses |
| |
|
| ||
|
Total Annual Fund Operating Expenses |
| |
|
| ||
|
Fee Waiver and/or Expense Reimbursement* |
| |
|
| ||
|
Total Annual Fund Operating Expenses After Fee Waiver and/or Expense Reimbursement |
| |
|
| ||
|
* |
| |||||||||||||||||||||||||||||||||||||||||||||||||||||||||||||||||||||||||||||||||||||||||||||||||
This Example is meant to help you compare the cost of investing in the Selectively Hedged Global Equity Portfolio with the cost of investing in other mutual funds. The Example assumes that you invest $10,000 in the Portfolio for the time periods indicated. The Example also assumes that your investment has a 5% return each year and that the Portfolio’s operating expenses remain the same. The costs for the Portfolio reflect the net expenses of the Portfolio that result from the contractual expense waiver in the first year only. Although your actual costs may be higher or lower, based on these assumptions, your costs would be:
|
|
|
|
|
|
|
|
|
1 Year |
3 Years |
5 Years |
10 Years | |||
|
$ |
$ |
$ |
$ | |||
|
| ||||||
A mutual fund generally pays transaction costs, such as commissions, when it buys and sells securities (or “turns over” its portfolio). A higher portfolio turnover may indicate higher transaction costs and may result in higher taxes when mutual fund shares are held in a taxable account. The Selectively Hedged Global Equity Portfolio does not pay transaction costs when buying and selling shares of other mutual funds (the “Underlying Funds”); however, the Underlying Funds pay transaction costs when buying and selling securities for their portfolios. The transaction costs incurred by the Underlying Funds, which are not reflected in Annual Fund Operating Expenses
101
or in the Example, affect the
Portfolio’s performance. During the most recent fiscal year, the Portfolio’s
portfolio turnover rate was
The Selectively Hedged Global Equity Portfolio is a “fund of funds,” which means that the Portfolio generally allocates its assets among other mutual funds managed by the Advisor although it also has the ability to invest directly in securities and derivatives. To achieve the Portfolio’s and the Underlying Funds’ investment objectives, the Advisor implements an integrated investment approach that combines research, portfolio design, portfolio management, and trading functions. As further described below, the Portfolio’s and the Underlying Funds’ designs emphasize long-term drivers of expected returns identified by the Advisor’s research, while balancing risk through broad diversification across companies and sectors. The Advisor’s portfolio management and trading processes further balance those long-term drivers of expected returns with shorter-term drivers of expected returns and trading costs.
The Selectively Hedged Global Equity Portfolio is designed to provide exposure to a broad portfolio of securities of both U.S. companies and non-U.S. companies associated with countries with developed and emerging markets, including frontier markets (emerging markets in an earlier stage of development), by primarily purchasing shares of the U.S. Core Equity 2 Portfolio, International Core Equity Portfolio and Emerging Markets Core Equity Portfolio (the “Underlying Funds”). The Underlying Funds may have increased exposure to smaller capitalization, lower relative price and/or higher profitability companies as compared to their representation in the countries and/or regions in which they are authorized to invest. Periodically, the Advisor will review the allocations for the Portfolio in each Underlying Fund and may adjust allocations to the Underlying Funds or may add or remove Underlying Funds in the Portfolio without notice to shareholders. The Advisor may consider the relative market capitalization weighting of developed and emerging markets within the universe of eligible securities along with other factors, including different valuation ratios and/or profitability, when allocating Portfolio investments among the Underlying Funds or securities. The Portfolio may have exposure to companies in all the market capitalization ranges. An equity issuer is considered to have a low relative price (i.e., a value stock) primarily because it has a low price in relation to its book value. In assessing relative price, the Advisor may consider additional factors such as price to cash flow or price to earnings ratios. An equity issuer is considered to have high profitability because it has high earnings or profits from operations in relation to its book value or assets. The criteria the Advisor uses for assessing relative price and profitability are subject to change from time to time.
As a non-fundamental policy, under normal circumstances, at least 80% of the Selectively Hedged Global Equity Portfolio’s net assets will be invested directly, or indirectly through its investment in the Underlying Funds, in equity securities or investments that provide exposure to equity securities. In addition to, or in place of, investments in the Underlying Funds, the Portfolio is permitted to invest directly in the same types of equity securities of U.S. and non-U.S. companies that are eligible investments for the Underlying Funds. The Portfolio, directly or indirectly through its investment in the Underlying Funds, intends to invest its assets to gain exposure to at least three different countries, including the United States. The Advisor will generally seek to set country weights based on the relative market capitalizations of eligible companies within each approved market of the Underlying Funds. As of the date of the Prospectus, the Portfolio, directly or indirectly through its investment in the Underlying Funds, invests approximately 55% of its net assets in U.S. companies. This percentage will change due to market conditions.
The Advisor may also increase or reduce the Selectively Hedged Global Equity Portfolio’s and/or Underlying Funds’ exposure to an eligible company, or exclude a company, based on shorter-term considerations, such as a company’s price momentum and investment characteristics. In assessing a company’s investment characteristics, the Advisor considers ratios such as recent changes in assets divided by total assets. The criteria the Advisor uses for assessing a company’s investment characteristics are subject to change from time to time. In addition, the Advisor seeks to reduce trading costs using a flexible trading approach that looks for opportunities to participate in the available market liquidity, while managing turnover and explicit transaction costs.
102
The Selectively Hedged Global Equity Portfolio invests directly or indirectly through its investment in the Underlying Funds in securities that may be denominated in foreign currencies. The Portfolio may hedge some or all of the currency exposure of the foreign securities by entering into foreign currency forward contracts, futures or other derivatives. Currencies may be hedged against the U.S. dollar or non-U.S. dollar currencies. The decision to hedge the Portfolio’s currency exposure with respect to a foreign market will be based on, among other things, a comparison of the respective foreign and U.S. short-term interest rates and the Portfolio’s existing exposure to a given foreign currency. The Portfolio and each Underlying Fund also may purchase or sell futures contracts and options on futures contracts to increase or decrease equity market exposure based on actual or expected cash inflows to or outflows from the Portfolio or Underlying Fund. In order to meet payment obligations with respect to such derivative transactions, the Portfolio may hold short-term fixed income obligations.
The Selectively Hedged Global Equity Portfolio and Underlying Funds may lend their portfolio securities to generate additional income.
A summary of the investment strategies and policies of the Underlying Funds in which the Selectively Hedged Global Equity Portfolio invests as of the date of this Prospectus (other than the Underlying Funds that are included elsewhere in the Portfolio’s Prospectus) is described in the Portfolio’s Prospectus in the section entitled “ADDITIONAL INFORMATION ON INVESTMENT OBJECTIVES AND POLICIES”.
Fund of Funds Risk: The investment performance of the Portfolio is affected by the investment performance of the Underlying Funds in which the Portfolio invests. The ability of the Portfolio to achieve its investment objective depends on the ability of the Underlying Funds to meet their investment objectives and on the Advisor’s decisions regarding the allocation of the Portfolio’s assets among the Underlying Funds. The Portfolio may allocate assets to an Underlying Fund or asset class that underperforms other funds or asset classes. There can be no assurance that the investment objective of the Portfolio or any Underlying Fund will be achieved. When the Portfolio invests in Underlying Funds, investors are exposed to a proportionate share of the expenses of those Underlying Funds in addition to the expenses of the Portfolio. Through its investments in the Underlying Funds, the Portfolio is subject to the risks of the Underlying Funds’ investments. The risks of the Portfolio’s and Underlying Funds’ investments are described below.
Equity Market Risk: Even a long-term investment approach cannot guarantee a profit. Economic, market, political, and issuer-specific conditions and events will cause the value of equity securities, and the Portfolio or Underlying Fund that owns them, to rise or fall. Stock markets tend to move in cycles, with periods of rising prices and periods of falling prices.
Foreign Securities and Currencies Risk: Foreign securities prices may decline or fluctuate because of: (a) economic or political actions of foreign governments, and/or (b) less regulated or liquid securities markets. Investors holding these securities may also be exposed to foreign currency risk (the possibility that foreign currency will fluctuate in value against the U.S. dollar or that a foreign government will convert, or be forced to convert, its currency to another currency, changing its value against the U.S. dollar). The Underlying Funds do not hedge foreign currency risk but the Portfolio may directly hedge the foreign currency risk it is exposed to through its investment in the Underlying Funds or its direct investment in foreign securities. The Portfolio also may leave some or all of its foreign currency exposure unhedged. Currencies may be hedged against the U.S. dollar or non-U.S. dollar currencies.
Depositary receipts are generally subject to the same risks as the foreign securities that they evidence or into which they may be converted. In addition, the underlying issuers of certain depositary receipts, particularly
103
unsponsored or unregistered depositary receipts, are under no obligation to distribute shareholder communications to the holders of such receipts, or to pass through to them any voting rights with respect to the deposited securities. Depositary receipts that are not sponsored by the issuer may be less liquid and there may be less readily available public information about the issuer.
Small and Mid-Cap Company Risk: Securities of small and mid-cap companies are often less liquid than those of large companies and this could make it difficult to sell a small or mid-cap company security at a desired time or price. As a result, small and mid-cap company stocks may fluctuate relatively more in price. In general, small and mid-capitalization companies are also more vulnerable than larger companies to adverse business or economic developments and they may have more limited resources.
Profitability Investment Risk: High relative profitability stocks may perform differently from the market as a whole and an investment strategy purchasing these securities may cause the Portfolio or an Underlying Fund to at times underperform equity funds that use other investment strategies.
Value Investment Risk: Value stocks may perform differently from the market as a whole and an investment strategy purchasing these securities may cause the Portfolio or an Underlying Fund to at times underperform equity funds that use other investment strategies. Value stocks can react differently to political, economic, and industry developments than the market as a whole and other types of stocks. Value stocks also may underperform the market for long periods of time.
Emerging Markets Risk: Numerous emerging market countries have a history of, and continue to experience serious, and potentially continuing, economic and political problems. Stock markets in many emerging market countries are relatively small, expensive to trade in and generally have higher risks than those in developed markets. Securities in emerging markets also may be less liquid than those in developed markets and foreigners are often limited in their ability to invest in, and withdraw assets from, these markets. Additional restrictions may be imposed under other conditions. Frontier market countries generally have smaller economies or less developed capital markets and, as a result, the risks of investing in emerging market countries are magnified in frontier market countries.
Derivatives Risk: Derivatives are instruments, such as futures, and options thereon, and foreign currency forward contracts, whose value is derived from that of other assets, rates or indices. Derivatives can be used for hedging (attempting to reduce risk by offsetting one investment position with another) or non-hedging purposes. Hedging with derivatives may increase expenses, and there is no guarantee that a hedging strategy will work. While hedging can reduce or eliminate losses, it can also reduce or eliminate gains or cause losses if the market moves in a manner different from that anticipated by the Portfolio or if the cost of the derivative outweighs the benefit of the hedge. In regard to currency hedging, it is generally not possible to precisely match the foreign currency exposure of such foreign currency forward contracts to the value of the securities involved due to fluctuations in the market values of such securities and cash flows into and out of the Portfolio or Underlying Fund between the date a foreign currency forward contract is entered into and the date it expires. The use of derivatives for non-hedging purposes may be considered to carry more risk than other types of investments. When the Portfolio or an Underlying Fund uses derivatives, the Portfolio or Underlying Fund will be directly exposed to the risks of those derivatives. Derivative instruments are subject to a number of risks including counterparty, settlement, liquidity, interest rate, market, credit and management risks, as well as the risk of improper valuation. Changes in the value of a derivative may not correlate perfectly with the underlying asset, rate or index, and the Portfolio or Underlying Fund could lose more than the principal amount invested.
Securities Lending Risk: Securities lending involves the risk that the borrower may fail to return the securities in a timely manner or at all. As a result, an Underlying Fund may lose money and there may be a delay in recovering the loaned securities. An Underlying Fund could also lose money if it does not recover the securities and/or the value of the collateral falls, including the value of investments made with cash collateral. Securities lending also may have certain adverse tax consequences. To the extent that the Portfolio holds securities directly and lends those securities, it will be also subject to the foregoing risks with respect to its loaned securities.
Operational Risk: Operational risks include human error, changes in personnel, system changes, faults in communication, and failures in systems, technology, or processes. Various operational events or circumstances are outside the Advisor’s control, including instances at third parties. The Portfolio and the Advisor seek to
104
reduce these operational risks through controls and procedures. However, these measures do not address every possible risk and may be inadequate to address these risks.
Cyber Security Risk: The Portfolio’s and its service providers’ use of internet, technology and information systems may expose the Portfolio to potential risks linked to cyber security breaches of those technological or information systems. Cyber security breaches, amongst other things, could allow an unauthorized party to gain access to proprietary information, customer data, or fund assets, or cause the Portfolio and/or its service providers to suffer data corruption or lose operational functionality.
January 2013-December 2022
|
|
|
|
|
|
|
105
Periods ending December 31, 2022
|
|
|
|
|
|
|||||||||||||||||
|
1 Year |
5 Years |
10 Years | |||||||||||||||||||
|
Selectively Hedged Global Equity Portfolio |
|
|
|
|
|
| |||||||||||||||
|
| |||||||||||||||||||||
|
Return Before Taxes |
- |
% |
|
|
|
% |
|
|
|
% |
| ||||||||||
|
| |||||||||||||||||||||
|
Return After Taxes on Distributions |
- |
% |
|
|
|
% |
|
|
|
% |
| ||||||||||
|
| |||||||||||||||||||||
|
Return After Taxes on Distributions and Sale of Portfolio Shares |
- |
% |
|
|
|
% |
|
|
|
% |
| ||||||||||
|
| |||||||||||||||||||||
|
MSCI All
Country World Index (net dividends) |
- |
% |
|
|
|
% |
|
|
|
% |
| ||||||||||
| |||||||||||||||||||||
Investment Advisor/Portfolio Management
Dimensional Fund Advisors LP serves as the investment advisor for the Selectively Hedged Global Equity Portfolio and the Underlying Funds. Dimensional Fund Advisors Ltd. and DFA Australia Limited serve as the sub-advisors for the Portfolio and certain of the Underlying Funds. The following individuals are responsible for leading the day-to-day management of the Portfolio:
|
• |
Jed S. Fogdall, Global Head of Portfolio Management, Chairman of the Investment Committee, Vice President and Senior Portfolio Manager of the Advisor, has been a portfolio manager of the Portfolio since inception (2011). | ||
|
• |
Mary T. Phillips, Deputy Head of Portfolio Management, North America, member of the Investment Committee, Vice President and Senior Portfolio Manager of the Advisor, has been a portfolio manager of the Portfolio since 2017. | ||
|
• |
Allen Pu, Deputy Head of Portfolio Management, North America, member of the Investment Committee, Vice President and Senior Portfolio Manager of the Advisor, has been a portfolio manager of the Portfolio since 2017. | ||
|
• |
Ashish P. Bhagwanjee, Vice President and Senior Portfolio Manager of the Advisor, has been a portfolio manager of the Portfolio since 2022. |
Purchase and Redemption of Fund Shares
Investors may purchase or redeem shares of the Selectively Hedged Global Equity Portfolio on each day that the NYSE is scheduled to be open for business by first contacting the Portfolio’s transfer agent at (888) 576-1167. Shareholders that invest in the Portfolio through a financial intermediary should contact their financial intermediary regarding purchase and redemption procedures. The Portfolio generally is available for investment only by institutional clients, clients of registered investment advisors, clients of financial institutions and a limited number of certain other investors as approved from time to time by the Advisor. All investments are subject to approval of the Advisor.
Tax Information
The dividends and distributions you receive from the Selectively Hedged Global Equity Portfolio are taxable and generally will be taxed as ordinary income, capital gains, or some combination of both, unless you are investing through a tax-advantaged arrangement, such as a 401(k) plan or an individual retirement account, in which case distributions may be taxed as ordinary income when withdrawn from the plan or account.
106
Payments to Financial Intermediaries
If you purchase the Selectively Hedged Global Equity Portfolio through a broker-dealer or other financial intermediary (such as a bank), the Portfolio and its related companies may pay the intermediary for the sale of the Portfolio shares and/or related services. These payments may create a conflict of interest by influencing the financial intermediary to recommend the Portfolio over another investment. Ask your financial advisor or visit your financial intermediary’s website for more information.
107
The investment objective of the Emerging Markets Portfolio (the “Portfolio”) is to achieve long-term capital appreciation. The Emerging Markets Portfolio is a Feeder Portfolio and pursues its objective by investing substantially all of its assets in its corresponding Master Fund, The Emerging Markets Series (the “Emerging Markets Series” or the “Series”) of The DFA Investment Trust Company (the “Trust”), which has the same investment objective and policies as the Portfolio.
This table describes the fees and expenses you may pay if you buy, hold or sell shares of the Emerging Markets Portfolio. You may pay other fees, such as brokerage commissions and other fees to financial intermediaries, which are not reflected in the table and Example below.
year as a percentage of the value of
your investment)
|
|
|
|
|
Management Fee |
| |
|
| ||
|
Other Expenses |
| |
|
| ||
|
Total Annual Fund Operating Expenses |
| |
|
| ||
|
Fee Waiver and/or Expense Reimbursement |
| |
|
| ||
|
Total Annual Fund Operating Expenses After Fee Waiver and/or Expense Reimbursement |
| |
|
| ||
|
* |
| |||||||||||||||||||||||||||||||||||||||||||||||||||||||||||||||||||||||||||||||||||||||||||||||||
This Example is meant to help you compare the cost of investing in the Emerging Markets Portfolio with the cost of investing in other mutual funds. The Example assumes that you invest $10,000 in the Portfolio for the time periods indicated. The Example also assumes that your investment has a 5% return each year and that the Portfolio’s operating expenses remain the same. Although your actual costs may be higher or lower, based on these assumptions your costs would be:
|
|
|
|
|
|
| |
|
1 Year |
3 Years |
5 Years |
10 Years | |||
|
$ |
$ |
$ |
$ | |||
|
| ||||||
The Example reflects the aggregate annual operating expenses of the Emerging Markets Portfolio and the Portfolio’s portion of the expenses of the Emerging Markets Series.
108
The Emerging Markets Series
pays transaction costs, such as commissions, when it buys and sells securities
(or “turns over” its portfolio). A higher portfolio turnover may indicate higher
transaction costs and may result in higher taxes when Portfolio shares are held
in a taxable account. These costs, which are not reflected in Annual Fund
Operating Expenses or in the Example, affect the Emerging Markets Portfolio’s
performance. During the most recent fiscal year, the Series’ portfolio turnover
rate was
The Emerging Markets Portfolio invests substantially all of its assets in the Emerging Markets Series. To achieve the Portfolio’s and the Series’ investment objectives, the Advisor implements an integrated investment approach that combines research, portfolio design, portfolio management, and trading functions. As further described below, the Series’ design emphasizes long-term drivers of expected returns identified by the Advisor’s research, while balancing risk through broad diversification across companies and sectors. The Advisor’s portfolio management and trading processes further balance those long-term drivers of expected returns with shorter-term drivers of expected returns and trading costs.
The Emerging Markets Series is designed to purchase a broad market coverage of larger companies associated with emerging markets, which may include frontier markets (emerging market countries in an earlier stage of development), authorized for investment by the Advisor’s Investment Committee (“Approved Markets”). The Advisor’s definition of large varies across countries and is based primarily on market capitalization. A company’s market capitalization is the number of its shares outstanding times its price per share. In each country authorized for investment, the Advisor first ranks eligible companies listed on selected exchanges based on the companies’ market capitalizations. The Advisor then defines the minimum market capitalization for a large company in that country. For example, based on market capitalization data as of December 31, 2022, Mexico had a size threshold of $4,888 million or above, and Czech Republic had a size threshold of $1,718 million or above. These thresholds will change due to market conditions. In addition, the Advisor may consider a company’s size, relative price, and/or profitability relative to other eligible companies when making investment decisions for the Series. An equity issuer is considered to have a low relative price (i.e., a value stock) primarily because it has a low price in relation to its book value. In assessing relative price, the Advisor may consider additional factors such as price to cash flow or price to earnings ratios. An equity issuer is considered to have high profitability because it has high earnings or profits from operations in relation to its book value or assets. The criteria the Advisor uses for assessing relative price and profitability are subject to change from time to time.
As a non-fundamental policy, under normal circumstances, the Emerging Markets Series will invest at least 80% of its net assets in emerging markets investments that are defined in the Prospectus as Approved Market securities.
The Advisor may also increase or reduce the Emerging Markets Series’ exposure to an eligible company, or exclude a company, based on shorter-term considerations, such as a company’s price momentum. In addition, the Advisor seeks to reduce trading costs using a flexible trading approach that looks for opportunities to participate in the available market liquidity, while managing turnover and explicit transaction costs.
The Emerging Markets Series may gain exposure to companies associated with Approved Markets by purchasing equity securities in the form of depositary receipts, which may be listed or traded outside the issuer’s domicile country. The Series may also invest in China A-shares (equity securities of companies listed in China) and variable interest entities (special structures that utilize contractual arrangements to provide exposure to certain Chinese companies). The Series and the Emerging Markets Portfolio each may purchase or sell futures contracts and options on futures contracts for Approved Market or other equity market securities and indices, including those of the United States, to increase or decrease equity market exposure based on actual or expected cash inflows to or outflows from the Series or Portfolio. Because many of the Series’ and the Portfolio’s investments may be denominated in foreign currencies, the Series and the Portfolio may enter into foreign currency exchange transactions, including foreign currency forward contracts, in connection with the settlement of foreign securities or to transfer cash balances from one currency to another currency.
109
The Emerging Markets Series may lend its portfolio securities to generate additional income.
Equity Market Risk: Even a long-term investment approach cannot guarantee a profit. Economic, market, political, and issuer-specific conditions and events will cause the value of equity securities, and the Portfolio that owns them, to rise or fall. Stock markets tend to move in cycles, with periods of rising prices and periods of falling prices.
Foreign Securities and Currencies Risk: Foreign securities prices may decline or fluctuate because of: (a) economic or political actions of foreign governments, and/or (b) less regulated or liquid securities markets. Investors holding these securities may also be exposed to foreign currency risk (the possibility that foreign currency will fluctuate in value against the U.S. dollar or that a foreign government will convert, or be forced to convert, its currency to another currency, changing its value against the U.S. dollar). The Series does not hedge foreign currency risk.
Depositary receipts are generally subject to the same risks as the foreign securities that they evidence or into which they may be converted. In addition, the underlying issuers of certain depositary receipts, particularly unsponsored or unregistered depositary receipts, are under no obligation to distribute shareholder communications to the holders of such receipts, or to pass through to them any voting rights with respect to the deposited securities. Depositary receipts that are not sponsored by the issuer may be less liquid and there may be less readily available public information about the issuer.
Emerging Markets Risk: Numerous emerging market countries have a history of, and continue to experience serious, and potentially continuing, economic and political problems. Stock markets in many emerging market countries are relatively small, expensive to trade in and generally have higher risks than those in developed markets. Securities in emerging markets also may be less liquid than those in developed markets and foreigners are often limited in their ability to invest in, and withdraw assets from, these markets. Additional restrictions may be imposed under other conditions. Frontier market countries generally have smaller economies or less developed capital markets and, as a result, the risks of investing in emerging market countries are magnified in frontier market countries.
China Investments Risk: There are special risks associated with investments in China and Taiwan, which are considered emerging market countries by the Portfolio. The Chinese government has implemented significant economic reforms in order to liberalize trade policy, promote foreign investment in the economy, reduce government control of the economy and develop market mechanisms. But there can be no assurance that these reforms will continue or that they will be effective. Despite reforms and privatizations of companies in certain sectors, the Chinese government still exercises substantial influence over many aspects of the private sector and may own or control many companies. The Chinese government continues to maintain a major role in economic policy making and investing in China involves risks of losses due to expropriation, nationalization, confiscation of assets and property, and the imposition of restrictions on foreign investments and on repatriation of capital invested.
A reduction in spending on Chinese products and services or the institution of additional tariffs or other trade barriers, including as a result of heightened trade tensions between China and the United States may also have an adverse impact on the Chinese economy. In addition, investments in Taiwan could be adversely affected by its political and economic relationship with China. Certain securities issued by companies located or operating in China, such as China A-shares, are also subject to trading restrictions, quota limitations and less market liquidity, which could pose risks to the Portfolio. The Series may also invest in special structures that utilize contractual arrangements to provide exposure to certain Chinese companies, known as variable interest entities (“VIEs”), that
110
operate in sectors in which China restricts and/or prohibits foreign investments. The Chinese government’s acceptance of the VIE structure is evolving. It is uncertain whether Chinese officials and regulators will withdraw their acceptance of the structure or whether Chinese courts or arbitration bodies would decline to enforce the contractual rights of foreign investors, each of which would likely have significant, detrimental, and possibly permanent losses on the value of such investments.
Profitability Investment Risk: High relative profitability stocks may perform differently from the market as a whole and an investment strategy purchasing these securities may cause the Series to at times underperform equity funds that use other investment strategies.
Value Investment Risk: Value stocks may perform differently from the market as a whole and an investment strategy purchasing these securities may cause the Series to at times underperform equity funds that use other investment strategies. Value stocks can react differently to political, economic, and industry developments than the market as a whole and other types of stocks. Value stocks also may underperform the market for long periods of time.
Derivatives Risk: Derivatives are instruments, such as futures, and options thereon, and foreign currency forward contracts, whose value is derived from that of other assets, rates or indices. The use of derivatives for non-hedging purposes may be considered to carry more risk than other types of investments. When the Series and the Portfolio use derivatives, the Portfolio will be directly exposed to the risks of those derivatives. Derivative instruments are subject to a number of risks including counterparty, settlement, liquidity, interest rate, market, credit and management risks, as well as the risk of improper valuation. Changes in the value of a derivative may not correlate perfectly with the underlying asset, rate or index, and the Portfolio could lose more than the principal amount invested.
Securities Lending Risk: Securities lending involves the risk that the borrower may fail to return the securities in a timely manner or at all. As a result, the Series may lose money and there may be a delay in recovering the loaned securities. The Series could also lose money if it does not recover the securities and/or the value of the collateral falls, including the value of investments made with cash collateral. Securities lending also may have certain adverse tax consequences.
Operational Risk: Operational risks include human error, changes in personnel, system changes, faults in communication, and failures in systems, technology, or processes. Various operational events or circumstances are outside the Advisor’s control, including instances at third parties. The Portfolio and the Advisor seek to reduce these operational risks through controls and procedures. However, these measures do not address every possible risk and may be inadequate to address these risks.
Cyber Security Risk: The Portfolio’s and its service providers’ use of internet, technology and information systems may expose the Portfolio to potential risks linked to cyber security breaches of those technological or information systems. Cyber security breaches, amongst other things, could allow an unauthorized party to gain access to proprietary information, customer data, or fund assets, or cause the Portfolio and/or its service providers to suffer data corruption or lose operational functionality.
111
the after-tax returns shown are not relevant to investors who hold shares of the Portfolio through tax-advantaged arrangements, such as 401(k) plans or individual retirement accounts.
January 2013-December 2022
|
|
|
|
|
|
|
Periods ending December 31, 2022
|
|
|
|
|
|
|||||||||||||||||
|
1 Year |
5 Years |
10 Years | |||||||||||||||||||
|
Emerging Markets Portfolio |
|
|
|
|
|
| |||||||||||||||
|
| |||||||||||||||||||||
|
Return Before Taxes |
- |
% |
|
|
- |
% |
|
|
|
% |
| ||||||||||
|
| |||||||||||||||||||||
|
Return After Taxes on Distributions |
- |
% |
|
|
|
- |
% |
|
|
|
% |
| |||||||||
|
| |||||||||||||||||||||
|
Return After Taxes on Distributions and Sale of Portfolio Shares |
- |
% |
|
|
- |
% |
|
|
|
% |
| ||||||||||
|
| |||||||||||||||||||||
|
MSCI
Emerging Markets Index (net dividends) |
- |
% |
|
|
- |
% |
|
|
|
% |
| ||||||||||
| |||||||||||||||||||||
Investment Advisor/Portfolio Management
Dimensional Fund Advisors LP serves as the investment advisor for the Emerging Markets Portfolio and Emerging Markets Series. Dimensional Fund Advisors Ltd. and DFA Australia Limited serve as the sub-advisors for the Series. The following individuals are responsible for leading the day-to-day management of the Portfolio and the Series:
|
• |
Jed S. Fogdall, Global Head of Portfolio Management, Chairman of the Investment Committee, Vice President and Senior Portfolio Manager of the Advisor, has been a portfolio manager of the Portfolio since 2010. | |||||||||||||||||||||||||||||||||||||||||||||||||||||||||||||||||||||||||||||||||||||||||||||||||
|
• |
Allen Pu, Deputy Head of Portfolio Management, North America, member of the Investment Committee, Vice President and Senior Portfolio Manager of the Advisor, has been a portfolio manager of the Portfolio since 2020. | |||||||||||||||||||||||||||||||||||||||||||||||||||||||||||||||||||||||||||||||||||||||||||||||||
112
|
• |
Ethan Wren, Vice President and Senior Portfolio Manager of the Advisor, has been a portfolio manager of the Portfolio since 2020. |
Purchase and Redemption of Fund Shares
Investors may purchase or redeem shares of the Emerging Markets Portfolio on each day that the NYSE is scheduled to be open for business by first contacting the Portfolio’s transfer agent at (888) 576-1167. Shareholders that invest in the Portfolio through a financial intermediary should contact their financial intermediary regarding purchase and redemption procedures. The Portfolio generally is available for investment only by institutional clients, clients of registered investment advisors, clients of financial institutions and a limited number of certain other investors as approved from time to time by the Advisor. All investments are subject to approval of the Advisor.
Tax Information
The dividends and distributions you receive from the Emerging Markets Portfolio are taxable and generally will be taxed as ordinary income, capital gains, or some combination of both, unless you are investing through a tax-advantaged arrangement, such as a 401(k) plan or an individual retirement account, in which case distributions may be taxed as ordinary income when withdrawn from the plan or account.
Payments to Financial Intermediaries
If you purchase the Emerging Markets Portfolio through a broker-dealer or other financial intermediary (such as a bank), the Portfolio and its related companies may pay the intermediary for the sale of the Portfolio shares and/or related services. These payments may create a conflict of interest by influencing the financial intermediary to recommend the Portfolio over another investment. Ask your financial advisor or visit your financial intermediary’s website for more information.
113
The investment objective of the Emerging Markets Value Portfolio (the “Portfolio”) is to achieve long-term capital appreciation. The Emerging Markets Value Portfolio is a Feeder Portfolio and pursues its objective by investing substantially all of its assets in its corresponding Master Fund, the Dimensional Emerging Markets Value Fund (the “Emerging Markets Value Fund”), which has the same investment objective and policies as the Portfolio.
This table describes the fees and expenses you may pay if you buy, hold or sell shares of the Emerging Markets Value Portfolio. You may pay other fees, such as brokerage commissions and other fees to financial intermediaries, which are not reflected in the table and Example below.
year as a percentage of the value of
your investment)
|
|
|
|
|
Management Fee |
| |
|
| ||
|
Other Expenses |
| |
|
| ||
|
Total Annual Fund Operating Expenses |
| |
|
| ||
|
Fee Waiver and/or Expense Reimbursement |
| |
|
| ||
|
Total Annual Fund Operating Expenses After Fee Waiver and/or Expense Reimbursement |
| |
|
| ||
|
* |
| ||
|
** |
|
This Example is meant to help you compare the cost of investing in the Emerging Markets Value Portfolio with the cost of investing in other mutual funds. The Example assumes that you invest $10,000 in the Portfolio for the time periods indicated. The Example also assumes that your investment has a 5% return each year and that the Portfolio’s operating expenses remain the same. Although your actual costs may be higher or lower, based on these assumptions your costs would be:
|
|
|
|
|
|
|
|
|
1 Year |
3 Years |
5 Years |
10 Years | |||
|
$ |
$ |
$ |
$ | |||
|
| ||||||
The Example reflects the aggregate annual operating expenses of the Emerging Markets Value Portfolio and the Portfolio’s portion of the expenses of the Emerging Markets Value Fund.
114
The Emerging Markets Value
Fund pays transaction costs, such as commissions, when it buys and sells
securities (or “turns over” its portfolio). A higher portfolio turnover may
indicate higher transaction costs and may result in higher taxes when Portfolio
shares are held in a taxable account. These costs, which are not reflected in
Annual Fund Operating Expenses or in the Example, affect the Emerging Markets
Value Portfolio’s performance. During the most recent fiscal year, the Emerging
Markets Value Fund’s portfolio turnover rate was
The Emerging Markets Value Portfolio invests substantially all of its assets in the Emerging Markets Value Fund. To achieve the Portfolio’s and the Series’ investment objectives, the Advisor implements an integrated investment approach that combines research, portfolio design, portfolio management, and trading functions. As further described below, the Series’ design emphasizes long-term drivers of expected returns identified by the Advisor’s research, while balancing risk through broad diversification across companies and sectors. The Advisor’s portfolio management and trading processes further balance those long-term drivers of expected returns with shorter-term drivers of expected returns and trading costs.
The Emerging Markets Value Fund is designed to purchase emerging market equity securities that are deemed by the Advisor to be value stocks at the time of purchase and associated with emerging markets, which may include frontier markets (emerging market countries in an earlier stage of development), authorized for investment by the Advisor’s Investment Committee (“Approved Markets”). An equity issuer is considered to have a low relative price (i.e., a value stock) primarily because it has a low price in relation to its book value. In assessing relative price, the Advisor may consider additional factors such as price to cash flow or price to earnings ratios. The Emerging Markets Value Fund may emphasize certain stocks, including smaller capitalization companies, lower relative price stocks, and/or higher profitability stocks as compared to their representation in the value segments of the Approved Markets in which the Fund is authorized to invest. An equity issuer is considered to have high profitability because it has high earnings or profits from operations in relation to its book value or assets. The criteria the Advisor uses for assessing relative price and profitability are subject to change from time to time. As a non-fundamental policy, under normal circumstances, the Emerging Markets Value Fund will invest at least 80% of its net assets in emerging markets investments that are defined in the Prospectus as Approved Markets securities. The Emerging Markets Value Fund may purchase emerging market equity securities across all market capitalizations.
The Advisor may also increase or reduce the Emerging Market Value Fund’s exposure to an eligible company, or exclude a company, based on shorter-term considerations, such as a company’s price momentum and investment characteristics. In assessing a company’s investment characteristics, the Advisor considers ratios such as recent changes in assets divided by total assets. The criteria the Advisor uses for assessing a company’s investment characteristics are subject to change from time to time. In addition, the Advisor seeks to reduce trading costs using a flexible trading approach that looks for opportunities to participate in the available market liquidity, while managing turnover and explicit transaction costs.
The Emerging Markets Value Fund may gain exposure to companies associated with Approved Markets by purchasing equity securities in the form of depositary receipts, which may be listed or traded outside the issuer’s domicile country. The Emerging Markets Value Fund may also invest in China A-shares (equity securities of companies listed in China) and variable interest entities (special structures that utilize contractual arrangements to provide exposure to certain Chinese companies). The Emerging Markets Value Portfolio and the Emerging Markets Value Fund each may purchase or sell futures contracts and options on futures contracts for Approved Market or other equity market securities and indices, including those of the United States, to increase or decrease equity market exposure based on actual or expected cash inflows to or outflows from the Portfolio or Emerging Markets Value Fund. Because many of the Emerging Markets Value Fund’s and the Portfolio’s investments may be denominated in foreign currencies, the Emerging Markets Value Fund and the Portfolio may enter into foreign currency exchange transactions, including foreign currency forward contracts, in connection with the settlement of foreign securities or to transfer cash balances from one currency to another currency.
115
The Emerging Markets Value Fund may lend its portfolio securities to generate additional income.
Equity Market Risk: Even a long-term investment approach cannot guarantee a profit. Economic, market, political, and issuer-specific conditions and events will cause the value of equity securities, and the Portfolio that owns them, to rise or fall. Stock markets tend to move in cycles, with periods of rising prices and periods of falling prices.
Foreign Securities and Currencies Risk: Foreign securities prices may decline or fluctuate because of: (a) economic or political actions of foreign governments, and/or (b) less regulated or liquid securities markets. Investors holding these securities may also be exposed to foreign currency risk (the possibility that foreign currency will fluctuate in value against the U.S. dollar or that a foreign government will convert, or be forced to convert, its currency to another currency, changing its value against the U.S. dollar). The Emerging Markets Value Fund does not hedge foreign currency risk.
Depositary receipts are generally subject to the same risks as the foreign securities that they evidence or into which they may be converted. In addition, the underlying issuers of certain depositary receipts, particularly unsponsored or unregistered depositary receipts, are under no obligation to distribute shareholder communications to the holders of such receipts, or to pass through to them any voting rights with respect to the deposited securities. Depositary receipts that are not sponsored by the issuer may be less liquid and there may be less readily available public information about the issuer.
Emerging Markets Risk: Numerous emerging market countries have a history of, and continue to experience serious, and potentially continuing, economic and political problems. Stock markets in many emerging market countries are relatively small, expensive to trade in and generally have higher risks than those in developed markets. Securities in emerging markets also may be less liquid than those in developed markets and foreigners are often limited in their ability to invest in, and withdraw assets from, these markets. Additional restrictions may be imposed under other conditions. Frontier market countries generally have smaller economies or less developed capital markets and, as a result, the risks of investing in emerging market countries are magnified in frontier market countries.
China Investments Risk: There are special risks associated with investments in China and Taiwan, which are considered emerging market countries by the Portfolio. The Chinese government has implemented significant economic reforms in order to liberalize trade policy, promote foreign investment in the economy, reduce government control of the economy and develop market mechanisms. But there can be no assurance that these reforms will continue or that they will be effective. Despite reforms and privatizations of companies in certain sectors, the Chinese government still exercises substantial influence over many aspects of the private sector and may own or control many companies. The Chinese government continues to maintain a major role in economic policy making and investing in China involves risks of losses due to expropriation, nationalization, confiscation of assets and property, and the imposition of restrictions on foreign investments and on repatriation of capital invested.
A reduction in spending on Chinese products and services or the institution of additional tariffs or other trade barriers, including as a result of heightened trade tensions between China and the United States may also have an adverse impact on the Chinese economy. In addition, investments in Taiwan could be adversely affected by its political and economic relationship with China. Certain securities issued by companies located or operating in China, such as China A-shares, are also subject to trading restrictions, quota limitations and less market liquidity, which could pose risks to the Portfolio. The Emerging Markets Value Fund may also invest in special structures that utilize contractual arrangements to provide exposure to certain Chinese companies, known as variable
116
interest entities (“VIEs”), that operate in sectors in which China restricts and/or prohibits foreign investments. The Chinese government’s acceptance of the VIE structure is evolving. It is uncertain whether Chinese officials and regulators will withdraw their acceptance of the structure or whether Chinese courts or arbitration bodies would decline to enforce the contractual rights of foreign investors, each of which would likely have significant, detrimental, and possibly permanent losses on the value of such investments.
Small and Mid-Cap Company Risk: Securities of small and mid-cap companies are often less liquid than those of large companies and this could make it difficult to sell a small or mid-cap company security at a desired time or price. As a result, small and mid-cap company stocks may fluctuate relatively more in price. In general, small and mid-capitalization companies are also more vulnerable than larger companies to adverse business or economic developments and they may have more limited resources.
Value Investment Risk: Value stocks may perform differently from the market as a whole and an investment strategy purchasing these securities may cause the Emerging Markets Value Fund to at times underperform equity funds that use other investment strategies. Value stocks can react differently to political, economic, and industry developments than the market as a whole and other types of stocks. Value stocks also may underperform the market for long periods of time.
Profitability Investment Risk: High relative profitability stocks may perform differently from the market as a whole and an investment strategy purchasing these securities may cause the Emerging Markets Value Fund to at times underperform equity funds that use other investment strategies.
Derivatives Risk: Derivatives are instruments, such as futures, and options thereon, and foreign currency forward contracts, whose value is derived from that of other assets, rates or indices. The use of derivatives for non-hedging purposes may be considered to carry more risk than other types of investments. When the Emerging Markets Value Fund and the Portfolio use derivatives, the Portfolio will be directly exposed to the risks of those derivatives. Derivative instruments are subject to a number of risks including counterparty, settlement, liquidity, interest rate, market, credit and management risks, as well as the risk of improper valuation. Changes in the value of a derivative may not correlate perfectly with the underlying asset, rate or index, and the Portfolio could lose more than the principal amount invested.
Securities Lending Risk: Securities lending involves the risk that the borrower may fail to return the securities in a timely manner or at all. As a result, the Emerging Markets Value Fund may lose money and there may be a delay in recovering the loaned securities. The Emerging Markets Value Fund could also lose money if it does not recover the securities and/or the value of the collateral falls, including the value of investments made with cash collateral. Securities lending also may have certain adverse tax consequences.
Operational Risk: Operational risks include human error, changes in personnel, system changes, faults in communication, and failures in systems, technology, or processes. Various operational events or circumstances are outside the Advisor’s control, including instances at third parties. The Portfolio and the Advisor seek to reduce these operational risks through controls and procedures. However, these measures do not address every possible risk and may be inadequate to address these risks.
Cyber Security Risk: The Portfolio’s and its service providers’ use of internet, technology and information systems may expose the Portfolio to potential risks linked to cyber security breaches of those technological or information systems. Cyber security breaches, amongst other things, could allow an unauthorized party to gain access to proprietary information, customer data, or fund assets, or cause the Portfolio and/or its service providers to suffer data corruption or lose operational functionality.
117
January 2013-December 2022
|
|
|
|
|
|
|
Periods ending December 31, 2022
|
|
|
|
|
|
| ||||||||||||||||
|
1 Year |
5 Years |
10 Years | |||||||||||||||||||
|
Emerging Markets Value Portfolio |
|
|
|
|
|
| |||||||||||||||
|
| |||||||||||||||||||||
|
Return Before Taxes |
- |
% |
|
|
|
- |
% |
|
|
|
% |
| |||||||||
|
| |||||||||||||||||||||
|
Return After Taxes on Distributions |
- |
% |
|
|
- |
% |
|
|
|
% |
| ||||||||||
|
| |||||||||||||||||||||
|
Return After Taxes on Distributions and Sale of Portfolio Shares |
- |
% |
|
|
- |
% |
|
|
|
% |
| ||||||||||
| |||||||||||||||||||||
|
MSCI
Emerging Markets Value Index (net dividends) |
|
- |
% |
|
|
- |
% |
|
|
|
% |
| |||||||||
| |||||||||||||||||||||
Investment Advisor/Portfolio Management
Dimensional Fund Advisors LP serves as the investment advisor for the Emerging Markets Value Portfolio and Emerging Markets Value Fund. Dimensional Fund Advisors Ltd. and DFA Australia Limited serve as the sub-advisors for the Emerging Markets Value Fund. The following individuals are responsible for leading the day-to-day management of the Portfolio and Emerging Markets Value Fund:
118
|
• |
Jed S. Fogdall, Global Head of Portfolio Management, Chairman of the Investment Committee, Vice President and Senior Portfolio Manager of the Advisor, has been a portfolio manager of the Portfolio since 2010. | |||||||||||||||||||||||||||||||||||||||||||||||||||||||||||||||||||||||||||||||||||||||||||||||||
|
• |
Allen Pu, Deputy Head of Portfolio Management, North America, member of the Investment Committee, Vice President and Senior Portfolio Manager of the Advisor, has been a portfolio manager of the Portfolio since 2020. | |||||||||||||||||||||||||||||||||||||||||||||||||||||||||||||||||||||||||||||||||||||||||||||||||
|
• |
Ethan Wren, Vice President and Senior Portfolio Manager of the Advisor, has been a portfolio manager of the Portfolio since 2020. | |||||||||||||||||||||||||||||||||||||||||||||||||||||||||||||||||||||||||||||||||||||||||||||||||
Purchase and Redemption of Fund Shares
Investors may purchase or redeem shares of the Emerging Markets Value Portfolio on each day that the NYSE is scheduled to be open for business by first contacting the Portfolio’s transfer agent at (888) 576-1167. Shareholders that invest in the Portfolio through a financial intermediary should contact their financial intermediary regarding purchase and redemption procedures. The Portfolio generally is available for investment only by institutional clients, clients of registered investment advisors, clients of financial institutions and a limited number of certain other investors as approved from time to time by the Advisor. All investments are subject to approval of the Advisor.
Tax Information
The dividends and distributions you receive from the Emerging Markets Value Portfolio are taxable and generally will be taxed as ordinary income, capital gains, or some combination of both, unless you are investing through a tax-advantaged arrangement, such as a 401(k) plan or an individual retirement account, in which case distributions may be taxed as ordinary income when withdrawn from the plan or account.
Payments to Financial Intermediaries
If you purchase the Emerging Markets Value Portfolio through a broker-dealer or other financial intermediary (such as a bank), the Portfolio and its related companies may pay the intermediary for the sale of the Portfolio shares and/or related services. These payments may create a conflict of interest by influencing the financial intermediary to recommend the Portfolio over another investment. Ask your financial advisor or visit your financial intermediary’s website for more information.
119
The investment objective of the Emerging Markets Targeted Value Portfolio (the “Portfolio”) is long-term capital appreciation.
This table describes the fees and expenses you may pay if you buy, hold or sell shares of the Emerging Markets Targeted Value Portfolio. You may pay other fees, such as brokerage commissions and other fees to financial intermediaries, which are not reflected in the table and Example below.
year as a percentage of the value of
your investment)
|
|
|
|
|
Management Fee |
| |
|
| ||
|
Other Expenses |
| |
|
| ||
|
Total Annual Fund Operating Expenses |
| |
|
| ||
This Example is meant to help you compare the cost of investing in the Emerging Markets Targeted Value Portfolio with the cost of investing in other mutual funds. The Example assumes that you invest $10,000 in the Portfolio for the time periods indicated. The Example also assumes that your investment has a 5% return each year and that the Portfolio’s operating expenses remain the same. Although your actual costs may be higher or lower, based on these assumptions, your costs would be:
|
|
|
|
|
|
|
|
|
1 Year |
3 Years |
5 Years |
10 Years | |||
|
$ |
$ |
$ |
$ | |||
|
| ||||||
The Emerging Markets Targeted
Value Portfolio pays transaction costs, such as commissions, when it buys and
sells securities (or “turns over” its portfolio). A higher portfolio turnover
may indicate higher transaction costs and may result in higher taxes when
Portfolio shares are held in a taxable account. These costs, which are not
reflected in Annual Fund Operating Expenses or in the Example, affect the
Portfolio’s performance. During the most recent fiscal year the Portfolio’s
portfolio turnover rate was
To achieve the Emerging Markets Targeted Value Portfolio’s investment objective, the Advisor implements an integrated investment approach that combines research, portfolio design, portfolio management, and trading functions. As further described below, the Portfolio’s design emphasizes long-term drivers of expected returns identified by the Advisor’s research, while balancing risk through broad diversification across companies and sectors. The Advisor’s portfolio management and trading processes further balance those long-term drivers of expected returns with shorter-term drivers of expected returns and trading costs.
120
The Emerging Markets Targeted Value Portfolio is designed to provide exposure to a broad and diverse portfolio of securities, with a focus on small and mid-cap value companies with higher profitability associated with emerging markets, which may include frontier markets (emerging market countries in an earlier stage of development), authorized for investment by the Advisor’s Investment Committee (“Approved Markets”). The Advisor determines size based primarily on market capitalization. A company’s market capitalization is the number of its shares outstanding times its price per share. An equity issuer is considered to have a low relative price (i.e., a value stock) primarily because it has a low price in relation to its book value. In assessing relative price, the Advisor may consider additional factors such as price to cash flow or price to earnings ratios. The Portfolio may emphasize certain stocks, including smaller capitalization companies, lower relative price stocks, and/or higher profitability stocks as compared to their representation in the small- and mid-cap value segments of the Approved Markets in which the Portfolio is authorized to invest. An equity issuer is considered to have high profitability because it has high earnings or profits from operations in relation to its book value or assets. The criteria the Advisor uses for assessing relative price and profitability are subject to change from time to time.
As a non-fundamental policy, under normal circumstances, the Emerging Markets Targeted Value Portfolio will invest at least 80% of its net assets in emerging markets equity investments that are defined in the Prospectus as Approved Market securities.
The Advisor may also increase or reduce the Emerging Markets Targeted Value Portfolio’s exposure to an eligible company, or exclude a company, based on shorter-term considerations, such as a company’s price momentum and investment characteristics. In assessing a company’s investment characteristics, the Advisor considers ratios such as recent changes in assets divided by total assets. The criteria the Advisor uses for assessing a company’s investment characteristics are subject to change from time to time. In addition, the Advisor seeks to reduce trading costs using a flexible trading approach that looks for opportunities to participate in the available market liquidity, while managing turnover and explicit transaction costs.
The Emerging Markets Targeted Value Portfolio may gain exposure to companies associated with Approved Markets by purchasing equity securities in the form of depositary receipts, which may be listed or traded outside the issuer’s domicile country. The Portfolio may also invest in China A-shares (equity securities of companies listed in China) and variable interest entities (special structures that utilize contractual arrangements to provide exposure to certain Chinese companies). The Portfolio may purchase or sell futures contracts and options on futures contracts for Approved Market or other equity market securities and indices, including those of the United States, to increase or decrease equity market exposure based on actual or expected cash inflows to or outflows from the Portfolio. Because many of the Portfolio’s investments may be denominated in foreign currencies, the Portfolio may enter into foreign currency exchange transactions, including foreign currency forward contracts, in connection with the settlement of foreign securities or to transfer cash balances from one currency to another currency.
The Emerging Markets Targeted Value Portfolio may lend its portfolio securities to generate additional income.
Equity Market Risk: Even a long-term investment approach cannot guarantee a profit. Economic, market, political, and issuer-specific conditions and events will cause the value of equity securities, and the Portfolio that owns them, to rise or fall. Stock markets tend to move in cycles, with periods of rising prices and periods of falling prices.
Foreign Securities and Currencies Risk: Foreign securities prices may decline or fluctuate because of: (a) economic or political actions of foreign governments, and/or (b) less regulated or liquid securities markets. Investors holding these securities may also be exposed to foreign currency risk (the possibility that foreign
121
currency will fluctuate in value against the U.S. dollar or that a foreign government will convert, or be forced to convert, its currency to another currency, changing its value against the U.S. dollar). The Portfolio does not hedge foreign currency risk.
Depositary receipts are generally subject to the same risks as the foreign securities that they evidence or into which they may be converted. In addition, the underlying issuers of certain depositary receipts, particularly unsponsored or unregistered depositary receipts, are under no obligation to distribute shareholder communications to the holders of such receipts, or to pass through to them any voting rights with respect to the deposited securities. Depositary receipts that are not sponsored by the issuer may be less liquid and there may be less readily available public information about the issuer.
Small and Mid-Cap Company Risk: Securities of small and mid-cap companies are often less liquid than those of large companies and this could make it difficult to sell a small or mid-cap company security at a desired time or price. As a result, small and mid-cap company stocks may fluctuate relatively more in price. In general, small and mid-cap companies are also more vulnerable than larger companies to adverse business or economic developments and they may have more limited resources.
Emerging Markets Risk: Numerous emerging market countries have a history of, and continue to experience serious, and potentially continuing, economic and political problems. Stock markets in many emerging market countries are relatively small, expensive to trade in and generally have higher risks than those in developed markets. Securities in emerging markets also may be less liquid than those in developed markets and foreigners are often limited in their ability to invest in, and withdraw assets from, these markets. Additional restrictions may be imposed under other conditions. Frontier market countries generally have smaller economies or less developed capital markets and, as a result, the risks of investing in emerging market countries are magnified in frontier market countries.
China Investments Risk: There are special risks associated with investments in China and Taiwan, which are considered emerging market countries by the Portfolio. The Chinese government has implemented significant economic reforms in order to liberalize trade policy, promote foreign investment in the economy, reduce government control of the economy and develop market mechanisms. But there can be no assurance that these reforms will continue or that they will be effective. Despite reforms and privatizations of companies in certain sectors, the Chinese government still exercises substantial influence over many aspects of the private sector and may own or control many companies. The Chinese government continues to maintain a major role in economic policy making and investing in China involves risks of losses due to expropriation, nationalization, confiscation of assets and property, and the imposition of restrictions on foreign investments and on repatriation of capital invested.
A reduction in spending on Chinese products and services or the institution of additional tariffs or other trade barriers, including as a result of heightened trade tensions between China and the United States may also have an adverse impact on the Chinese economy. In addition, investments in Taiwan could be adversely affected by its political and economic relationship with China. Certain securities issued by companies located or operating in China, such as China A-shares, are also subject to trading restrictions, quota limitations and less market liquidity, which could pose risks to the Portfolio. The Portfolio may also invest in special structures that utilize contractual arrangements to provide exposure to certain Chinese companies, known as variable interest entities (“VIEs”), that operate in sectors in which China restricts and/or prohibits foreign investments. The Chinese government’s acceptance of the VIE structure is evolving. It is uncertain whether Chinese officials and regulators will withdraw their acceptance of the structure or whether Chinese courts or arbitration bodies would decline to enforce the contractual rights of foreign investors, each of which would likely have significant, detrimental, and possibly permanent losses on the value of such investments.
Value Investment Risk: Value stocks may perform differently from the market as a whole and an investment strategy purchasing these securities may cause the Portfolio to at times underperform equity funds that use other investment strategies. Value stocks can react differently to political, economic, and industry developments than the market as a whole and other types of stocks. Value stocks also may underperform the market for long periods of time.
122
Profitability Investment Risk: High relative profitability stocks may perform differently from the market as a whole and an investment strategy purchasing these securities may cause the Portfolio to at times underperform equity funds that use other investment strategies.
Derivatives Risk: Derivatives are instruments, such as futures and options thereon, and foreign currency forward contracts, whose value is derived from that of other assets, rates or indices. The use of derivatives for non-hedging purposes may be considered to carry more risk than other types of investments. When the Portfolio uses derivatives, the Portfolio will be directly exposed to the risks of those derivatives. Derivative instruments are subject to a number of risks including counterparty, settlement, liquidity, interest rate, market, credit and management risks, as well as the risk of improper valuation. Changes in the value of a derivative may not correlate perfectly with the underlying asset, rate or index, and the Portfolio could lose more than the principal amount invested.
Securities Lending Risk: Securities lending involves the risk that the borrower may fail to return the securities in a timely manner or at all. As a result, the Portfolio may lose money and there may be a delay in recovering the loaned securities. The Portfolio could also lose money if it does not recover the securities and/or the value of the collateral falls, including the value of investments made with cash collateral. Securities lending also may have certain adverse tax consequences.
Operational Risk: Operational risks include human error, changes in personnel, system changes, faults in communication, and failures in systems, technology, or processes. Various operational events or circumstances are outside the Advisor’s control, including instances at third parties. The Portfolio and the Advisor seek to reduce these operational risks through controls and procedures. However, these measures do not address every possible risk and may be inadequate to address these risks.
Cyber Security Risk: The Portfolio’s and its service providers’ use of internet, technology and information systems may expose the Portfolio to potential risks linked to cyber security breaches of those technological or information systems. Cyber security breaches, amongst other things, could allow an unauthorized party to gain access to proprietary information, customer data, or fund assets, or cause the Portfolio and/or its service providers to suffer data corruption or lose operational functionality.
123
January 2019-December 2022
|
|
|
|
|
|
|
Periods ending December 31, 2022
|
|
|
|
| |||||||||||
|
1 Year |
Since
| |||||||||||||
|
Emerging Markets Targeted Value Portfolio |
|
|
|
| ||||||||||
|
| ||||||||||||||
|
Return Before Taxes |
- |
% |
|
|
|
% |
| |||||||
|
| ||||||||||||||
|
Return After Taxes on Distributions |
- |
% |
|
|
|
% |
| |||||||
|
| ||||||||||||||
|
Return After Taxes on Distributions and Sale of Portfolio Shares |
- |
% |
|
|
|
% |
| |||||||
|
| ||||||||||||||
|
MSCI
Emerging Markets Index (net dividends) |
- |
% |
|
|
|
% |
| |||||||
| ||||||||||||||
Investment Advisor/Portfolio Management
Dimensional Fund Advisors LP serves as the investment advisor for the Emerging Markets Targeted Value Portfolio. Dimensional Fund Advisors Ltd. and DFA Australia Limited serve as the sub-advisors for the Portfolio. The following individuals are responsible for leading the day-to-day management of the Portfolio:
|
• |
Jed S. Fogdall, Global Head of Portfolio Management, Chairman of the Investment Committee, Vice President and Senior Portfolio Manager of the Advisor, has been a portfolio manager of the Portfolio since its inception (2018). | |||||||||||||||||||||||||||||||||||||||||||||||||||||||||||||||||||||||||||||||||||||||||||||||||
|
• |
Allen Pu, Deputy Head of Portfolio Management, North America, member of the Investment Committee, Vice President and Senior Portfolio Manager of the Advisor, has been a portfolio manager of the Portfolio since 2020. | |||||||||||||||||||||||||||||||||||||||||||||||||||||||||||||||||||||||||||||||||||||||||||||||||
|
• |
Ethan Wren, Vice President and Senior Portfolio Manager of the Advisor, has been a portfolio manager of the Portfolio since 2020. | |||||||||||||||||||||||||||||||||||||||||||||||||||||||||||||||||||||||||||||||||||||||||||||||||
124
Purchase and Redemption of Fund Shares
Investors may purchase or redeem shares of the Emerging Markets Targeted Value Portfolio on each day that the New York Stock Exchange is scheduled to be open for business by first contacting the Portfolio’s transfer agent at (888) 576-1167. Shareholders that invest in the Portfolio through a financial intermediary should contact their financial intermediary regarding purchase and redemption procedures. The Portfolio generally is available for investment only by institutional clients, clients of registered investment advisors, clients of financial institutions and a limited number of certain other investors as approved from time to time by the Advisor. All investments are subject to approval of the Advisor.
Tax Information
The dividends and distributions you receive from the Emerging Markets Targeted Value Portfolio are taxable and generally will be taxed as ordinary income, capital gains, or some combination of both, unless you are investing through a tax-advantaged arrangement, such as a 401(k) plan or an individual retirement account, in which case distributions may be taxed as ordinary income when withdrawn from the plan or account.
Payments to Financial Intermediaries
If you purchase the Emerging Markets Targeted Value Portfolio through a broker-dealer or other financial intermediary (such as a bank), the Portfolio and its related companies may pay the intermediary for the sale of the Portfolio shares and/or related services. These payments may create a conflict of interest by influencing the financial intermediary to recommend the Portfolio over another investment. Ask your financial advisor or visit your financial intermediary’s website for more information.
125
The investment objective of the Emerging Markets Small Cap Portfolio (the “Portfolio”) is to achieve long-term capital appreciation. The Emerging Markets Small Cap Portfolio is a Feeder Portfolio and pursues its objective by investing substantially all of its assets in its corresponding Master Fund, The Emerging Markets Small Cap Series (the “Emerging Markets Small Cap Series” or the “Series”) of The DFA Investment Trust Company (the “Trust”), which has the same investment objective and policies as the Portfolio.
This table describes the fees and expenses you may pay if you buy, hold or sell shares of the Emerging Markets Small Cap Portfolio. You may pay other fees, such as brokerage commissions and other fees to financial intermediaries, which are not reflected in the table and Example below.
year as a percentage of the value of
your investment)
|
|
|
|
|
Management Fee |
| |
|
| ||
|
Other Expenses |
| |
|
| ||
|
Total Annual Fund Operating Expenses |
| |
|
| ||
|
Fee Waiver and/or Expense Reimbursement |
| |
|
| ||
|
Total Annual Fund Operating Expenses After Fee Waiver and/or Expense Reimbursement |
| |
|
| ||
|
* |
| |||||||||||||||||||||||||||||||||||||||||||||||||||||||||||||||||||||||||||||||||||||||||||||||||
This Example is meant to help you compare the cost of investing in the Emerging Markets Small Cap Portfolio with the cost of investing in other mutual funds. The Example assumes that you invest $10,000 in the Portfolio for the time periods indicated. The Example also assumes that your investment has a 5% return each year and that the Portfolio’s operating expenses remain the same. Although your actual costs may be higher or lower, based on these assumptions your costs would be:
|
|
|
|
|
|
| |
|
1 Year |
3 Years |
5 Years |
10 Years | |||
|
$ |
$ |
$ |
$ | |||
|
| ||||||
The Example reflects the aggregate annual operating expenses of the Emerging Markets Small Cap Portfolio and the Portfolio’s portion of the Emerging Markets Small Cap Series.
126
The Emerging Markets Small Cap
Series pays transaction costs, such as commissions, when it buys and sells
securities (or “turns over” its portfolio). A higher portfolio turnover may
indicate higher transaction costs and may result in higher taxes when Portfolio
shares are held in a taxable account. These costs, which are not reflected in
Annual Fund Operating Expenses or in the Example, affect the Emerging Markets
Small Cap Portfolio’s performance. During the most recent fiscal year, the
Series’ portfolio turnover rate was
To achieve the Emerging Markets Small Cap Portfolio’s investment objective, the Advisor implements an integrated investment approach that combines research, portfolio design, portfolio management, and trading functions. As further described below, the Portfolio’s design emphasizes long-term drivers of expected returns identified by the Advisor’s research, while balancing risk through broad diversification across companies and sectors. The Advisor’s portfolio management and trading processes further balance those long-term drivers of expected returns with shorter-term drivers of expected returns and trading costs.
The Emerging Markets Small Cap Portfolio invests substantially all of its assets in the Emerging Markets Small Cap Series. The Series is designed to purchase a broad market coverage of smaller companies associated with emerging markets, which may include frontier markets (emerging market countries in an earlier stage of development), authorized for investment by the Advisor’s Investment Committee (“Approved Markets”). The Advisor’s definition of small varies across countries and is based primarily on market capitalization. A company’s market capitalization is the number of its shares outstanding times its price per share. In each country authorized for investment, the Advisor first ranks eligible companies listed on selected exchanges based on the companies’ market capitalizations. The Advisor then defines the maximum market capitalization for a small company in that country. For example, based on market capitalization data as of December 31, 2022, Mexico had a size threshold of below $4,888 million, and Greece had a size threshold of below $1,925 million. These thresholds will change due to market conditions. The Series may emphasize certain stocks, including smaller capitalization companies, lower relative price stocks, and/or higher profitability stocks as compared to their representation in the small-cap segment of the Approved Markets in which the Series is authorized to invest. An equity issuer is considered to have a low relative price (i.e., a value stock) primarily because it has a low price in relation to its book value. In assessing relative price, the Advisor may consider additional factors such as price to cash flow or price to earnings ratios. An equity issuer is considered to have high profitability because it has high earnings or profits from operations in relation to its book value or assets. The criteria the Advisor uses for assessing relative price and profitability are subject to change from time to time.
As a non-fundamental policy, under normal circumstances, the Emerging Markets Small Cap Series will invest at least 80% of its net assets in emerging market investments that are designated in the Prospectus as Approved Market securities of small companies.
The Advisor may also increase or reduce the Emerging Markets Small Cap Series’ exposure to an eligible company, or exclude a company, based on shorter-term considerations, such as a company’s price momentum and investment characteristics. In assessing a company’s investment characteristics, the Advisor considers ratios such as recent changes in assets divided by total assets. The criteria the Advisor uses for assessing a company’s investment characteristics are subject to change from time to time. In addition, the Advisor seeks to reduce trading costs using a flexible trading approach that looks for opportunities to participate in the available market liquidity, while managing turnover and explicit transaction costs.
The Emerging Markets Small Cap Series may gain exposure to companies associated with Approved Markets by purchasing equity securities in the form of depositary receipts, which may be listed or traded outside the issuer’s domicile country. The Series may also invest in China A-shares (equity securities of companies listed in China) and variable interest entities (special structures that utilize contractual arrangements to provide exposure to certain Chinese companies). The Series and the Emerging Markets Small Cap Portfolio each may purchase or sell futures contracts and options on futures contracts for Approved Market or other equity market securities and indices, including those of the United States, to increase or decrease equity market exposure based on actual or
127
expected cash inflows to or outflows from the Series or Portfolio. Because many of the Series’ and the Portfolio’s investments may be denominated in foreign currencies, the Series and the Portfolio may enter into foreign currency exchange transactions, including foreign currency forward contracts, in connection with the settlement of foreign securities or to transfer cash balances from one currency to another currency.
The Emerging Markets Small Cap Series may lend its portfolio securities to generate additional income.
Equity Market Risk: Even a long-term investment approach cannot guarantee a profit. Economic, market, political, and issuer-specific conditions and events will cause the value of equity securities, and the Portfolio that owns them, to rise or fall. Stock markets tend to move in cycles, with periods of rising prices and periods of falling prices.
Foreign Securities and Currencies Risk: Foreign securities prices may decline or fluctuate because of: (a) economic or political actions of foreign governments, and/or (b) less regulated or liquid securities markets. Investors holding these securities may also be exposed to foreign currency risk (the possibility that foreign currency will fluctuate in value against the U.S. dollar or that a foreign government will convert, or be forced to convert, its currency to another currency, changing its value against the U.S. dollar). The Series does not hedge foreign currency risk.
Depositary receipts are generally subject to the same risks as the foreign securities that they evidence or into which they may be converted. In addition, the underlying issuers of certain depositary receipts, particularly unsponsored or unregistered depositary receipts, are under no obligation to distribute shareholder communications to the holders of such receipts, or to pass through to them any voting rights with respect to the deposited securities. Depositary receipts that are not sponsored by the issuer may be less liquid and there may be less readily available public information about the issuer.
Small Company Risk: Securities of small companies are often less liquid than those of large companies and this could make it difficult to sell a small company security at a desired time or price. As a result, small company stocks may fluctuate relatively more in price. In general, smaller capitalization companies are also more vulnerable than larger companies to adverse business or economic developments and they may have more limited resources.
Profitability Investment Risk: High relative profitability stocks may perform differently from the market as a whole and an investment strategy purchasing these securities may cause the Series to at times underperform equity funds that use other investment strategies.
Value Investment Risk: Value stocks may perform differently from the market as a whole and an investment strategy purchasing these securities may cause the Series to at times underperform equity funds that use other investment strategies. Value stocks can react differently to political, economic, and industry developments than the market as a whole and other types of stocks. Value stocks also may underperform the market for long periods of time.
Emerging Markets Risk: Numerous emerging market countries have a history of, and continue to experience serious, and potentially continuing, economic and political problems. Stock markets in many emerging market countries are relatively small, expensive to trade in and generally have higher risks than those in developed markets. Securities in emerging markets also may be less liquid than those in developed markets and foreigners are often limited in their ability to invest in, and withdraw assets from, these markets. Additional restrictions may be imposed under other conditions. Frontier market countries generally have smaller economies or less
128
developed capital markets and, as a result, the risks of investing in emerging market countries are magnified in frontier market countries.
China Investments Risk: There are special risks associated with investments in China and Taiwan, which are considered emerging market countries by the Portfolio. The Chinese government has implemented significant economic reforms in order to liberalize trade policy, promote foreign investment in the economy, reduce government control of the economy and develop market mechanisms. But there can be no assurance that these reforms will continue or that they will be effective. Despite reforms and privatizations of companies in certain sectors, the Chinese government still exercises substantial influence over many aspects of the private sector and may own or control many companies. The Chinese government continues to maintain a major role in economic policy making and investing in China involves risks of losses due to expropriation, nationalization, confiscation of assets and property, and the imposition of restrictions on foreign investments and on repatriation of capital invested.
A reduction in spending on Chinese products and services or the institution of additional tariffs or other trade barriers, including as a result of heightened trade tensions between China and the United States may also have an adverse impact on the Chinese economy. In addition, investments in Taiwan could be adversely affected by its political and economic relationship with China. Certain securities issued by companies located or operating in China, such as China A-shares, are also subject to trading restrictions, quota limitations and less market liquidity, which could pose risks to the Portfolio. The Series may also invest in special structures that utilize contractual arrangements to provide exposure to certain Chinese companies, known as variable interest entities (“VIEs”), that operate in sectors in which China restricts and/or prohibits foreign investments. The Chinese government’s acceptance of the VIE structure is evolving. It is uncertain whether Chinese officials and regulators will withdraw their acceptance of the structure or whether Chinese courts or arbitration bodies would decline to enforce the contractual rights of foreign investors, each of which would likely have significant, detrimental, and possibly permanent losses on the value of such investments.
Derivatives Risk: Derivatives are instruments, such as futures, and options thereon, and foreign currency forward contracts, whose value is derived from that of other assets, rates or indices. The use of derivatives for non-hedging purposes may be considered to carry more risk than other types of investments. When the Series and the Portfolio use derivatives, the Portfolio will be directly exposed to the risks of those derivatives. Derivative instruments are subject to a number of risks including counterparty, settlement, liquidity, interest rate, market, credit and management risks, as well as the risk of improper valuation. Changes in the value of a derivative may not correlate perfectly with the underlying asset, rate or index, and the Portfolio could lose more than the principal amount invested.
Securities Lending Risk: Securities lending involves the risk that the borrower may fail to return the securities in a timely manner or at all. As a result, the Series may lose money and there may be a delay in recovering the loaned securities. The Series could also lose money if it does not recover the securities and/or the value of the collateral falls, including the value of investments made with cash collateral. Securities lending also may have certain adverse tax consequences.
Operational Risk: Operational risks include human error, changes in personnel, system changes, faults in communication, and failures in systems, technology, or processes. Various operational events or circumstances are outside the Advisor’s control, including instances at third parties. The Portfolio and the Advisor seek to reduce these operational risks through controls and procedures. However, these measures do not address every possible risk and may be inadequate to address these risks.
Cyber Security Risk: The Portfolio’s and its service providers’ use of internet, technology and information systems may expose the Portfolio to potential risks linked to cyber security breaches of those technological or information systems. Cyber security breaches, amongst other things, could allow an unauthorized party to gain access to proprietary information, customer data, or fund assets, or cause the Portfolio and/or its service providers to suffer data corruption or lose operational functionality.
129
January 2013-December 2022
|
|
|
|
|
|
|
Periods ending December 31, 2022
|
|
|
|
|
|
| ||||||||||||||||
|
1 Year |
5 Years |
10 Years | |||||||||||||||||||
|
Emerging Markets Small Cap Portfolio |
|
|
|
|
|
| |||||||||||||||
|
| |||||||||||||||||||||
|
Return Before Taxes |
- |
% |
|
|
|
% |
|
|
|
% |
| ||||||||||
|
| |||||||||||||||||||||
|
Return After Taxes on Distributions |
- |
% |
|
|
- |
% |
|
|
|
% |
| ||||||||||
|
| |||||||||||||||||||||
|
Return After Taxes on Distributions and Sale of Portfolio Shares |
- |
% |
|
|
|
% |
|
|
|
% |
| ||||||||||
|
| |||||||||||||||||||||
|
MSCI
Emerging Markets Index (net dividends) |
- |
% |
|
|
- |
% |
|
|
|
% |
| ||||||||||
| |||||||||||||||||||||
130
Investment Advisor/Portfolio Management
Dimensional Fund Advisors LP serves as the investment advisor for the Emerging Markets Small Cap Portfolio and Emerging Markets Small Cap Series. Dimensional Fund Advisors Ltd. and DFA Australia Limited serve as the sub-advisors for the Series. The following individuals are responsible for leading the day-to-day management of the Portfolio and the Series:
|
• |
Jed S. Fogdall, Global Head of Portfolio Management, Chairman of the Investment Committee, Vice President and Senior Portfolio Manager of the Advisor, has been a portfolio manager of the Portfolio since 2010. | |||||||||||||||||||||||||||||||||||||||||||||||||||||||||||||||||||||||||||||||||||||||||||||||||
|
• |
Allen Pu, Deputy Head of Portfolio Management, North America, member of the Investment Committee, Vice President and Senior Portfolio Manager of the Advisor, has been a portfolio manager of the Portfolio since 2020. | |||||||||||||||||||||||||||||||||||||||||||||||||||||||||||||||||||||||||||||||||||||||||||||||||
|
• |
Ethan Wren, Vice President and Senior Portfolio Manager of the Advisor, has been a portfolio manager of the Portfolio since 2020. | |||||||||||||||||||||||||||||||||||||||||||||||||||||||||||||||||||||||||||||||||||||||||||||||||
Purchase and Redemption of Fund Shares
Investors may purchase or redeem shares of the Emerging Markets Small Cap Portfolio on each day that the NYSE is scheduled to be open for business by first contacting the Portfolio’s transfer agent at (888) 576-1167. Shareholders that invest in the Portfolio through a financial intermediary should contact their financial intermediary regarding purchase and redemption procedures. The Portfolio generally is available for investment only by institutional clients, clients of registered investment advisors, clients of financial institutions and a limited number of certain other investors as approved from time to time by the Advisor. All investments are subject to approval of the Advisor.
Tax Information
The dividends and distributions you receive from the Emerging Markets Small Cap Portfolio are taxable and generally will be taxed as ordinary income, capital gains, or some combination of both, unless you are investing through a tax-advantaged arrangement, such as a 401(k) plan or an individual retirement account, in which case distributions may be taxed as ordinary income when withdrawn from the plan or account.
Payments to Financial Intermediaries
If you purchase the Emerging Markets Small Cap Portfolio through a broker-dealer or other financial intermediary (such as a bank), the Portfolio and its related companies may pay the intermediary for the sale of the Portfolio shares and/or related services. These payments may create a conflict of interest by influencing the financial intermediary to recommend the Portfolio over another investment. Ask your financial advisor or visit your financial intermediary’s website for more information.
131
The investment objective of the Emerging Markets Core Equity Portfolio (the “Portfolio”) is to achieve long-term capital appreciation.
This table describes the fees and expenses you may pay if you buy, hold or sell shares of the Emerging Markets Core Equity Portfolio. You may pay other fees, such as brokerage commissions and other fees to financial intermediaries, which are not reflected in the table and Example below.
year as a percentage of the value of
your investment)
|
|
|
|
|
Management Fee |
| |
|
| ||
|
Other Expenses |
| |
|
| ||
|
Total Annual Fund Operating Expenses |
| |
|
| ||
This Example is meant to help you compare the cost of investing in the Emerging Markets Core Equity Portfolio with the cost of investing in other mutual funds. The Example assumes that you invest $10,000 in the Portfolio for the time periods indicated. The Example also assumes that your investment has a 5% return each year and that the Portfolio’s operating expenses remain the same. Although your actual costs may be higher or lower, based on these assumptions your costs would be:
|
|
|
|
|
|
|
|
|
1 Year |
3 Years |
5 Years |
10 Years | |||
|
$ |
$ |
$ |
$ | |||
|
| ||||||
The Emerging Markets Core
Equity Portfolio pays transaction costs, such as commissions, when it buys and
sells securities (or “turns over” its portfolio). A higher portfolio turnover
may indicate higher transaction costs and may result in higher taxes when
Portfolio shares are held in a taxable account. These costs, which are not
reflected in Annual Fund Operating Expenses or in the Example, affect the
Portfolio’s performance. During the most recent fiscal year, the Portfolio’s
portfolio turnover rate was
To achieve the Emerging Markets Core Equity Portfolio’s investment objective, Dimensional Fund Advisors LP (the “Advisor”) implements an integrated investment approach that combines research, portfolio design, portfolio management, and trading functions. As further described below, the Portfolio’s design emphasizes long-term drivers of expected returns identified by the Advisor’s research, while balancing risk through broad diversification across companies and sectors. The Advisor’s portfolio management and trading processes further balance those long-term drivers of expected returns with shorter-term drivers of expected returns and trading costs.
132
The Emerging Markets Core Equity Portfolio is designed to purchase a broad and diverse group of securities associated with emerging markets, which may include frontier markets (emerging market countries in an earlier stage of development), authorized for investment by the Advisor’s Investment Committee (“Approved Markets”). The Portfolio invests in companies of all sizes, with increased exposure to smaller capitalization, lower relative price, and higher profitability companies. The Portfolio’s increased exposure to smaller capitalization, lower relative price, and higher profitability companies may be achieved by decreasing the allocation of the Portfolio’s assets to larger capitalization, higher relative price, or lower profitability companies. An equity issuer is considered to have a high relative price (i.e., a growth stock) primarily because it has a high price in relation to its book value. An equity issuer is considered to have a low relative price (i.e., a value stock) primarily because it has a low price in relation to its book value. In assessing relative price, the Advisor may consider additional factors such as price to cash flow or price to earnings ratios. An equity issuer is considered to have high profitability because it has high earnings or profits from operations in relation to its book value or assets. The criteria the Advisor uses for assessing relative price and profitability are subject to change from time to time.
As a non-fundamental policy, under normal circumstances, the Emerging Markets Core Equity Portfolio will invest at least 80% of its net assets in emerging markets equity investments that are defined in the Prospectus as Approved Market securities.
The Advisor may also increase or reduce the Emerging Markets Core Equity Portfolio’s exposure to an eligible company, or exclude a company, based on shorter-term considerations, such as a company’s price momentum and investment characteristics. In assessing a company’s investment characteristics, the Advisor considers ratios such as recent changes in assets divided by total assets. The criteria the Advisor uses for assessing a company’s investment characteristics are subject to change from time to time. In addition, the Advisor seeks to reduce trading costs using a flexible trading approach that looks for opportunities to participate in the available market liquidity, while managing turnover and explicit transaction costs.
The Emerging Markets Core Equity Portfolio may gain exposure to companies in Approved Markets by purchasing equity securities in the form of depositary receipts, which may be listed or traded outside the issuer’s domicile country. The Portfolio may also invest in China A-shares (equity securities of companies listed in China) and variable interest entities (special structures that utilize contractual arrangements to provide exposure to certain Chinese companies). The Portfolio may purchase or sell futures contracts and options on futures contracts for Approved Market or other equity market securities and indices, including those of the United States, to increase or decrease equity market exposure based on actual or expected cash inflows to or outflows from the Portfolio. Because many of the Portfolio’s investments may be denominated in foreign currencies, the Portfolio may enter into foreign currency exchange transactions, including foreign currency forward contracts, in connection with the settlement of foreign securities or to transfer cash balances from one currency to another currency.
The Emerging Markets Core Equity Portfolio may lend its portfolio securities to generate additional income.
Equity Market Risk: Even a long-term investment approach cannot guarantee a profit. Economic, market, political, and issuer-specific conditions and events will cause the value of equity securities, and the Portfolio that owns them, to rise or fall. Stock markets tend to move in cycles, with periods of rising prices and periods of falling prices.
Foreign Securities and Currencies Risk: Foreign securities prices may decline or fluctuate because of: (a) economic or political actions of foreign governments, and/or (b) less regulated or liquid securities markets. Investors holding these securities may also be exposed to foreign currency risk (the possibility that foreign
133
currency will fluctuate in value against the U.S. dollar or that a foreign government will convert, or be forced to convert, its currency to another currency, changing its value against the U.S. dollar). The Portfolio does not hedge foreign currency risk.
Depositary receipts are generally subject to the same risks as the foreign securities that they evidence or into which they may be converted. In addition, the underlying issuers of certain depositary receipts, particularly unsponsored or unregistered depositary receipts, are under no obligation to distribute shareholder communications to the holders of such receipts, or to pass through to them any voting rights with respect to the deposited securities. Depositary receipts that are not sponsored by the issuer may be less liquid and there may be less readily available public information about the issuer.
Small and Mid-Cap Company Risk: Securities of small and mid-cap companies are often less liquid than those of large companies and this could make it difficult to sell a small or mid-cap company security at a desired time or price. As a result, small and mid-cap company stocks may fluctuate relatively more in price. In general, small and mid- capitalization companies are also more vulnerable than larger companies to adverse business or economic developments and they may have more limited resources.
Emerging Markets Risk: Numerous emerging market countries have a history of, and continue to experience serious, and potentially continuing, economic and political problems. Stock markets in many emerging market countries are relatively small, expensive to trade in and generally have higher risks than those in developed markets. Securities in emerging markets also may be less liquid than those in developed markets and foreigners are often limited in their ability to invest in, and withdraw assets from, these markets. Additional restrictions may be imposed under other conditions. Frontier market countries generally have smaller economies or less developed capital markets and, as a result, the risks of investing in emerging market countries are magnified in frontier market countries.
China Investments Risk: There are special risks associated with investments in China and Taiwan, which are considered emerging market countries by the Portfolio. The Chinese government has implemented significant economic reforms in order to liberalize trade policy, promote foreign investment in the economy, reduce government control of the economy and develop market mechanisms. But there can be no assurance that these reforms will continue or that they will be effective. Despite reforms and privatizations of companies in certain sectors, the Chinese government still exercises substantial influence over many aspects of the private sector and may own or control many companies. The Chinese government continues to maintain a major role in economic policy making and investing in China involves risks of losses due to expropriation, nationalization, confiscation of assets and property, and the imposition of restrictions on foreign investments and on repatriation of capital invested.
A reduction in spending on Chinese products and services or the institution of additional tariffs or other trade barriers, including as a result of heightened trade tensions between China and the United States may also have an adverse impact on the Chinese economy. In addition, investments in Taiwan could be adversely affected by its political and economic relationship with China. Certain securities issued by companies located or operating in China, such as China A-shares, are also subject to trading restrictions, quota limitations and less market liquidity, which could pose risks to the Portfolio. The Portfolio may also invest in special structures that utilize contractual arrangements to provide exposure to certain Chinese companies, known as variable interest entities (“VIEs”), that operate in sectors in which China restricts and/or prohibits foreign investments. The Chinese government’s acceptance of the VIE structure is evolving. It is uncertain whether Chinese officials and regulators will withdraw their acceptance of the structure or whether Chinese courts or arbitration bodies would decline to enforce the contractual rights of foreign investors, each of which would likely have significant, detrimental, and possibly permanent losses on the value of such investments.
Profitability Investment Risk: High relative profitability stocks may perform differently from the market as a whole and an investment strategy purchasing these securities may cause the Portfolio to at times underperform equity funds that use other investment strategies.
Value Investment Risk: Value stocks may perform differently from the market as a whole and an investment strategy purchasing these securities may cause the Portfolio to at times underperform equity funds that use other investment strategies. Value stocks can react differently to political, economic, and industry developments than
134
the market as a whole and other types of stocks. Value stocks also may underperform the market for long periods of time.
Derivatives Risk: Derivatives are instruments, such as futures, and options thereon, and foreign currency forward contracts, whose value is derived from that of other assets, rates or indices. The use of derivatives for non-hedging purposes may be considered to carry more risk than other types of investments. When the Portfolio uses derivatives, the Portfolio will be directly exposed to the risks of those derivatives. Derivative instruments are subject to a number of risks including counterparty, settlement, liquidity, interest rate, market, credit and management risks, as well as the risk of improper valuation. Changes in the value of a derivative may not correlate perfectly with the underlying asset, rate or index, and the Portfolio could lose more than the principal amount invested.
Securities Lending Risk: Securities lending involves the risk that the borrower may fail to return the securities in a timely manner or at all. As a result, the Portfolio may lose money and there may be a delay in recovering the loaned securities. The Portfolio could also lose money if it does not recover the securities and/or the value of the collateral falls, including the value of investments made with cash collateral. Securities lending also may have certain adverse tax consequences.
Operational Risk: Operational risks include human error, changes in personnel, system changes, faults in communication, and failures in systems, technology, or processes. Various operational events or circumstances are outside the Advisor’s control, including instances at third parties. The Portfolio and the Advisor seek to reduce these operational risks through controls and procedures. However, these measures do not address every possible risk and may be inadequate to address these risks.
Cyber Security Risk: The Portfolio’s and its service providers’ use of internet, technology and information systems may expose the Portfolio to potential risks linked to cyber security breaches of those technological or information systems. Cyber security breaches, amongst other things, could allow an unauthorized party to gain access to proprietary information, customer data, or fund assets, or cause the Portfolio and/or its service providers to suffer data corruption or lose operational functionality.
135
January 2013-December 2022
|
|
|
|
|
|
|
Periods ending December 31, 2022
|
|
|
|
|
|
| ||||||||||||||||
|
1 Year |
5 Years |
10 Years | |||||||||||||||||||
|
Emerging Markets Core Equity Portfolio |
|
|
|
|
|
| |||||||||||||||
|
| |||||||||||||||||||||
|
Return Before Taxes |
- |
% |
|
|
- |
% |
|
|
|
% |
| ||||||||||
|
| |||||||||||||||||||||
|
Return After Taxes on Distributions |
- |
% |
|
|
- |
% |
|
|
|
% |
| ||||||||||
|
| |||||||||||||||||||||
|
Return After Taxes on Distributions and Sale of Portfolio Shares |
- |
% |
|
|
- |
% |
|
|
|
% |
| ||||||||||
|
| |||||||||||||||||||||
|
MSCI
Emerging Markets Index (net dividends) |
- |
% |
|
|
- |
% |
|
|
|
% |
| ||||||||||
| |||||||||||||||||||||
Investment Advisor/Portfolio Management
Dimensional Fund Advisors LP serves as the investment advisor for the Emerging Markets Core Equity Portfolio. Dimensional Fund Advisors Ltd. and DFA Australia Limited serve as the sub-advisors for the Portfolio. The following individuals are responsible for leading the day-to-day management of the Portfolio:
|
• |
Jed S. Fogdall, Global Head of Portfolio Management, Chairman of the Investment Committee, Vice President and Senior Portfolio Manager of the Advisor, has been a portfolio manager of the Portfolio since 2010. | |||||||||||||||||||||||||||||||||||||||||||||||||||||||||||||||||||||||||||||||||||||||||||||||||
|
• |
Allen Pu, Deputy Head of Portfolio Management, North America, member of the Investment Committee, Vice President and Senior Portfolio Manager of the Advisor, has been a portfolio manager of the Portfolio since 2015. | |||||||||||||||||||||||||||||||||||||||||||||||||||||||||||||||||||||||||||||||||||||||||||||||||
|
• |
Mary T. Phillips, Deputy Head of Portfolio Management, North America, member of the Investment Committee, Vice President and Senior Portfolio Manager of the Advisor, has been a portfolio manager of the Portfolio since 2017. | |||||||||||||||||||||||||||||||||||||||||||||||||||||||||||||||||||||||||||||||||||||||||||||||||
136
|
• |
William B. Collins-Dean, Vice President and Senior Portfolio Manager of the Advisor, has been a portfolio manager of the Portfolio since 2019. |
Purchase and Redemption of Fund Shares
Investors may purchase or redeem shares of the Emerging Markets Core Equity Portfolio on each day that the NYSE is scheduled to be open for business by first contacting the Portfolio’s transfer agent at (888) 576-1167. Shareholders that invest in the Portfolio through a financial intermediary should contact their financial intermediary regarding purchase and redemption procedures. The Portfolio generally is available for investment only by institutional clients, clients of registered investment advisors, clients of financial institutions and a limited number of certain other investors as approved from time to time by the Advisor. All investments are subject to approval of the Advisor.
Tax Information
The dividends and distributions you receive from the Emerging Markets Core Equity Portfolio are taxable and generally will be taxed as ordinary income, capital gains, or some combination of both, unless you are investing through a tax-advantaged arrangement, such as a 401(k) plan or an individual retirement account, in which case distributions may be taxed as ordinary income when withdrawn from the plan or account.
Payments to Financial Intermediaries
If you purchase the Emerging Markets Core Equity Portfolio through a broker-dealer or other financial intermediary (such as a bank), the Portfolio and its related companies may pay the intermediary for the sale of the Portfolio shares and/or related services. These payments may create a conflict of interest by influencing the financial intermediary to recommend the Portfolio over another investment. Ask your financial advisor or visit your financial intermediary’s website for more information.
137
The investment objective of the Emerging Markets ex China Core Equity Portfolio (the “Portfolio”) is to achieve long-term capital appreciation.
This table describes the fees and expenses you may pay if you buy, hold or sell shares of the Emerging Markets ex China Core Equity Portfolio. You may pay other fees, such as brokerage commissions and other fees to financial intermediaries, which are not reflected in the table and example below.
year as a percentage of the value of
your investment)
|
|
|
|
|
Management Fee |
| |
|
| ||
|
Other Expenses |
| |
|
| ||
|
Total Annual Fund Operating Expenses |
| |
|
| ||
|
Fee Waiver and/or Expense Reimbursement* |
| |
|
| ||
|
Total Annual Fund Operating Expenses After Fee Waiver and/or Expense Reimbursement |
| |
|
| ||
|
* |
| |||||||||||||||||||||||||||||||||||||||||||||||||||||||||||||||||||||||||||||||||||||||||||||||||
This Example is meant to help you compare the cost of investing in the Emerging Markets ex China Core Equity Portfolio with the cost of investing in other mutual funds. The Example assumes that you invest $10,000 in the Portfolio for the time periods indicated. The Example also assumes that your investment has a 5% return each year and that the Portfolio’s operating expenses remain the same. The costs for the Portfolio reflect the net expenses of the Portfolio that result from the contractual expense waiver in the first year only. Although your actual costs may be higher or lower, based on these assumptions, your costs would be:
|
|
|
|
|
|
|
|
|
1 Year |
3 Years |
5 Years |
10 Years | |||
|
$ |
$ |
$ |
$ | |||
|
| ||||||
The Emerging Markets ex China
Core Equity Portfolio pays transaction costs, such as commissions, when it buys
and sells securities (or “turns over” its portfolio). A higher portfolio
turnover may indicate higher transaction costs and may result in higher taxes
when Portfolio shares are held in a taxable account. These costs, which are not
reflected in Annual Fund Operating Expenses or in the Example, affect the
Portfolio’s performance. During the period November 15, 2021 to October 31, 2022
the Portfolio’s turnover rate was
138
To achieve the Emerging Markets ex China Core Equity Portfolio’s investment objective, the Advisor implements an integrated investment approach that combines research, portfolio design, portfolio management, and trading functions. As further described below, the Portfolio’s design emphasizes long-term drivers of expected returns identified by the Advisor’s research, while balancing risk through broad diversification across companies and sectors. The Advisor’s portfolio management and trading processes further balance those long-term drivers of expected returns with shorter-term drivers of expected returns and trading costs.
The Emerging Markets ex China Core Equity Portfolio is designed to purchase a broad and diverse group of equity securities associated with emerging markets authorized for investment by the Advisor’s Investment Committee (“Approved Markets”), which may include frontier markets (emerging market countries in an earlier stage of development) but which does not include China. The Portfolio will invest in companies of all sizes, with increased exposure to smaller capitalization, lower relative price, and higher profitability companies. The Portfolio’s increased exposure to smaller capitalization, lower relative price, and higher profitability companies may be achieved by decreasing the allocation of the Portfolio’s assets to larger capitalization, higher relative price, or lower profitability companies. An equity issuer is considered to have a high relative price (i.e., a growth stock) primarily because it has a high price in relation to its book value. An equity issuer is considered to have a low relative price (i.e., a value stock) primarily because it has a low price in relation to its book value. In assessing relative price, the Advisor may consider additional factors such as price to cash flow or price to earnings ratios. An equity issuer is considered to have high profitability because it has high earnings or profits from operations in relation to its book value or assets. The criteria the Advisor uses for assessing relative price and profitability are subject to change from time to time.
As a non-fundamental policy, under normal circumstances, the Emerging Markets ex China Core Equity Portfolio will invest at least 80% of its net assets in emerging markets equity investments that are defined in the Prospectus as Approved Market securities. In determining which countries are eligible Approved Markets for the Portfolio, the Advisor may consider various factors, including, without limitation, the data, analysis, and classification of countries published or disseminated by the International Bank for Reconstruction and Development (commonly known as the World Bank), the International Finance Corporation, FTSE International, and MSCI.
The Advisor may also increase or reduce the Emerging Markets ex China Core Equity Portfolio’s exposure to an eligible company, or exclude a company, based on shorter-term considerations, such as a company’s price momentum and investment characteristics. In assessing a company’s investment characteristics, the Advisor considers ratios such as recent changes in assets divided by total assets. The criteria the Advisor uses for assessing a company’s investment characteristics are subject to change from time to time. In addition, the Advisor seeks to reduce trading costs using a flexible trading approach that looks for opportunities to participate in the available market liquidity, while managing turnover and explicit transaction costs.
The Emerging Markets ex China Core Equity Portfolio may gain exposure to companies in Approved Markets by purchasing equity securities in the form of depositary receipts, which may be listed or traded outside the issuer’s domicile country. The Portfolio may purchase or sell futures contracts and options on futures contracts for Approved Market or other equity market securities and indices, including those of the United States, to increase or decrease equity market exposure based on actual or expected cash inflows to or outflows from the Portfolio. Because many of the Portfolio’s investments may be denominated in foreign currencies, the Portfolio may enter into foreign currency exchange transactions, including foreign currency forward contracts, in connection with the settlement of foreign securities or to transfer cash balances from one currency to another currency.
The Portfolio may lend its portfolio securities to generate additional income.
139
Equity Market Risk: Even a long-term investment approach cannot guarantee a profit. Economic, market, political, and issuer-specific conditions and events will cause the value of equity securities, and the Portfolio that owns them, to rise or fall. Stock markets tend to move in cycles, with periods of rising prices and periods of falling prices.
Foreign Securities and Currencies Risk: Foreign securities prices may decline or fluctuate because of: (a) economic or political actions of foreign governments, and/or (b) less regulated or liquid securities markets. Investors holding these securities may also be exposed to foreign currency risk (the possibility that foreign currency will fluctuate in value against the U.S. dollar or that a foreign government will convert, or be forced to convert, its currency to another currency, changing its value against the U.S. dollar). The Portfolio does not hedge foreign currency risk.
Depositary receipts are generally subject to the same risks as the foreign securities that they evidence or into which they may be converted. In addition, the underlying issuers of certain depositary receipts, particularly unsponsored or unregistered depositary receipts, are under no obligation to distribute shareholder communications to the holders of such receipts, or to pass through to them any voting rights with respect to the deposited securities. Depositary receipts that are not sponsored by the issuer may be less liquid and there may be less readily available public information about the issuer.
Small and Mid-Cap Company Risk: Securities of small and mid-cap companies are often less liquid than those of large companies and this could make it difficult to sell a small or mid-cap company security at a desired time or price. As a result, small and mid-cap company stocks may fluctuate relatively more in price. In general, small and mid- capitalization companies are also more vulnerable than larger companies to adverse business or economic developments and they may have more limited resources.
Emerging Markets Risk: Numerous emerging market countries have a history of, and continue to experience serious, and potentially continuing, economic and political problems. Stock markets in many emerging market countries are relatively small, expensive to trade in and generally have higher risks than those in developed markets. Securities in emerging markets also may be less liquid than those in developed markets and foreigners are often limited in their ability to invest in, and withdraw assets from, these markets. Additional restrictions may be imposed under other conditions. Frontier market countries generally have smaller economies or less developed capital markets and, as a result, the risks of investing in emerging market countries are magnified in frontier market countries.
Profitability Investment Risk: High relative profitability stocks may perform differently from the market as a whole and an investment strategy purchasing these securities may cause the Portfolio to at times underperform equity funds that use other investment strategies.
Value Investment Risk: Value stocks may perform differently from the market as a whole and an investment strategy purchasing these securities may cause the Portfolio to at times underperform equity funds that use other investment strategies. Value stocks can react differently to political, economic, and industry developments than the market as a whole and other types of stocks. Value stocks also may underperform the market for long periods of time.
Derivatives Risk: Derivatives are instruments, such as futures and options thereon, and foreign currency forward contracts, whose value is derived from that of other assets, rates or indices. The use of derivatives for non-hedging purposes may be considered to carry more risk than other types of investments. When the Portfolio uses derivatives, the Portfolio will be directly exposed to the risks of those derivatives. Derivative instruments are subject to a number of risks including counterparty, settlement, liquidity, interest rate, market, credit and management risks, as well as the risk of improper valuation. Changes in the value of a derivative may not correlate perfectly with the underlying asset, rate or index, and the Portfolio could lose more than the principal amount invested.
140
Securities Lending Risk: Securities lending involves the risk that the borrower may fail to return the securities in a timely manner or at all. As a result, the Portfolio may lose money and there may be a delay in recovering the loaned securities. The Portfolio could also lose money if it does not recover the securities and/or the value of the collateral falls, including the value of investments made with cash collateral. Securities lending also may have certain adverse tax consequences.
Operational Risk: Operational risks include human error, changes in personnel, system changes, faults in communication, and failures in systems, technology, or processes. Various operational events or circumstances are outside the Advisor’s control, including instances at third parties. The Portfolio and the Advisor seek to reduce these operational risks through controls and procedures. However, these measures do not address every possible risk and may be inadequate to address these risks.
Cyber Security Risk: The Portfolio’s and its service providers’ use of internet, technology and information systems may expose the Portfolio to potential risks linked to cyber security breaches of those technological or information systems. Cyber security breaches, amongst other things, could allow an unauthorized party to gain access to proprietary information, customer data, or fund assets, or cause the Portfolio and/or its service providers to suffer data corruption or lose operational functionality.
141
January 2022-December 2022
|
|
|
|
|
|
|
Periods ending December 31, 2022
|
|
|
|
| |||||||||||
|
1 Year |
Since
| |||||||||||||
|
Emerging Markets ex China Core Equity Portfolio |
|
|
| |||||||||||
|
| ||||||||||||||
|
Return Before Taxes |
|
- |
% |
|
|
- |
% |
| ||||||
|
| ||||||||||||||
|
Return After Taxes on Distributions |
|
- |
% |
|
|
- |
% |
| ||||||
|
| ||||||||||||||
|
Return After Taxes on Distributions and Sale of Portfolio Shares |
|
- |
% |
|
|
- |
% |
| ||||||
|
| ||||||||||||||
|
MSCI Emerging Markets
ex China Index (net dividends) |
|
- |
% |
|
|
- |
% |
| ||||||
| ||||||||||||||
Investment Advisor/Portfolio Management
Dimensional Fund Advisors LP serves as the investment advisor for the Emerging Markets ex China Core Equity Portfolio. Dimensional Fund Advisors Ltd. and DFA Australia Limited serve as the sub-advisors for the Portfolio. The following individuals are responsible for leading the day-to-day management of the Portfolio:
|
• |
William B. Collins-Dean, Vice President and Senior Portfolio Manager of the Advisor, has been a portfolio manager of the Portfolio since inception (2021). | ||
|
• |
Jed S. Fogdall, Global Head of Portfolio Management, Chairman of the Investment Committee, Vice President and Senior Portfolio Manager of the Advisor, has been a portfolio manager of the Portfolio since inception (2021). | ||
|
• |
Mary T. Phillips, Deputy Head of Portfolio Management, North America, member of the Investment Committee, Vice President and Senior Portfolio Manager of the Advisor, has been a portfolio manager of the Portfolio since inception (2021). |
142
|
• |
Allen Pu, Deputy Head of Portfolio Management, North America, member of the Investment Committee, Vice President and Senior Portfolio Manager of the Advisor, has been a portfolio manager of the Portfolio since inception (2021). |
Purchase and Redemption of Fund Shares
Investors may purchase or redeem shares of the Emerging Markets ex China Core Equity Portfolio on each day that the New York Stock Exchange is scheduled to be open for business by first contacting the Portfolio’s transfer agent at (888) 576-1167. Shareholders that invest in the Portfolio through a financial intermediary should contact their financial intermediary regarding purchase and redemption procedures. The Portfolio generally is available for investment only by institutional clients, clients of registered investment advisors, clients of financial institutions and a limited number of certain other investors as approved from time to time by the Advisor. All investments are subject to approval of the Advisor.
Tax Information
The dividends and distributions you receive from the Emerging Markets ex China Core Equity Portfolio are taxable and generally will be taxed as ordinary income, capital gains, or some combination of both, unless you are investing through a tax-advantaged arrangement, such as a 401(k) plan or an individual retirement account, in which case distributions may be taxed as ordinary income when withdrawn from the plan or account.
Payments to Financial Intermediaries
If you purchase the Emerging Markets ex China Core Equity Portfolio through a broker-dealer or other financial intermediary (such as a bank), the Portfolio and its related companies may pay the intermediary for the sale of the Portfolio shares and/or related services. These payments may create a conflict of interest by influencing the financial intermediary to recommend the Portfolio over another investment. Ask your financial advisor or visit your financial intermediary’s website for more information.
143
Additional Information on Investment Objectives and Policies
The two registrants described in this Prospectus offer a variety of investment portfolios. Each of the registrants’ Portfolios has its own investment objective and policies, and is the equivalent of a separate mutual fund. The DFA International Value Portfolio is offered by Dimensional Investment Group Inc. The other Portfolios contained in this Prospectus are offered by DFA Investment Dimensions Group Inc. The Portfolios described in this Prospectus are designed for long-term investors. The DFA International Value Portfolio and Emerging Markets Value Portfolio also offer one additional class of shares, Class R2 shares.
Investment Terms Used in the Prospectus
Below are the definitions of some terms that the Advisor uses to describe the investment strategies for certain Portfolios.
Free Float generally describes the number of publicly traded shares of a company.
Price Momentum generally describes the past performance of a stock relative to other stocks.
Trading Strategies generally refers to the ability to execute purchases and sales of stocks in a cost-effective manner.
Profitability generally measures a company’s profit in relation to its book value or assets.
Investments in Underlying Funds
APPROVED MARKETS
As of the date of this Prospectus, the countries listed in the following tables for each Feeder Portfolio and its corresponding Master Fund (an “International Master Fund”) and each non-Feeder Portfolio are designated as “Approved Markets” for which the International Master Fund or Portfolio is authorized to invest. The Advisor will determine in its discretion when and whether to invest in countries that have been authorized as Approved Markets, depending on a number of factors, including, but not limited to, asset growth in a Master Fund/Portfolio, constraints imposed within Approved Markets, and other characteristics of each country’s markets. The Investment Committee of the Advisor also may designate other countries as Approved Markets for investment in the future, in addition to the countries listed in the tables. Although the Advisor does not intend to purchase securities not associated with an Approved Market, an International Master Fund or Portfolio may acquire such securities in connection with corporate actions or other reorganizations or transactions with respect to securities that are held by the Master Fund or Portfolio from time to time. Also, an International Master Fund or Portfolio may continue to hold investments in countries that are not currently designated as Approved Markets, but had been authorized for investment in the past, and may reinvest distributions received in connection with such existing investments in such previously Approved Markets. Emerging Markets approved for investment may include countries in an earlier stage of development that are sometimes referred to as frontier markets.
144
Developed Markets
|
|
|
|
|
|
|
|
|
|
|
|
|
|
|
|
|
|
|
|
|
|
|
|
|
Countries |
Large
Cap |
DFA |
International |
Japanese |
Asia
Pacific |
Canadian |
U.K.
Small |
Continental |
DFA |
International |
International | |||||||||||
|
Australia |
Invests |
Invests |
Invests |
— |
Invests |
— |
— |
— |
Invests |
Invests |
Invests | |||||||||||
|
| ||||||||||||||||||||||
|
Austria |
Invests |
Invests |
Invests |
— |
— |
— |
— |
Invests |
Invests |
Invests |
Invests | |||||||||||
|
| ||||||||||||||||||||||
|
Belgium |
Invests |
Invests |
Invests |
— |
— |
— |
— |
Invests |
Invests |
Invests |
Invests | |||||||||||
|
| ||||||||||||||||||||||
|
Canada |
Invests |
Invests |
Invests |
— |
— |
Invests |
— |
— |
Invests |
Invests |
Invests | |||||||||||
|
| ||||||||||||||||||||||
|
Denmark |
Invests |
Invests |
Invests |
— |
— |
— |
— |
Invests |
Invests |
Invests |
Invests | |||||||||||
|
| ||||||||||||||||||||||
|
Finland |
Invests |
Invests |
Invests |
— |
— |
— |
— |
Invests |
Invests |
Invests |
Invests | |||||||||||
|
| ||||||||||||||||||||||
|
France |
Invests |
Invests |
Invests |
— |
— |
— |
— |
Invests |
Invests |
Invests |
Invests | |||||||||||
|
| ||||||||||||||||||||||
|
Germany |
Invests |
Invests |
Invests |
— |
— |
— |
— |
Invests |
Invests |
Invests |
Invests | |||||||||||
|
| ||||||||||||||||||||||
|
Hong Kong |
Invests |
Invests |
Invests |
— |
Invests |
— |
— |
— |
Invests |
Invests |
Invests | |||||||||||
|
| ||||||||||||||||||||||
|
Ireland |
Invests |
Invests |
Invests |
— |
— |
— |
— |
Invests |
Invests |
Invests |
Invests | |||||||||||
|
| ||||||||||||||||||||||
|
Israel |
Invests |
Invests |
Invests |
— |
— |
— |
— |
Invests |
Invests |
Invests |
Invests | |||||||||||
|
| ||||||||||||||||||||||
|
Italy |
Invests |
Invests |
Invests |
— |
— |
— |
— |
Invests |
Invests |
Invests |
Invests | |||||||||||
|
| ||||||||||||||||||||||
|
Japan |
Invests |
Invests |
Invests |
Invests |
— |
— |
— |
— |
Invests |
Invests |
Invests | |||||||||||
|
| ||||||||||||||||||||||
|
Netherlands |
Invests |
Invests |
Invests |
— |
— |
— |
— |
Invests |
Invests |
Invests |
Invests | |||||||||||
|
| ||||||||||||||||||||||
|
New Zealand |
Invests |
Invests |
Invests |
— |
Invests |
— |
— |
— |
Invests |
Invests |
Invests | |||||||||||
|
| ||||||||||||||||||||||
|
Norway |
Invests |
Invests |
Invests |
— |
— |
— |
— |
Invests |
Invests |
Invests |
Invests | |||||||||||
|
| ||||||||||||||||||||||
|
Portugal |
Invests |
Invests |
Invests |
— |
— |
— |
— |
Invests |
Invests |
Invests |
Invests | |||||||||||
|
| ||||||||||||||||||||||
|
Singapore |
Invests |
Invests |
Invests |
— |
Invests |
— |
— |
— |
Invests |
Invests |
Invests | |||||||||||
|
| ||||||||||||||||||||||
|
Spain |
Invests |
Invests |
Invests |
— |
— |
— |
— |
Invests |
Invests |
Invests |
Invests | |||||||||||
|
| ||||||||||||||||||||||
|
Sweden |
Invests |
Invests |
Invests |
— |
— |
— |
— |
Invests |
Invests |
Invests |
Invests | |||||||||||
|
| ||||||||||||||||||||||
|
Switzerland |
Invests |
Invests |
Invests |
— |
— |
— |
— |
Invests |
Invests |
Invests |
Invests | |||||||||||
|
| ||||||||||||||||||||||
|
United Kingdom |
Invests |
Invests |
Invests |
— |
— |
— |
Invests |
— |
Invests |
Invests |
Invests | |||||||||||
|
| ||||||||||||||||||||||
|
United States |
— |
— |
— |
— |
— |
— |
— |
— |
— |
— |
— | |||||||||||
|
| ||||||||||||||||||||||
145
Emerging Markets
|
|
|
|
|
|
|
|
|
|
|
|
|
|
|
Countries |
Emerging |
Emerging |
Emerging |
Emerging |
Emerging |
Emerging | ||||||
|
Brazil |
Invests |
Invests |
Invests |
Invests |
Invests |
Invests | ||||||
|
| ||||||||||||
|
Chile |
Invests |
Invests |
Invests |
Invests |
Invests |
Invests | ||||||
|
| ||||||||||||
|
China |
Invests |
Invests |
Invests |
Invests |
— |
Invests | ||||||
|
| ||||||||||||
|
Colombia |
Invests |
Invests |
Invests |
Invests |
Invests |
Invests | ||||||
|
| ||||||||||||
|
Czech Republic |
Invests |
Invests |
— |
Invests |
Invests |
— | ||||||
|
| ||||||||||||
|
Egypt |
Invests |
— |
— |
Invests |
Invests |
— | ||||||
|
| ||||||||||||
|
Greece |
Invests |
Invests |
Invests |
Invests |
Invests |
Invests | ||||||
|
| ||||||||||||
|
Hungary |
Invests |
Invests |
Invests |
Invests |
Invests |
Invests | ||||||
|
| ||||||||||||
|
India |
Invests |
Invests |
Invests |
Invests |
Invests |
Invests | ||||||
|
| ||||||||||||
|
Indonesia |
Invests |
Invests |
Invests |
Invests |
Invests |
Invests | ||||||
|
| ||||||||||||
|
Kuwait |
Invests |
Invests |
Invests |
Invests |
Invests |
Invests | ||||||
|
| ||||||||||||
|
Malaysia |
Invests |
Invests |
Invests |
Invests |
Invests |
Invests | ||||||
|
| ||||||||||||
|
Mexico |
Invests |
Invests |
Invests |
Invests |
Invests |
Invests | ||||||
|
| ||||||||||||
|
Peru |
Invests |
— |
— |
Invests |
Invests |
— | ||||||
|
| ||||||||||||
|
Philippines |
Invests |
Invests |
Invests |
Invests |
Invests |
Invests | ||||||
|
| ||||||||||||
|
Poland |
Invests |
Invests |
Invests |
Invests |
Invests |
Invests | ||||||
|
| ||||||||||||
|
Qatar |
Invests |
Invests |
Invests |
Invests |
Invests |
Invests | ||||||
|
| ||||||||||||
|
Saudi Arabia |
Invests |
Invests |
Invests |
Invests |
Invests |
Invests | ||||||
|
| ||||||||||||
|
South Africa |
Invests |
Invests |
Invests |
Invests |
Invests |
Invests | ||||||
|
| ||||||||||||
|
South Korea |
Invests |
Invests |
Invests |
Invests |
Invests |
Invests | ||||||
|
| ||||||||||||
|
Taiwan |
Invests |
Invests |
Invests |
Invests |
Invests |
Invests | ||||||
|
| ||||||||||||
|
Thailand |
Invests |
Invests |
Invests |
Invests |
Invests |
Invests | ||||||
|
| ||||||||||||
|
Turkey |
Invests |
Invests |
Invests |
Invests |
Invests |
Invests | ||||||
|
| ||||||||||||
|
United Arab Emirates |
Invests |
Invests |
Invests |
Invests |
Invests |
Invests | ||||||
|
| ||||||||||||
146
Developed and Emerging Markets
|
|
|
|
|
|
|
|
|
|
|
|
|
Countries |
DFA |
DFA
Global |
World
ex |
World
ex |
World | |||||
|
DEVELOPED MARKETS |
|
|
|
|
|
|
|
|
|
|
|
| ||||||||||
|
Australia |
Invests |
Invests |
Invests |
Invests |
Invests | |||||
|
| ||||||||||
|
Austria |
— |
— |
Invests |
Invests |
Invests | |||||
|
| ||||||||||
|
Belgium |
Invests |
Invests |
Invests |
Invests |
Invests | |||||
|
| ||||||||||
|
Canada |
Invests |
Invests |
Invests |
Invests |
Invests | |||||
|
| ||||||||||
|
Denmark |
— |
— |
Invests |
Invests |
Invests | |||||
|
| ||||||||||
|
Finland |
— |
— |
Invests |
Invests |
Invests | |||||
|
| ||||||||||
|
France |
Invests |
Invests |
Invests |
Invests |
Invests | |||||
|
| ||||||||||
|
Germany |
Invests |
Invests |
Invests |
Invests |
Invests | |||||
|
| ||||||||||
|
Hong Kong |
Invests |
Invests |
Invests |
Invests |
Invests | |||||
|
| ||||||||||
|
Ireland |
Invests |
Invests |
Invests |
Invests |
Invests | |||||
|
| ||||||||||
|
Israel |
— |
— |
Invests |
Invests |
Invests | |||||
|
| ||||||||||
|
Italy |
Invests |
Invests |
Invests |
Invests |
Invests | |||||
|
| ||||||||||
|
Japan |
Invests |
Invests |
Invests |
Invests |
Invests | |||||
|
| ||||||||||
|
Netherlands |
Invests |
Invests |
Invests |
Invests |
Invests | |||||
|
| ||||||||||
|
New Zealand |
Invests |
Invests |
Invests |
Invests |
Invests | |||||
|
| ||||||||||
|
Norway |
— |
— |
Invests |
Invests |
Invests | |||||
|
| ||||||||||
|
Portugal |
— |
— |
Invests |
Invests |
Invests | |||||
|
| ||||||||||
|
Singapore |
Invests |
Invests |
Invests |
Invests |
Invests | |||||
|
| ||||||||||
|
Spain |
Invests |
Invests |
Invests |
Invests |
Invests | |||||
|
| ||||||||||
|
Sweden |
— |
— |
Invests |
Invests |
Invests | |||||
|
| ||||||||||
|
Switzerland |
— |
— |
Invests |
Invests |
Invests | |||||
|
| ||||||||||
|
United Kingdom |
Invests |
Invests |
Invests |
Invests |
Invests | |||||
|
| ||||||||||
|
United States |
— |
Invests |
— |
— |
Invests | |||||
|
| ||||||||||
|
EMERGING MARKETS |
|
|
|
|
|
|
|
|
|
|
|
| ||||||||||
|
Brazil |
— |
— |
Invests |
Invests |
Invests | |||||
|
| ||||||||||
|
Chile |
— |
— |
Invests |
Invests |
Invests | |||||
|
| ||||||||||
|
China |
Invests |
Invests |
Invests |
Invests |
Invests | |||||
|
| ||||||||||
|
Colombia |
— |
— |
Invests |
Invests |
Invests | |||||
|
| ||||||||||
|
Czech Republic |
— |
— |
Invests |
Invests |
Invests | |||||
|
| ||||||||||
|
Egypt |
— |
— |
— |
Invests |
Invests | |||||
|
| ||||||||||
|
Greece |
Invests |
Invests |
Invests |
Invests |
Invests | |||||
|
| ||||||||||
|
Hungary |
— |
— |
Invests |
Invests |
Invests | |||||
|
| ||||||||||
|
India |
Invests |
Invests |
Invests |
Invests |
Invests | |||||
|
| ||||||||||
|
Indonesia |
— |
— |
Invests |
Invests |
Invests | |||||
|
| ||||||||||
|
Kuwait |
— |
— |
Invests |
Invests |
Invests | |||||
|
| ||||||||||
|
Malaysia |
Invests |
Invests |
Invests |
Invests |
Invests | |||||
|
| ||||||||||
|
Mexico |
Invests |
Invests |
Invests |
Invests |
Invests | |||||
|
| ||||||||||
|
Peru |
— |
— |
— |
Invests |
Invests | |||||
|
| ||||||||||
|
|
|
|
|
|
|
|
|
|
|
|
147
|
|
|
|
|
|
|
|
|
|
|
|
|
Countries |
DFA |
DFA
Global |
World
ex |
World
ex |
World | |||||
|
Philippines |
Invests |
Invests |
Invests |
Invests |
Invests | |||||
|
| ||||||||||
|
Poland |
— |
— |
Invests |
Invests |
Invests | |||||
|
| ||||||||||
|
Qatar |
— |
— |
Invests |
Invests |
Invests | |||||
|
| ||||||||||
|
Saudi Arabia |
Invests |
Invests |
Invests |
Invests |
Invests | |||||
|
| ||||||||||
|
South Africa |
Invests |
Invests |
Invests |
Invests |
Invests | |||||
|
| ||||||||||
|
South Korea |
Invests |
Invests |
Invests |
Invests |
Invests | |||||
|
| ||||||||||
|
Taiwan |
Invests |
Invests |
Invests |
Invests |
Invests | |||||
|
| ||||||||||
|
Thailand |
Invests |
Invests |
Invests |
Invests |
Invests | |||||
|
| ||||||||||
|
Turkey |
Invests |
Invests |
Invests |
Invests |
Invests | |||||
|
| ||||||||||
|
United Arab Emirates |
— |
— |
Invests |
Invests |
Invests | |||||
|
| ||||||||||
The International Master Funds and Portfolios invest in securities of Approved Markets (as identified in the tables above) listed on bona fide securities exchanges or traded on the over-the-counter markets. These exchanges or over-the-counter markets may be either within or outside the issuer’s domicile country. For example, the securities may be listed or traded in the form of European Depositary Receipts (“EDRs”), Global Depositary Receipts (“GDRs”), American Depositary Receipts (“ADRs”), or other types of depositary receipts (including non-voting depositary receipts) or may be listed on bona fide securities exchanges in more than one country. An International Master Fund or Portfolio will consider for purchase securities that are associated with an Approved Market (“Approved Market Securities”). Approved Market Securities are: (a) securities of companies that are organized under the laws of, or maintain their principal place of business in, an Approved Market; (b) securities for which the principal trading market is in an Approved Market; (c) securities issued or guaranteed by the government of an Approved Market, its agencies or instrumentalities, or the central bank of such country or territory; (d) securities of companies that derive at least 50% of their revenues or profits from goods produced or sold, investments made, or services performed in Approved Markets or have at least 50% of their assets in Approved Markets; (e) securities included in the Portfolio’s benchmark index, which tracks Approved Markets; or (f) depositary shares of companies associated with Approved Markets under the criteria above. Securities of Approved Markets may include securities of companies that have characteristics and business relationships common to companies in other countries or regions. As a result, the value of the securities of such companies may reflect economic and market forces in such other countries or regions as well as in the Approved Markets. The Advisor, however, will select only those companies that, in its view, have sufficiently strong exposure to economic and market forces in Approved Markets that satisfy the criteria described above. An International Master Fund or Portfolio also may obtain exposure to Approved Market Securities by investing in derivative instruments that derive their value from Approved Market Securities, or by investing in securities of pooled investment vehicles that invest at least 80% of their assets in Approved Market Securities.
Large Cap International Portfolio
The investment objective of the Large Cap International Portfolio is to achieve long-term capital appreciation by investing in securities of non-U.S. large companies. The Advisor may consider a company’s size, relative price, and/or profitability relative to other eligible companies when making investment decisions for the Large Cap International Portfolio. An equity issuer is considered to have a low relative price (i.e., a value stock) primarily because it has a low price in relation to its book value. In assessing relative price, the Advisor may consider additional factors such as price to cash flow or price to earnings ratios. An equity issuer is considered to have high profitability because it has high earnings or profits from operations in relation to its book value or assets. The criteria the Advisor uses for assessing relative price and profitability are subject to change from time to time. The Advisor may also adjust the representation in the Large Cap International Portfolio of an eligible company, or exclude a company, after considering such factors as free float, price momentum, trading strategies, liquidity, size, relative price, profitability, and other factors that the Advisor determines to be appropriate. The weightings
148
of certain companies and countries in the Large Cap International Portfolio may vary from their weightings in international indices, such as those published by FTSE International, and MSCI.
Under normal market conditions, the Large Cap International Portfolio intends to invest at least 40% of its assets in three or more non-U.S. countries by investing in securities of companies associated with such countries. The Large Cap International Portfolio invests its assets in securities of companies associated with Approved Markets (For a description of the securities and countries approved for investment, see “Approved Markets”).
In the countries or regions authorized for investment, the Advisor first ranks eligible companies listed on selected exchanges based on the companies’ market capitalizations. The Advisor then determines the universe of eligible securities by defining the minimum market capitalization of a large company that may be purchased by the Large Cap International Portfolio with respect to each country or region. Based on market capitalization data as of December 31, 2022, for the Large Cap International Portfolio, the market capitalization of a large company in any country or region in which the Large Cap International Portfolio invests would be $1,325 million or above. This threshold will vary by country or region. For example, based on market capitalization data as of December 31, 2022, the Advisor would consider a large company in the European Economic and Monetary Union (the “EMU”) to have a market capitalization of at least $6,125 million, a large company in Norway to have a market capitalization of at least $1,765 million, and a large company in Switzerland to have a market capitalization of at least $8,202 million. These thresholds will change due to market conditions.
The Large Cap International Portfolio does not seek current income as an investment objective and investments will not be based upon an issuer’s dividend payment policy or record. However, many of the companies whose securities will be included in the Portfolio do pay dividends. It is anticipated, therefore, that the Large Cap International Portfolio will receive dividend income.
The Large Cap International Portfolio may invest in exchange-traded funds (ETFs) for the purpose of gaining exposure to the equity markets while maintaining liquidity. In addition to money market instruments and other short-term investments, the Large Cap International Portfolio may invest in affiliated and unaffiliated registered and unregistered money market funds to manage the Portfolio’s cash pending investment in other securities or to maintain liquidity for the payment of redemptions or other purposes. Investments in ETFs and money market funds may involve a duplication of certain fees and expenses.
DFA International Value Portfolio
The investment objective of the DFA International Value Portfolio is to achieve long-term capital appreciation. The DFA International Value Portfolio invests substantially all of its assets in The DFA International Value Series of the Trust (the “International Value Series”), which has the same investment objective and policies as the Portfolio. The International Value Series seeks to achieve its objective by purchasing securities of large non-U.S. companies that the Advisor determines to be value stocks at the time of purchase. The Advisor may overweight certain stocks, including smaller companies, lower relative price stocks, and/or higher profitability stocks within the large-cap value segment of developed ex U.S. markets. An equity issuer is considered to have a low relative price (i.e., a value stock) primarily because it has a low price in relation to its book value. In assessing relative price, the Advisor may consider additional factors such as price to cash flow or price to earnings ratios. The Advisor may also adjust the representation in the International Value Series of an eligible company, or exclude a company, after considering such factors as free float, price momentum, trading strategies, liquidity, size, relative price, profitability, and other factors that the Advisor determines to be appropriate. An equity issuer is considered to have high profitability because it has high earnings or profits from operations in relation to its book value or assets. The criteria the Advisor uses for relative price and profitability are subject to change from time to time.
Under normal market conditions, the International Value Series intends to invest at least 40% of its assets in three or more non-U.S. countries by investing in securities of companies associated with such countries. The International Value Series invests its assets in securities of companies associated with Approved Markets (For a description of the securities and countries approved for investment, see “Approved Markets”).
In the countries or regions authorized for investment, the Advisor first ranks eligible companies listed on selected exchanges based on the companies’ market capitalizations. The Advisor then determines the universe of eligible
149
securities by defining the minimum market capitalization of a large company that may be purchased by the International Value Series with respect to each country or region. Based on market capitalization data as of December 31, 2022, for the DFA International Value Series, the market capitalization of a large company in any country or region in which the DFA International Value Series invests would be $1,325 million or above. This threshold will vary by country or region. For example, based on market capitalization data as of December 31, 2022, the Advisor considered a large company in the EMU to have a market capitalization of at least $6,125 million, a large company in Norway to have a market capitalization of at least $1,765 million, and a large company in Switzerland to have a market capitalization of at least $8,202 million. These thresholds will change due to market conditions.
The International Value Series does not seek current income as an investment objective and investments will not be based upon an issuer’s dividend payment policy or record. However, many of the companies whose securities will be included in the International Value Series do pay dividends. It is anticipated, therefore, that the International Value Series will receive dividend income.
The International Value Series may invest in exchange-traded funds (ETFs) for the purpose of gaining exposure to the equity markets while maintaining liquidity. In addition to money market instruments and other short-term investments, the International Value Series may invest in affiliated and unaffiliated registered and unregistered money market funds to manage cash pending investment in other securities or to maintain liquidity for the payment of redemptions or other purposes. Investments in ETFs and money market funds may involve a duplication of certain fees and expenses.
International Core Equity Portfolio
The investment objective of the International Core Equity Portfolio is to achieve long-term capital appreciation. The International Core Equity Portfolio seeks to achieve its investment objective by purchasing a broad and diverse group of securities of non-U.S. companies. The Portfolio invests in companies of all sizes, with increased exposure to smaller capitalization, lower relative price and higher profitability companies relative to the International Universe. For purposes of the International Core Equity Portfolio, the Advisor defines the International Universe as a market capitalization weighted set of non-U.S. companies in developed markets that have been authorized for investment by the Advisor’s Investment Committee (International Universe). See “Approved Markets.” Market capitalization weighted means that a company’s weighting in the International Universe is proportional to that company’s actual market capitalization compared to the total market capitalization of all eligible companies. The higher the company’s relative market capitalization, the greater its representation. The increased exposure to smaller capitalization, lower relative price and higher profitability companies may be achieved by decreasing the allocation of the International Core Equity Portfolio’s assets to larger capitalization, higher relative price or lower profitability companies relative to their weight in the International Universe. An equity issuer is considered to have a high relative price (i.e., a growth stock) primarily because it has a high price in relation to its book value. An equity issuer is considered to have a low relative price (i.e., a value stock) primarily because it has a low price in relation to its book value. In assessing relative price, the Advisor may consider additional factors such as price to cash flow or price to earnings ratios. An equity issuer is considered to have high profitability because it has high earnings or profits from operations in relation to its book value or assets. The criteria the Advisor uses for assessing relative price and profitability are subject to change from time to time. The Advisor may also adjust the representation in the International Core Equity Portfolio of an eligible company, or exclude a company, after considering such factors as free float, price momentum, trading strategies, liquidity, size, relative price, profitability, investment characteristics, and other factors that the Advisor determines to be appropriate.
Under normal market conditions, the International Core Equity Portfolio intends to invest at least 40% of its assets in three or more non-U.S. countries by investing in securities of companies associated with such countries.
The Advisor may consider a small capitalization company’s investment characteristics as compared to other eligible companies when making investment decisions and may exclude a small capitalization company with high investment as measured by the company’s recent asset growth. The Portfolio will generally not exclude more than 5% of the eligible small capitalization company universe within each eligible country based on such investment characteristics. The criteria the Advisor uses for assessing investment characteristics are subject to
150
change from time to time. The Advisor may decrease the amount that the Portfolio invests in eligible small capitalization companies that have lower profitability and/or higher relative prices.
The International Core Equity Portfolio may invest in exchange-traded funds (ETFs) for the purpose of gaining exposure to the equity markets while maintaining liquidity. In addition to money market instruments and other short-term investments, the International Core Equity Portfolio may invest in affiliated and unaffiliated registered and unregistered money market funds to manage cash pending investment in other securities or to maintain liquidity for the payment of redemptions or other purposes. Investments in ETFs and money market funds may involve a duplication of certain fees and expenses.
Global Small Company Portfolio
The Global Small Company Portfolio is a “fund of funds,” which means the Portfolio generally allocates its assets among other funds managed by the Advisor, although it has the ability to invest directly in securities and derivatives. The Global Small Company Portfolio seeks to achieve its investment objective of providing investors with access to securities portfolios consisting of a broad range of equity securities of primarily small United States, Canadian, Japanese, United Kingdom, Continental European, Asia Pacific, and Emerging Markets companies. The Portfolio also may have some exposure to small capitalization equity securities associated with other countries or regions. The Global Small Company Portfolio pursues its investment objective by investing substantially all of its assets in the following Underlying Funds: The Asia Pacific Small Company Series, The Canadian Small Company Series, The Continental Small Company Series, The Emerging Markets Small Cap Series, The Japanese Small Company Series, The United Kingdom Small Company Series (each a series of the Trust), and U.S. Small Cap Portfolio (a series of DFA Investment Dimensions Group, Inc.). For a complete description of the investment objectives and policies, portfolio structure and transactions for each Underlying Fund, see “International Small Company Portfolio—The Canadian Small Company Series”; “International Small Company Portfolios—Japanese Small Company Portfolio; Asia Pacific Small Company Portfolio; United Kingdom Small Company Portfolio; and Continental Small Company Portfolio”; “Emerging Markets Small Cap Portfolio.” With respect to the Portfolio’s investment in the U.S. Small Cap Portfolio, see “Investment in Underlying Funds—Domestic Equity Underlying Funds.”
The Global Small Company Portfolio typically allocates its investments among the Underlying Funds in the following manner: 30% to 70% in the U.S. Small Cap Portfolio; 5% to 30% in The Continental Small Company Series; 5% to 25% in The Emerging Markets Small Cap Series; 0% to 20% in The Japanese Small Company Series; 0% to 20% in The United Kingdom Small Company Series; 0% to 15% in The Asia Pacific Company Series; and 0% to 10% in The Canadian Small Company Series. When deciding allocations to the Underlying Funds, the Global Small Company Portfolio takes into account, among other factors, the aggregate market capitalizations and adjustments for free float of the eligible universe of securities within each region. Periodically, the Advisor will review the allocations for the Portfolio in each Underlying Fund and may adjust allocations to the Underlying Funds or may add or remove Underlying Funds in the Portfolio without notice to shareholders. Certain Underlying Funds invest in small companies using a market capitalization weighted approach in each country or region designated by the Advisor as an approved market for investment. A company’s market capitalization is the number of its shares outstanding times its price per share. Under a market capitalization weighted approach, companies with higher market capitalizations generally represent a larger proportion of an Underlying Fund than companies with relatively lower market capitalizations. The Advisor may adjust the representation in the Underlying Funds of an eligible company, or exclude a company, after considering such factors as free float, price momentum, trading strategies, liquidity, relative price, profitability, investment characteristics, and other factors that the Advisor determines to be appropriate. An equity issuer is considered to have a low relative price (i.e., a value stock) primarily because it has a low price in relation to its book value. In assessing relative price, the Advisor may consider additional factors such as price to cash flow or price to earnings ratios. An equity issuer is considered to have high profitability because it has high earnings or profits from operations in relation to its book value or assets. In assessing a company’s investment characteristics, the Advisor considers ratios such as recent changes in assets divided by total assets. The criteria the Advisor uses for assessing relative price, profitability, and investment characteristics are subject to change from time to time.
As a non-fundamental policy, under normal circumstances, the Global Small Company Portfolio, directly or through its investments in the Underlying Funds, will invest at least 80% of its net assets in securities of small companies. Under normal market conditions, whether directly or through its investment in the Underlying Funds,
151
the Global Small Company Portfolio will have exposure to companies associated with at least three approved markets (i.e., including the United States).
The Portfolio and each Underlying Fund may gain exposure to companies associated with approved markets by purchasing equity securities in the form of depositary receipts, which may be listed or traded outside the issuer’s domicile country. The Portfolio and each Underlying Fund also may use derivatives, such as futures contracts and options on futures contracts for equity securities and indices of its approved markets or other equity market securities or indices, including those of the United States, to increase or decrease equity market exposure based on actual or expected cash inflows to or outflows from the Portfolio or Underlying Fund. The Portfolio and Underlying Funds do not intend to use derivatives for purposes of speculation or leveraging investment returns.
The Advisor may consider a small capitalization company’s investment characteristics as compared to other eligible companies when making investment decisions and may exclude a small capitalization company with high investment as measured by the company’s recent asset growth. An Underlying Fund will generally not exclude more than 5% of the eligible small capitalization company universe within each eligible country based on such investment characteristics. The Advisor may decrease the amount that an Underlying Fund invests in eligible small capitalization companies that have lower profitability and/or higher relative prices.
In addition to, or in place of, investments in the Underlying Funds, the Portfolio also is permitted to invest directly in the same types of securities that are described in each Underlying Fund’s Prospectus as eligible investments for the Underlying Fund. In addition to money market instruments and other short-term investments, the Portfolio and each Underlying Fund may invest in affiliated and unaffiliated registered and unregistered money market funds to manage the Portfolio’s or Underlying Fund’s cash pending investment in other securities or to maintain liquidity for the payment of redemptions or other purposes. Investments in money market funds may involve a duplication of certain fees and expenses.
International Small Company Portfolios
The International Small Company Portfolio is a “fund of funds,” which means that it uses assets to purchase other mutual funds (the “Underlying Funds”). The International Small Company Portfolio and The Canadian Small Company Series (the “Canadian Small Company Series”), The Japanese Small Company Series (the “Japanese Small Company Series”), The Asia Pacific Small Company Series (the “Asia Pacific Small Company Series”), The United Kingdom Small Company Series (the “United Kingdom Small Company Series”) and The Continental Small Company Series (the “Continental Small Company Series”) of the Trust (the latter five being referred to hereinafter as the “Underlying Funds”) each have an investment objective to achieve long-term capital appreciation. The Portfolios that invest in such Underlying Funds (the “International Small Company Portfolios”) provide investors with access to securities portfolios consisting of small Canadian, Japanese, United Kingdom, European (including the Mediterranean) and Asia Pacific companies. Company size will be determined for purposes of these Portfolios and Underlying Funds on the basis of a company’s market capitalization, which will be calculated by multiplying the number of outstanding shares of the company by the price per share of the company’s stock.
The Advisor may consider a small capitalization company’s investment characteristics as compared to other eligible companies when making investment decisions and may exclude a small capitalization company with high investment as measured by the company’s recent asset growth. An Underlying Fund will generally not exclude more than 5% of the eligible small capitalization company universe within each eligible country based on such investment characteristics. The criteria the Advisor uses for assessing investment characteristics are subject to change from time to time. The Advisor may decrease the amount that an Underlying Fund invests in eligible small capitalization companies that have lower profitability and/or higher relative prices.
International Small Company Portfolio
The International Small Company Portfolio seeks to achieve its investment objective by investing virtually all of its assets in Underlying Funds, in such relative proportions as determined by the Advisor from time to time. For a complete description of the investment objectives and policies, portfolio structure and transactions for each Underlying Fund, see “International Small Company Portfolio—The Canadian Small Company Series”; “International Small Company Portfolios—Japanese Small Company Portfolio; Asia Pacific Small Company
152
Portfolio; United Kingdom Small Company Portfolio; Continental Small Company Portfolio.” The International Small Company Portfolio is designed for investors who wish to achieve their investment objective of capital appreciation by participating in the investment performance of a broad range of equity securities of Canadian, Japanese, United Kingdom, European (including the Mediterranean) and Asia Pacific small companies.
As of the date of this Prospectus, the International Small Company Portfolio invests in the shares of the Underlying Funds within the following percentage ranges:
|
|
|
| |||||
|
Underlying Funds |
Investment Range | ||||||
|
Canadian Small Company Series |
|
|
5-20 |
% |
| ||
|
| |||||||
|
Japanese Small Company Series |
|
|
10-35 |
% |
| ||
|
| |||||||
|
Asia Pacific Small Company Series |
|
|
5-25 |
% |
| ||
|
| |||||||
|
United Kingdom Small Company Series |
|
|
10-30 |
% |
| ||
|
| |||||||
|
Continental Small Company Series |
|
|
25-50 |
% |
| ||
|
| |||||||
The allocation of the assets of International Small Company Portfolio to be invested in the Underlying Funds will be determined by the Advisor on at least a semi-annual basis. In setting the target allocation, the Advisor will first consider the market capitalizations of all eligible companies in each of the Underlying Funds. The Advisor will calculate the market capitalizations for each Underlying Fund in the manner described below for the Canadian Small Company Series and for each other Underlying Fund under “International Small Company Portfolios—Japanese Small Company Portfolio; Asia Pacific Small Company Portfolio; United Kingdom Small Company Portfolio; Continental Small Company Portfolio.” Periodically, the Advisor will review the allocations for the International Small Company Portfolio in each Underlying Fund and may adjust allocations to the Underlying Funds or may add or remove Underlying Funds in the Portfolio without notice to shareholders. As a non-fundamental policy, under normal circumstances, the International Small Company Portfolio, through its investments in the Underlying Funds, will invest at least 80% of its net assets in securities of small companies.
The Canadian Small Company Series. The Canadian Small Company Series generally will purchase a broad and diverse group of readily marketable securities of Canadian small companies. The Canadian Small Company Series invests in securities of companies associated with Canada, which is the Canadian Small Company Series’ Approved Market (For a description of the securities approved for investment, see “Approved Markets”), listed or traded in the form of EDRs, GDRs, ADRs or other types of depositary receipts (including non-voting depositary receipts) or dual listed securities. The Advisor measures company size based primarily on market capitalization. The Advisor first ranks eligible companies by market capitalization. The Advisor then determines the universe of eligible securities by defining the maximum market capitalization of a small company in Canada. Based on market capitalization data as of December 31, 2022, the Advisor would consider Canadian small companies to be those companies with a market capitalization of below $4,110 million. This threshold will change due to market conditions. As a non-fundamental policy, under normal circumstances, the Canadian Small Company Series will invest at least 80% of its net assets in securities of Canadian small companies.
The Advisor will also establish a minimum market capitalization that a company must meet in order to be considered for purchase, which minimum will change due to market conditions. The Canadian Small Company Series intends to invest in stock of eligible companies using a market capitalization weighted approach. See “Portfolio Construction—International Small Company Portfolios.”
The Advisor may consider a small capitalization company’s investment characteristics as compared to other eligible companies when making investment decisions and may exclude a small capitalization company with high investment as measured by the company’s recent asset growth. The Series will generally not exclude more than 5% of the eligible Canadian small capitalization company universe based on such investment characteristics. The criteria the Advisor uses for assessing investment characteristics are subject to change from time to time. The Advisor may decrease the amount that the Series invests in eligible Canadian small capitalization companies that have lower profitability and/or higher relative prices. The Canadian Small Company Series may invest in exchange-traded funds (ETFs) that provide exposure to the Canadian equity market or other equity markets, including the United States, for the purpose of gaining
153
exposure to the equity markets while maintaining liquidity. In addition to money market instruments and other short-term investments, the Canadian Small Company Series may invest in affiliated and unaffiliated registered and unregistered money market funds to manage cash pending investment in other securities or to maintain liquidity for the payment of redemptions or other purposes. Investments in ETFs and money market funds may involve a duplication of certain fees and expenses.
Japanese Small Company Portfolio
The Japanese Small Company Portfolio invests all of its assets in the Japanese Small Company Series, which has the same investment objective and policies as the Portfolio. The Japanese Small Company Series generally will purchase a broad and diverse group of readily marketable securities of Japanese small companies. The Japanese Small Company Series invests in securities of companies associated with Japan, which is the Japanese Small Company Series’ Approved Market (For a description of the securities approved for investment, see “Approved Markets”). The Advisor measures company size based primarily on market capitalization. The Advisor first ranks eligible companies by market capitalization. The Advisor then determines the universe of eligible securities by defining the maximum market capitalization of a small company in Japan. Based on market capitalization data as of December 31, 2022, the Advisor would consider Japanese small companies to be those companies with a market capitalization below $2,035 million. This threshold will change due to market conditions. As a non-fundamental policy, under normal circumstances, the Japanese Small Company Series will invest at least 80% of its net assets in securities of Japanese small companies.
The Advisor will also establish a minimum market capitalization that a company must meet in order to be considered for purchase, which minimum will change due to market conditions. The Japanese Small Company Series intends to invest in the stock of eligible companies using a market capitalization weighted approach. See “Portfolio Construction—International Small Company Portfolios.”
The Advisor may consider a small capitalization company’s investment characteristics as compared to other eligible companies when making investment decisions and may exclude a small capitalization company with high investment as measured by the company’s recent asset growth. The Series will generally not exclude more than 5% of the eligible Japanese small capitalization company universe based on such investment characteristics. The criteria the Advisor uses for assessing investment characteristics are subject to change from time to time. The Advisor may decrease the amount that the Series invests in eligible Japanese small capitalization companies that have lower profitability and/or higher relative prices.
The Japanese Small Company Series may invest in exchange-traded funds (ETFs) that provide exposure to the Japanese equity market or other equity markets, including the United States, for the purpose of gaining exposure to the equity markets while maintaining liquidity. In addition to money market instruments and other short-term investments, the Japanese Small Company Series may invest in affiliated and unaffiliated registered and unregistered money market funds to manage the Series’ cash pending investment in other securities or to maintain liquidity for the payment of redemptions or other purposes. Investments in ETFs and money market funds may involve a duplication of certain fees and expenses.
Asia Pacific Small Company Portfolio
The Asia Pacific Small Company Portfolio invests all of its assets in the Asia Pacific Small Company Series, which has the same investment objective and policies as the Portfolio. The Asia Pacific Small Company Series generally will purchase securities of a broad and diverse group of small companies located in Australia, New Zealand and Pacific Rim Asian countries. The Asia Pacific Small Company Series invests in securities of companies associated with Approved Markets (For a description of the securities and countries approved for investment, see “Approved Markets”). The Advisor measures company size on a country specific basis and based primarily on market capitalization. In the countries authorized for investment, the Advisor first ranks eligible companies based on the companies’ market capitalizations. The Advisor then determines the universe of eligible securities by defining the maximum market capitalization of a small company that may be purchased by the Asia Pacific Small Company Series with respect to each country authorized for investment. Based on market capitalization data as of December 31, 2022, for the Asia Pacific Small Company Series, the market capitalization of a small company in any country in which the Asia Pacific Small Company Series invests would be below $4,411 million. This threshold will vary by country. Based on market capitalization data as of December 31, 2022, the Advisor would consider
154
Asia Pacific small companies to be those companies with a market capitalization below $2,547 million in Australia, $4,411 million in Hong Kong, $1,593 million in New Zealand and $3,707 million in Singapore. These thresholds will change due to market conditions. As a non-fundamental policy, under normal circumstances, the Asia Pacific Small Company Series will invest at least 80% of its net assets in securities of small companies located in Australia, New Zealand and Pacific Rim Asian countries.
The Advisor will also establish a minimum market capitalization that a company must meet in order to be considered for purchase, which minimum will change due to market conditions. The Asia Pacific Small Company Series intends to invest in eligible companies using a market capitalization weighted approach. The Advisor may, in its discretion, either limit further investments in a particular country or divest the Asia Pacific Small Company Series of holdings in a particular country. See “Portfolio Construction—International Small Company Portfolios.”
The Advisor may consider a small capitalization company’s investment characteristics as compared to other eligible companies when making investment decisions and may exclude a small capitalization company with high investment as measured by the company’s recent asset growth. The Series will generally not exclude more than 5% of the eligible small capitalization company universe within each eligible country based on such investment characteristics. The criteria the Advisor uses for assessing investment characteristics are subject to change from time to time. The Advisor may decrease the amount that the Series invests in eligible small capitalization companies that have lower profitability and/or higher relative prices.
The Asia Pacific Small Company Series may invest in exchange-traded funds (ETFs) that provide exposure to Asia Pacific equity markets or other equity markets, including the United States, for the purpose of gaining exposure to the equity markets while maintaining liquidity. In addition to money market instruments and other short-term investments, the Asia Pacific Small Company Series may invest in affiliated and unaffiliated registered and unregistered money market funds to manage the cash pending investment in other securities or to maintain liquidity for the payment of redemptions or other purposes. Investments in ETFs and money market funds may involve a duplication of certain fees and expenses.
United Kingdom Small Company Portfolio
The United Kingdom Small Company Portfolio invests all of its assets in the United Kingdom Small Company Series, which has the same investment objective and policies as the Portfolio. The United Kingdom Small Company Series generally will purchase a broad and diverse group of readily marketable securities of United Kingdom small companies. The United Kingdom Small Company Series invests in securities of companies associated with the United Kingdom, which is the United Kingdom Small Company Series’ Approved Market (For a description of the securities approved for investment, see “Approved Markets”). The Advisor measures company size based primarily on the market capitalization of companies in the United Kingdom. The Advisor first ranks eligible companies by market capitalization. The Advisor then determines the universe of eligible securities by defining the maximum market capitalization of a small company in the United Kingdom. Based on market capitalization data as of December 31, 2022, the Advisor would consider United Kingdom small companies to be those companies with a market capitalization below $3,773 million. This threshold will change due to market conditions. As a non-fundamental policy, under normal circumstances, the United Kingdom Small Company Series will invest at least 80% of its net assets in securities of United Kingdom small companies.
The Advisor will also establish a minimum market capitalization that a company must meet in order to be considered for purchase, which minimum will change due to market conditions. The United Kingdom Small Company Series intends to invest in stock of eligible companies using a market capitalization weighted approach. See “Portfolio Construction—International Small Company Portfolios.”
The Advisor may consider a small capitalization company’s investment characteristics as compared to other eligible companies when making investment decisions and may exclude a small capitalization company with high investment as measured by the company’s recent asset growth. The Series will generally not exclude more than 5% of the eligible United Kingdom small capitalization company universe based on such investment characteristics. The criteria the Advisor uses for assessing investment characteristics are subject to change from time to time. The Advisor may decrease the amount that the Series invests in eligible United Kingdom small capitalization companies that have lower profitability and/or higher relative prices.
155
The United Kingdom Small Company Series may invest in exchange-traded funds (ETFs) that provide exposure to the United Kingdom equity market or other equity markets, including the United States, for the purpose of gaining exposure to the equity markets while maintaining liquidity. In addition to money market instruments and other short-term investments, the United Kingdom Small Company Series may invest in affiliated and unaffiliated registered and unregistered money market funds to manage cash pending investment in other securities or to maintain liquidity for the payment of redemptions or other purposes. Investments in ETFs and money market funds may involve a duplication of certain fees and expenses.
Continental Small Company Portfolio
The Continental Small Company Portfolio invests all of its assets in the Continental Small Company Series, which has the same investment objective and policies as the Portfolio. The Continental Small Company Series generally will purchase readily marketable securities of a broad and diverse group of small European companies. The Series also may invest in up to 20% of its net assets in small companies associated with non-European countries that the Advisor has identified as authorized for investment. The Continental Small Company Series invests in securities of companies associated with Approved Markets (For a description of the securities and countries approved for investment, see “Approved Markets”). The Advisor determines company size on a country or region specific basis and based primarily on market capitalization. In the countries or regions authorized for investment, the Advisor first ranks eligible companies listed on selected exchanges based on the companies’ market capitalizations. The Advisor then determines the universe of eligible securities by defining the maximum market capitalization of a small company that may be purchased by the Continental Small Company Series with respect to each country or region. Based on market capitalization data as of December 31, 2022, for the Continental Small Company Series, the market capitalization of a small company in any country or region in which the Continental Small Company Series invests would be below $8,202 million. This threshold will vary by country or region. For example, based on market capitalization data as of December 31, 2022, the Advisor would consider a small company in the EMU to have a market capitalization below $6,125 million, a small company in Norway to have a market capitalization below $1,765 million, and a small company in Switzerland to have a market capitalization below $8,202 million. These thresholds will change due to market conditions. As a non-fundamental policy, under normal circumstances, the Continental Small Company Series will invest at least 80% of its net assets in securities of small companies located in continental Europe.
The Advisor will establish a minimum market capitalization that a company must meet in order to be considered for purchase, which minimum will change due to market conditions. The Continental Small Company Series intends to invest in the stock of eligible companies using a market capitalization weighted approach. The Advisor may in its discretion either limit further investments in a particular country or divest the Continental Small Company Series of holdings in a particular country. See “Portfolio Construction—International Small Company Portfolios.”
The Advisor may consider a small capitalization company’s investment characteristics as compared to other eligible companies when making investment decisions and may exclude a small capitalization company with high investment as measured by the company’s recent asset growth. The Series will generally not exclude more than 5% of the eligible small capitalization company universe within each eligible country based on such investment characteristics. The criteria the Advisor uses for assessing investment characteristics are subject to change from time to time. The Advisor may decrease the amount that the Series invests in eligible small capitalization companies that have lower profitability and/or higher relative prices.
The Continental Small Company Series may invest in exchange-traded funds (ETFs) that provide exposure to the continental European equity markets or other equity markets, including the United States, for the purpose of gaining exposure to the equity markets while maintaining liquidity. In addition to money market instruments and other short-term investments, the Continental Small Company Series may invest in affiliated and unaffiliated registered and unregistered money market funds to manage cash pending investment in other securities or to maintain liquidity for the payment of redemptions or other purposes. Investments in ETFs and money market funds may involve a duplication of certain fees and expenses.
156
DFA International Real Estate Securities Portfolio
The investment objective of the DFA International Real Estate Securities Portfolio is to achieve long-term capital appreciation. The Portfolio will concentrate its investments in a broad and diverse set of securities of non-U.S. companies principally engaged in the real estate industry with a particular focus on non-U.S. REITs and companies the Advisor considers to be REIT-like entities. The DFA International Real Estate Securities Portfolio considers a company to be principally engaged in the real estate industry if the company’s principal activities include ownership, management, development, construction, or sale of residential, commercial or industrial real estate. REITs and REIT-like entities are types of real estate companies that pool investors’ funds for investment primarily in income producing real estate or real estate related loans or interests.
Under normal market conditions, the DFA International Real Estate Portfolio intends to invest at least 40% of its assets in three or more non-U.S. countries by investing in securities of companies associated with such countries. The DFA International Real Estate Securities Portfolio purchases non-U.S. real estate securities of companies associated with Approved Markets (For a description of the securities and countries approved for investment, see “Approved Markets”).
On at least a semi-annual basis, the Advisor will identify a schedule of eligible investments consisting of equity securities of non-U.S. companies in the real estate industry as described above. It is the intention of the DFA International Real Estate Securities Portfolio to invest in the securities of eligible companies generally using a market capitalization weighted approach to determine individual security weights and country weights. See “Market Capitalization Weighted Approach.” The use of a market capitalization weighted approach may result in the Portfolio having more than 25% of its assets in companies located in a single country.
If securities must be sold in order to obtain funds to make redemption payments, such securities may be repurchased by the DFA International Real Estate Securities Portfolio, as additional cash becomes available to the Portfolio. However, the Portfolio has retained the right to borrow to make redemption payments and also is authorized to redeem its shares in-kind. See “REDEMPTION OF SHARES.” Further, because the securities of certain companies whose shares are eligible for purchase are thinly traded, the Portfolio might not be able to purchase the number of shares that would otherwise be purchased using strict market capitalization weighting.
Investments will not be based upon an issuer’s dividend payment policy or record. However, many of the companies whose securities will be included in the DFA International Real Estate Securities Portfolio do pay dividends. It is anticipated, therefore, that the Portfolio will receive dividend income. Periodically, the Advisor may expand the investments eligible for the DFA International Real Estate Securities Portfolio to include equity securities of eligible companies and additional countries to respond to market events, new listings and/or new legal structures in non-U.S. markets, among others.
The DFA International Real Estate Securities Portfolio may invest in exchange-traded funds (ETFs) that provide exposure to equity markets, including the United States, both within and outside the real estate industry, and for the purposes of gaining exposure to the equity markets, while maintaining liquidity. In addition to money market instruments and other short-term investments, the DFA International Real Estate Securities Portfolio may invest in affiliated and unaffiliated registered and unregistered money market funds to manage the Portfolio’s cash pending investment in other securities or to maintain liquidity for the payment of redemptions or other purposes. Investments in ETFs and money market funds may involve a duplication of certain fees and expenses.
The DFA International Real Estate Securities Portfolio may also invest in China A-shares (equity securities of companies listed in China) that are accessible through the Shanghai-Hong Kong Stock Connect program or the Shenzhen-Hong Kong Stock Connect program (together, “Stock Connect”) and variable interest entities (special structures that utilize contractual arrangements to provide exposure to certain Chinese companies).
DFA Global Real Estate Securities Portfolio
The investment objective of the DFA Global Real Estate Securities Portfolio is to achieve long-term capital appreciation. The DFA Global Real Estate Securities Portfolio seeks to achieve exposure to a broad portfolio of securities of U.S. and non-U.S. companies in the real estate industry, with a focus on REITs or companies that the Advisor considers to be REIT-like entities. The DFA Global Real Estate Securities Portfolio may pursue its
157
investment objective by investing its assets in the DFA Real Estate Securities Portfolio, DFA International Real Estate Securities Portfolio (the “Underlying Funds”), and/or directly in securities of companies in the real estate industry. For a complete description of the investment objectives and policies, portfolio structure and transactions for the Underlying Fund included in this Prospectus, see “DFA International Real Estate Securities Portfolio”. With respect to the Portfolio’s investments in the DFA Real Estate Securities Portfolio, see “Investments in Underlying Funds—Domestic Equity Funds.”
The DFA Global Real Estate Securities Portfolio and each Underlying Fund may purchase or sell futures contracts and options on futures contracts for equity securities and indices, and such investments may or may not provide exposure to the real estate industry. The Portfolio and Underlying Funds do not intend to sell futures contracts to or to use derivatives for purposes of speculation or leveraging investment returns. The DFA Global Real Estate Securities Portfolio and each Underlying Fund may invest in exchange-traded funds (ETFs) that provide exposure to equity markets, including the United States, both within and outside the real estate industry, and for the purposes of gaining exposure to the equity markets, while maintaining liquidity. In addition to money market instruments and other short-term investments, the DFA Global Real Estate Securities Portfolio and each Underlying Fund may invest in affiliated and unaffiliated registered and unregistered money market funds to manage cash pending investment in other securities or to maintain liquidity for the payment of redemptions or other purposes. Investments in ETFs and money market funds may involve a duplication of certain fees and expenses.
On at least a semi-annual basis, the Advisor will identify a schedule of eligible investments consisting of equity securities of all companies in the real estate industry eligible for investment by the DFA Global Real Estate Securities Portfolio and each Underlying Fund. It is the intention of the DFA Global Real Estate Securities Portfolio and each Underlying Fund to invest in the securities of eligible companies using a market capitalization weighted approach to determine security weights and country weights. See “Market Capitalization Weighted Approach.”
The DFA Global Real Estate Securities Portfolio and the DFA International Real Estate Securities Portfolio, an Underlying Fund, may also invest in China A-shares (equity securities of companies listed in China) that are accessible through Stock Connect and variable interest entities (special structures that utilize contractual arrangements to provide exposure to certain Chinese companies).
DFA International Small Cap Value Portfolio
The investment objective of the DFA International Small Cap Value Portfolio is to achieve long-term capital appreciation. The DFA International Small Cap Value Portfolio seeks to achieve its objective by purchasing the securities of small, non-U.S. companies that the Advisor determines to be value stocks at the time of purchase. An equity issuer is considered to have a low relative price (i.e., a value stock) primarily because it has a low price in relation to its book value. In assessing relative price, the Advisor may consider additional factors such as price to cash flow or price to earnings ratios. The criteria the Advisor uses for assessing relative price are subject to change from time to time.
The DFA International Small Cap Value Portfolio intends to purchase securities of small companies in countries with developed markets. Under normal market conditions, the DFA International Small Cap Value Portfolio intends to invest at least 40% of its assets in three or more non-U.S. countries by investing in securities of companies associated with such countries. The DFA International Small Cap Value Portfolio invests its assets in securities of companies associated with Approved Markets (For a description of the securities and countries approved for investment, see “Approved Markets”).
The DFA International Small Cap Value Portfolio intends to invest in the stock of eligible companies using a market capitalization weighted approach. The Advisor, using this approach and its judgment, will seek to set country weights based on the relative market capitalizations of eligible small companies within each country. See “Market Capitalization Weighted Approach.” The weightings of countries in the DFA International Small Cap Value Portfolio may vary from their weightings in international indices, such as those published by FTSE International, and MSCI.
158
The DFA International Small Cap Value Portfolio does not seek current income as an investment objective and investments will not be based upon an issuer’s dividend payment policy or record. However, many of the companies whose securities will be included in the Portfolio do pay dividends. It is anticipated, therefore, that the Portfolio will receive dividend income.
The Advisor may consider a small capitalization company’s investment characteristics as compared to other eligible companies when making investment decisions and may exclude a small capitalization company with high investment as measured by the company’s recent asset growth. The Portfolio will generally not exclude more than 5% of the eligible small capitalization company universe within each eligible country based on such investment characteristics. The criteria the Advisor uses for assessing investment characteristics are subject to change from time to time. The Advisor may decrease the amount that the Portfolio invests in eligible small capitalization companies that have lower profitability and/or higher relative prices.
The DFA International Small Cap Value Portfolio may invest in exchange-traded funds (ETFs) for the purpose of gaining exposure to the equity markets while maintaining liquidity. In addition to money market instruments and other short-term investments, the Portfolio may invest in affiliated and unaffiliated registered and unregistered money market funds to manage the Portfolio’s cash pending investment in other securities or to maintain liquidity for the payment of redemptions or other purposes. Investments in ETFs and money market funds may involve a duplication of certain fees and expenses.
International Vector Equity Portfolio
The investment objective of the International Vector Equity Portfolio is to achieve long-term capital appreciation. The International Vector Equity Portfolio’s investment objective may be changed without shareholder approval.
The International Vector Equity Portfolio seeks to achieve its investment objective by purchasing a broad and diverse group of securities of non-U.S. companies. The Portfolio invests in companies of all sizes, with increased exposure to smaller capitalization, lower relative price, and higher profitability companies relative to the International Universe. For purposes of the International Vector Equity Portfolio, the Advisor defines the International Universe as a market capitalization weighted set of non-U.S. companies associated with developed markets that have been authorized for investment by the Advisor’s Investment Committee (International Universe). See “Approved Markets.” Market capitalization weighted means that a company’s weighting in the International Universe is proportional to that company’s actual market capitalization compared to the total market capitalization of all eligible companies. The higher the company’s relative market capitalization, the greater its representation.
An equity issuer is considered to have a high relative price (i.e., a growth stock) primarily because it has a high price in relation to its book value. An equity issuer is considered to have a low relative price (i.e., a value stock) primarily because it has a low price in relation to its book value. In assessing relative price, the Advisor may consider additional factors such as price to cash flow or price to earnings ratios. An equity issuer is considered to have high profitability because it has high earnings or profits from operations in relation to its book value or assets. The criteria the Advisor uses for assessing relative price and profitability are subject to change from time to time. The Advisor may also adjust the representation in the International Vector Equity Portfolio of an eligible company, or exclude a company, after considering such factors as free float, price momentum, trading strategies, liquidity, size, relative price, profitability, investment characteristics, and other factors that the Advisor determines to be appropriate.
The International Vector Equity Portfolio does not seek current income as an investment objective and investments will not be based upon an issuer’s dividend payment policy or record. However, many of the companies whose securities will be included in the Portfolio do pay dividends. It is anticipated, therefore, that the Portfolio will receive dividend income.
Under normal market conditions, the International Vector Equity Portfolio intends to invest at least 40% of its assets in three or more non-U.S. countries by investing in securities of companies associated with such countries.
The Advisor may consider a small capitalization company’s investment characteristics as compared to other eligible companies when making investment decisions and may exclude a small capitalization company with high
159
investment as measured by the company’s recent asset growth. The Portfolio will generally not exclude more than 5% of the eligible small capitalization company universe within each eligible country based on such investment characteristics. The criteria the Advisor uses for assessing investment characteristics are subject to change from time to time. The Advisor may decrease the amount that the Portfolio invests in eligible small capitalization companies that have lower profitability and/or higher relative prices.
The International Vector Equity Portfolio may invest in exchange-traded funds (ETFs) for the purpose of gaining exposure to the equity markets, including the U.S. equity market, while maintaining liquidity. In addition to money market instruments and other short-term investments, the International Vector Equity Portfolio may invest in affiliated and unaffiliated registered or unregistered money market funds to manage the Portfolio’s cash pending investment in other securities or to maintain liquidity for the payment of redemptions or other purposes. Investments in ETFs and money market funds may involve a duplication of certain fees and expenses.
International High Relative Profitability Portfolio
The investment objective of the International High Relative Profitability Portfolio is to achieve long-term capital appreciation. The International High Relative Profitability Portfolio purchases securities of large non-U.S. companies that the Advisor determines to have high profitability relative to other large cap companies in the same country or region, at the time of purchase. An equity issuer is considered to have high profitability because it has high earnings or profits from operations in relation to its book value or assets. Generally, the Advisor expects to consider such factors as market capitalization, free float, size, relative price, profitability, price momentum, trading strategies, liquidity management, and other factors that the Advisor determines to be appropriate, to determine the representation of an eligible company in the Portfolio. An equity issuer is considered to have a low relative price (i.e., a value stock) primarily because it has a low price in relation to its book value. In assessing relative price, the Advisor may consider additional factors such as price to cash flow or price to earnings ratios. The criteria the Advisor uses for assessing relative price and profitability are subject to change from time to time.
Under normal market conditions, the International High Relative Profitability Portfolio intends to invest at least 40% of its assets in three or more non-U.S. countries by investing in securities of companies associated with such countries. The International High Relative Profitability Portfolio invests its assets in securities of companies associated with Approved Markets (for a description of the securities and countries approved for investment, see “Approved Markets”). In addition, the Portfolio may continue to hold securities of developed market countries that are not listed in Approved Markets, but had been authorized for investment in the past, and may reinvest distributions received in connection with such existing investments in such previously Approved Markets.
As a non-fundamental policy, under normal circumstances, the International High Relative Profitability Portfolio will invest at least 80% of its net assets in securities of companies in the particular non-U.S. markets in which the Portfolio invests. In the countries or regions authorized for investment, the Advisor first ranks eligible companies listed on selected exchanges based on the companies’ market capitalizations. The Advisor then determines the universe of eligible stocks by defining the minimum market capitalization of a large company that may be purchased by the International High Relative Profitability Portfolio with respect to each country or region. Based on market capitalization data as of December 31, 2022, for the International High Relative Profitability Portfolio, the market capitalization of a large company in any country or region in which the Portfolio invests would be $1,325 million or above. This threshold will vary by country or region. For example, based on market capitalization data as of December 31, 2022, the Advisor considered a large company in the EMU to have a market capitalization of at least $6,125 million, a large company in Norway to have a market capitalization of at least $1,765 million and a large company in Switzerland to have a market capitalization of at least $8,202 million. These thresholds will change due to market conditions.
The International High Relative Profitability Portfolio does not seek current income as an investment objective and investments will not be based upon an issuer’s dividend payment policy or record. However, many of the companies whose securities will be included in the Portfolio do pay dividends. It is anticipated, therefore, that the Portfolio will receive dividend income.
160
The International High Relative Profitability Portfolio also may purchase or sell futures contracts and options on futures contracts for foreign or U.S. equity securities and indices, to increase or decrease equity market exposure based on actual or expected cash inflows to or outflows from the Portfolio.
The International High Relative Profitability Portfolio may invest in ETFs for the purpose of gaining exposure to the equity markets while maintaining liquidity. In addition to money market instruments and other short-term investments, the Portfolio may invest in affiliated and unaffiliated registered and unregistered money market funds to manage the Portfolio’s cash pending investment in other securities or to maintain liquidity for the payment of redemptions or other purposes. Investments in ETFs and money market funds may involve a duplication of certain fees and expenses.
World ex U.S. Value Portfolio
The investment objective of the World ex U.S. Value Portfolio is to achieve long-term capital appreciation. The World ex U.S. Value Portfolio is a “fund of funds,” which means that the Portfolio generally allocates its assets among other mutual funds managed by the Advisor though it also has the ability to invest directly in securities. The World ex U.S. Value Portfolio seeks to achieve exposure to a broad portfolio of securities of non-U.S. companies associated with countries with developed and emerging markets, which may include frontier markets (emerging markets in an earlier stage of development), that the Advisor believes to be value stocks at the time of purchase by primarily purchasing shares of The DFA International Value Series (the “International Value Series”), DFA International Small Cap Value Portfolio, and Dimensional Emerging Markets Value Fund (the “Underlying Funds”). For a complete description of the investment objectives and policies, portfolio structure and transactions for each of the Underlying Funds, see “DFA International Value Portfolio,” “DFA International Small Cap Value Portfolio” and “Emerging Markets Value Portfolio.”
An equity issuer is considered to have a low relative price (i.e., a value stock) primarily because it has a low price in relation to its book value. In assessing relative price, the Advisor may consider additional factors such as price to cash flow or price to earnings ratios. The criteria the Advisor uses for assessing relative price are subject to change from time to time.
The World ex U.S. Value Portfolio typically allocates its investments among the Underlying Funds in the following manner: 50% to 80% in the International Value Series; 5% to 20% in the DFA International Small Cap Value Portfolio; and 15% to 45% in the Dimensional Emerging Markets Value Fund. The International Value Series and DFA International Small Cap Value Portfolio invest in the securities of eligible companies using a market capitalization weighted approach to determine security weights and country weights. See “Market Capitalization Weighted Approach.”
The Advisor will determine in its discretion when and whether to invest in markets that have been authorized as Approved Markets for each Underlying Fund, depending on a number of factors, including, but not limited to, asset growth in the Underlying Fund, constraints imposed in Approved Markets, and other characteristics of each such market. The Investment Committee of the Advisor also may authorize other markets for investment in the future, in addition to the Approved Markets identified above, or may remove one or more markets from the list of Approved Markets for an Underlying Fund. Also, an Underlying Fund may continue to hold investments in countries that are not currently designated as Approved Markets, but had been authorized for investment in the past, and may reinvest distributions received in connection with such existing investments in such previously Approved Markets. For a description of the securities approved for investment, see “Approved Markets.”
In addition to, or in place of, investments in the Underlying Funds, the World ex U.S. Value Portfolio also is permitted to invest directly in the same types of securities of companies that are described in this Prospectus as eligible investments for the Underlying Funds.
The value criteria used by the Advisor, as described above, generally apply at the time of purchase by the World ex U.S. Value Portfolio or an Underlying Fund. The World ex U.S. Value Portfolio and Underlying Funds are not required to dispose of a security if the security’s issuer does not meet current value criteria. Securities which do meet the value criteria nevertheless may be sold at any time when, in the Advisor’s judgment, circumstances warrant their sale. See “Portfolio Transactions—All Portfolios.”
161
The Emerging Markets Value Fund, an Underlying Fund, may also invest in China A-shares (equity securities of companies listed in China) that are accessible through Stock Connect and variable interest entities (special structures that utilize contractual arrangements to provide exposure to certain Chinese companies).
The World ex U.S. Value Portfolio and each Underlying Fund may purchase or sell futures contracts and options on futures contracts for equity securities and indices to increase or decrease equity market exposure based on actual or expected cash inflows to or outflows from the Portfolio or Underlying Fund. The World ex U.S. Value Portfolio and Underlying Funds do not intend to sell futures contracts to establish short positions in individual securities or to use derivatives for purposes of speculation or leveraging investment returns. The World ex U.S. Value Portfolio and each Underlying Fund may invest in exchange-traded funds (ETFs) for the purposes of gaining exposure to the equity markets, while maintaining liquidity. In addition to money market instruments and other short-term investments, the World ex U.S. Value Portfolio and each Underlying Fund may invest in affiliated and unaffiliated registered and unregistered money market funds to manage cash pending investment in other securities or to maintain liquidity for the payment of redemptions or other purposes. Investments in ETFs and money market funds may involve a duplication of certain fees and expenses.
World ex U.S. Core Equity Portfolio
The investment objective of the World ex U.S. Core Equity Portfolio is to achieve long-term capital appreciation. The Portfolio seeks to achieve its investment objective by purchasing a broad and diverse group of securities of non-U.S. companies. The Portfolio invests in companies of all sizes, with increased exposure to smaller capitalization, lower relative price, and higher profitability companies relative to the non-U.S. Universe. For purposes of this Portfolio, the Advisor defines the “non-U.S. Universe” as a market capitalization weighted set of non-U.S. companies in developed and emerging markets, which may include frontier markets, that have been authorized for investment as Approved Markets by the Advisor’s Investment Committee. (For a description of the securities and countries approved for investment, see “Approved Markets”). Market capitalization weighted means that a company’s weighting in the non-U.S. Universe is proportional to that company’s actual market capitalization compared to the total market capitalization of all eligible companies. The higher the company’s relative market capitalization, the greater its representation.
The increased exposure to smaller capitalization, lower relative price, and higher profitability companies for the World ex U.S. Core Equity Portfolio may be achieved by decreasing the allocation of the Portfolio’s assets to larger capitalization, higher relative price, or lower profitability companies relative to their weight in the non-U.S. Universe. An equity issuer is considered to have a high relative price (i.e., a growth stock) primarily because it has a high price in relation to its book value. An equity issuer is considered to have a low relative price (i.e., a value stock) primarily because it has a low price in relation to its book value. In assessing relative price, the Advisor may consider additional factors such as price to cash flow or price to earnings ratios. An equity issuer is considered to have high profitability because it has high earnings or profits from operations in relation to its book value or assets. The criteria the Advisor uses for assessing relative price and profitability are subject to change from time to time.
The Advisor may adjust the representation in the World ex U.S. Core Equity Portfolio of an eligible company, or exclude a company, after considering such factors as free float, price momentum, trading strategies, liquidity, size, relative price, profitability, investment characteristics, and other factors that the Advisor determines to be appropriate.
In determining which emerging market countries are eligible markets for the World ex U.S. Core Equity Portfolio, the Advisor may consider various factors, including, without limitation, the data, analysis, and classification of countries published or disseminated by the International Bank for Reconstruction and Development (commonly known as the World Bank), the International Finance Corporation, FTSE International, and MSCI. Approved Markets may not include all such emerging markets. In determining whether to approve emerging markets for investment, the Advisor may take into account, among other things, market liquidity, relative availability of investor information, government regulation, including fiscal and foreign exchange repatriation rules and the availability of other access to these markets for the Portfolio.
The Advisor may consider a small capitalization company’s investment characteristics as compared to other eligible companies when making investment decisions and may exclude a small capitalization company with high
162
investment as measured by the company’s recent asset growth. The Portfolio will generally not exclude more than 5% of the eligible small capitalization company universe within each eligible country based on such investment characteristics. The criteria the Advisor uses for assessing investment characteristics are subject to change from time to time. The Advisor may decrease the amount that the Portfolio invests in eligible small capitalization companies that have lower profitability and/or higher relative prices.
The World ex U.S. Core Equity Portfolio may invest in exchange-traded funds (ETFs) for the purpose of gaining exposure to the equity markets, including the United States, while maintaining liquidity. The Portfolio may purchase or sell futures contracts and options on futures contracts for foreign or U.S. equity securities and indices, to increase or decrease equity market exposure based on actual or expected cash inflows to or outflows from the Portfolio. The Portfolio may engage in foreign currency transactions for the purposes of settling the Portfolio’s purchases and sales of foreign securities. In addition to money market instruments and other short-term investments, the Portfolio may invest in affiliated and unaffiliated registered and unregistered money market funds to manage the Portfolio’s cash pending investment in other securities or to maintain liquidity for the payment of redemptions or other purposes. Investments in ETFs and money market funds may involve a duplication of certain fees and expenses.
The World ex U.S. Core Equity Portfolio may also invest in China A-shares (equity securities of companies listed in China) that are accessible through Stock Connect and variable interest entities (special structures that utilize contractual arrangements to provide exposure to certain Chinese companies).
World Core Equity Portfolio
The investment objective of the World Core Equity Portfolio is to achieve long-term capital appreciation. The World Core Equity Portfolio is a “fund of funds,” which means that the Portfolio generally allocates its assets among other mutual funds managed by the Advisor though it also has the ability to invest directly in securities. The World Core Equity Portfolio seeks to achieve exposure to a broad portfolio of securities of both U.S. companies and non-U.S. companies associated with countries with developed and emerging markets, which may include frontier markets (emerging markets in an earlier stage of development), by primarily purchasing shares of U.S. Core Equity 1 Portfolio, International Core Equity Portfolio and Emerging Markets Core Equity Portfolio (the “Underlying Funds”). The World Core Equity Portfolio may have exposure to companies in all the market capitalization ranges. For a complete description of the investment objectives and policies, portfolio structure and transactions for each of the Underlying Funds included in this Prospectus, see “International Core Equity Portfolio,” and “Emerging Markets Core Equity Portfolio.” With respect to the Portfolio’s investments in the U.S. Core Equity 1 Portfolio, see “Investments in Underlying Funds—Domestic Equity Underlying Funds.”
An equity issuer is considered to have a low relative price (i.e., a value stock) primarily because it has a low price in relation to its book value. In assessing relative price, the Advisor may consider additional factors such as price to cash flow or price to earnings ratios. The criteria the Advisor uses for assessing relative price are subject to change from time to time.
The World Core Equity Portfolio typically allocates its investments among the Underlying Funds in the following manner: 35% to 80% in the U.S. Core Equity 1 Portfolio; 15% to 55% in the International Core Equity Portfolio; and 5% to 20% in the Emerging Markets Core Equity Portfolio.
The Advisor will determine in its discretion when and whether to invest in markets that have been authorized as Approved Markets for each Underlying Fund, depending on a number of factors, including, but not limited to, asset growth in the Underlying Fund, constraints imposed in Approved Markets, and other characteristics of each such market. The Investment Committee of the Advisor also may authorize other markets for investment in the future, in addition to the Approved Markets identified above, or may remove one or more markets from the list of Approved Markets for an Underlying Fund. Also, an Underlying Fund may continue to hold investments in countries that are not currently designated as Approved Markets, but had been authorized for investment in the past, and may reinvest distributions received in connection with such existing investments in such previously Approved Markets. For a description of the securities approved for investment, see “Approved Markets.”
163
In addition to, or in place of, investments in the Underlying Funds, the World Core Equity Portfolio also is permitted to invest directly in the same types of securities of companies that are described in each Underlying Fund’s Prospectus as eligible investments for the Underlying Fund.
The value criteria used by the Advisor, as described above, generally apply at the time of purchase by the World Core Equity Portfolio or an Underlying Fund. The World Core Equity Portfolio and Underlying Funds are not required to dispose of a security if the security’s issuer does not meet current value criteria. Securities which do meet the value criteria nevertheless may be sold at any time when, in the Advisor’s judgment, circumstances warrant their sale. See “Portfolio Transactions—All Portfolios.“
The Emerging Markets Core Equity Portfolio, an Underlying Fund, may also invest in China A-shares (equity securities of companies listed in China) that are accessible through Stock Connect and variable interest entities (special structures that utilize contractual arrangements to provide exposure to certain Chinese companies).
The World Core Equity Portfolio and each Underlying Fund may purchase or sell futures contracts and options on futures contracts for equity securities and indices to increase or decrease equity market exposure based on actual or expected cash inflows to or outflows from the Portfolio or Underlying Fund. The World Core Equity Portfolio and Underlying Funds do not intend to sell futures contracts to establish short positions in individual securities or to use derivatives for purposes of speculation or leveraging investment returns. The World Core Equity Portfolio and each Underlying Fund may invest in exchange-traded funds (ETFs) for the purposes of gaining exposure to the equity markets, while maintaining liquidity. In addition to money market instruments and other short-term investments, the World Core Equity Portfolio and each Underlying Fund may invest in affiliated and unaffiliated registered and unregistered money market funds. The World Core Equity Portfolio and Underlying Funds may invest in such money market funds and other short-term investments to manage cash pending investment in other securities or to maintain liquidity for the payment of redemptions or other purposes. Investments in ETFs and money market funds may involve a duplication of certain fees and expenses.
Selectively Hedged Global Equity Portfolio
The investment objective of the Selectively Hedged Global Equity Portfolio is to achieve long-term capital appreciation. The Selectively Hedged Global Equity Portfolio is a “fund of funds,” which means that the Portfolio generally allocates its assets among other mutual funds managed by the Advisor although it also has the ability to invest directly in securities and derivatives. The Selectively Hedged Global Equity Portfolio seeks to achieve exposure to a broad portfolio of securities of both U.S. companies and non-U.S. companies associated with countries with developed and emerging markets, including frontier markets (emerging markets in an earlier stage of development), by primarily purchasing shares of U.S. Core Equity 2 Portfolio, International Core Equity Portfolio and Emerging Markets Core Equity Portfolio (the “Underlying Funds”). For a complete description of the investment objectives and policies, portfolio structure and transactions for each of the Underlying Funds included in this Prospectus, see “International Core Equity Portfolio” and “Emerging Markets Core Equity Portfolio.” With respect to the Portfolio’s investment in the U.S. Core Equity 2 Portfolio, see “Investments in Underlying Funds—Domestic Equity Underlying Funds.”
Because many of the Selectively Hedged Global Portfolio’s investments may be denominated in foreign currencies, the Portfolio may also enter into foreign currency forward contracts to attempt to protect against uncertainty in the level of future foreign currency rates, to hedge against fluctuations in currency exchange rates or to transfer balances from one currency to another. Alternatively, the Portfolio may leave all or some of the currency exposure unhedged. The decision to hedge the Portfolio’s currency exposure with respect to a foreign market will be based on, among other things, a comparison of the respective foreign and U.S. short-term interest rates and the Portfolio’s existing exposure to a given foreign currency.
The Selectively Hedged Global Equity Portfolio and each Underlying Fund also may invest in exchange-traded funds (ETFs) for the purposes of gaining exposure to the equity markets, while maintaining liquidity. In addition to money market instruments and other short-term investments, the Selectively Hedged Global Equity Portfolio and each Underlying Fund may invest in affiliated and unaffiliated registered and unregistered money market funds to manage cash pending investment in other securities or to maintain liquidity for the payment of redemptions or other purposes. Investments in ETFs and money market funds may involve a duplication of
164
certain fees and expenses. The Selectively Hedged Global Equity Portfolio and Underlying Funds may lend their portfolio securities to generate additional income.
The Emerging Markets Core Equity Portfolio, an Underlying Fund, may also invest in China A-shares (equity securities of companies listed in China) that are accessible through Stock Connect and variable interest entities (special structures that utilize contractual arrangements to provide exposure to certain Chinese companies).
In addition to, or in place of, investments in the Underlying Funds, the Portfolio also is permitted to invest directly in the same types of securities of companies that are described in each Underlying Fund’s Prospectus as eligible investments for the Underlying Fund.
Emerging Markets
Portfolio
Emerging Markets Value Portfolio
Emerging Markets Small Cap
Portfolio
Emerging Markets Core Equity Portfolio
Emerging Markets ex China
Core Equity Portfolio
Emerging Markets Targeted Value
Portfolio
The investment objective of the Emerging Markets Portfolio, the Emerging Markets Value Portfolio, the Emerging Markets Small Cap Portfolio, the Emerging Markets Core Equity Portfolio, the Emerging Markets ex China Core Equity Portfolio and the Emerging Markets Targeted Value Portfolio is to achieve long-term capital appreciation.
The Emerging Markets Portfolio is a Feeder Portfolio and pursues its objective by investing substantially all of its assets in its corresponding Master Fund, The Emerging Markets Series of the Trust (the “Emerging Markets Series”), which has the same investment objective and policies as the Portfolio. The Emerging Markets Small Cap Portfolio is a Feeder Portfolio and pursues its objective by investing substantially all of its assets in its corresponding Master Fund, The Emerging Markets Small Cap Series of the Trust (the “Emerging Markets Small Cap Series”), which has the same investment objective and policies as the Portfolio. The Emerging Markets Value Portfolio is a Feeder Portfolio and pursues its objective by investing substantially all of its assets in its corresponding Master Fund, Dimensional Emerging Markets Value Fund (the “Emerging Markets Value Fund”), which has the same investment objective and policies as the Portfolio. The Emerging Markets Value Fund pursues its objective through investment primarily in emerging market equity securities. The Emerging Markets Series, the Emerging Markets Small Cap Series, and the Emerging Markets Value Fund are referred to collectively as the “Emerging Markets Master Funds.” Each of the Emerging Markets Master Funds, the Emerging Markets Core Equity Portfolio, the Emerging Markets ex China Core Equity Portfolio and the Emerging Markets Targeted Value Portfolio seeks to achieve its investment objective by investing in companies associated with emerging markets, which may include frontier markets (emerging market countries in an earlier stage of development), designated as Approved Markets by the Investment Committee of the Advisor (For a description of the securities and countries approved for investment, see “Approved Markets”). Each Emerging Markets Master Fund, the Emerging Markets Core Equity Portfolio and the Emerging Markets Targeted Value Portfolio invests its assets primarily in Approved Market equity securities listed on bona fide securities exchanges. The Emerging Markets ex China Core Equity Portfolio invests its assets primarily in Approved Markets equity securities listed on bona fide securities exchanges or actively traded on over-the-counter markets.
Each Emerging Markets Master Fund, the Emerging Markets Core Equity Portfolio and the Emerging Markets Targeted Value Portfolio may also invest in China A-shares (equity securities of companies listed in China) that are accessible through Stock Connect and variable interest entities (special structures that utilize contractual arrangements to provide exposure to certain Chinese companies).
The Emerging Markets Value Fund seeks to achieve its objective by purchasing emerging market equity securities that are deemed by the Advisor to be value stocks at the time of purchase. An equity issuer is considered to have a low relative price (i.e., a value stock) primarily because it has a low price in relation to its book value. In assessing relative price, the Advisor may consider additional factors such as price to cash flow or price to earnings ratios. The Advisor may adjust the representation in the Emerging Markets Value Fund of an eligible company, or exclude a company, after considering such factors as free float, price momentum, trading strategies, liquidity, size, relative price, profitability, investment characteristics, and other factors that the Advisor determines to be appropriate. An equity issuer is considered to have high profitability because it has high
165
earnings or profits from operations in relation to its book value or assets. In assessing a company’s investment characteristics, the Advisor considers ratios such as recent changes in assets divided by total assets. The criteria the Advisor uses for assessing relative price, profitability, and investment characteristics are subject to change from time to time.
The Emerging Markets Core Equity Portfolio and Emerging Markets ex China Core Equity Portfolio will seek to purchase a broad and diverse group of securities, with an increased exposure to securities of smaller capitalization, lower relative price, and higher profitability companies. The Portfolios’ increased exposure to smaller capitalization, lower relative price, and higher profitability companies may be achieved by decreasing the allocation of the Portfolios’ assets to larger capitalization, higher relative price, or lower profitability companies. An equity issuer is considered to have a high relative price (i.e., a growth stock) primarily because it has a high price in relation to its book value. An equity issuer is considered to have a low relative price (i.e., a value stock) primarily because it has a low price in relation to its book value. In assessing relative price, the Advisor may consider additional factors such as price to cash flow or price to earnings ratios. The Advisor may adjust the representation in the Portfolio of an eligible company, or exclude a company, after considering such factors as free float, price momentum, trading strategies, liquidity, size, relative price, profitability, investment characteristics, and other factors that the Advisor determines to be appropriate. An equity issuer is considered to have high profitability because it has high earnings or profits from operations in relation to its book value or assets. In assessing a company’s investment characteristics, the Advisor considers ratios such as recent changes in assets divided by total assets. The criteria the Advisor uses for assessing relative price, profitability and investment characteristics are subject to change from time to time.
As a non-fundamental policy, under normal circumstances, the Emerging Markets ex China Core Equity Portfolio will invest at least 80% of its net assets in emerging markets equity investments that are defined in the Prospectus as Approved Market securities. The Emerging Markets ex China Core Equity Portfolio may gain exposure to companies in Approved Markets by purchasing equity securities in the form of depositary receipts, which may be listed or traded outside the issuer’s domicile country. The Emerging Markets ex China Core Equity Portfolio may purchase or sell futures contracts and options on futures contracts for Approved Market or other equity market securities and indices, including those of the United States, to increase or decrease equity market exposure based on actual or expected cash inflows to or outflows from the Portfolio.
The investment objective of the Emerging Markets Targeted Value Portfolio is to achieve long-term capital appreciation. The Portfolio will seek to achieve its investment objective through exposure to a broad and diverse portfolio of securities, with a focus on small and mid-cap value companies with higher profitability.
The Emerging Markets Targeted Value Portfolio intends to purchase securities of small and mid-sized companies in Approved Markets that the Advisor believes to be value stocks with higher profitability at the time of purchase. An equity issuer is considered to have a low relative price (i.e., a value stock) primarily because it has a low price in relation to its book value. In assessing relative price, the Advisor may consider additional factors such as price to cash flow or price to earnings ratios. The Advisor determines what constitutes a small or mid-sized company on a country-or region-specific basis and based primarily on market capitalization. A company’s market capitalization is the number of its shares outstanding times its price per share. The Advisor may adjust the representation in the Portfolio of an eligible company, or exclude a company, after considering such factors as free float, price momentum, trading strategies, liquidity, size, relative price, profitability, investment characteristics, and other factors that the Advisor determines to be appropriate. An equity issuer is considered to have high profitability because it has high earnings or profits from operations in relation to its book value or assets. In assessing a company’s investment characteristics, the Advisor considers ratios such as recent changes in assets divided by total assets. The criteria the Advisor uses for assessing relative price, profitability and investment characteristics are subject to change from time to time.
The Emerging Markets Targeted Value Portfolio may also invest as a non-principal investment strategy in exchange-traded funds (ETFs) that provide exposure to Approved Markets or other equity markets, including the United States, for the purposes of gaining exposure to the equity markets while maintaining liquidity. In addition to money market instruments and other short-term investments, the Emerging Markets Targeted Value Portfolio may invest in affiliated and unaffiliated registered and unregistered money market funds to manage cash pending investment in other securities or to maintain liquidity for the payment of redemptions or other purposes. Investments in money market funds may involve a duplication of certain fees and expenses.
166
In determining what countries are eligible markets for the Emerging Markets Master Funds, the Emerging Markets Core Equity Portfolio, the Emerging Markets ex China Core Equity Portfolio and the Emerging Markets Targeted Value Portfolio, the Advisor may consider various factors, including without limitation, the data, analysis, and classification of countries published or disseminated by the International Bank for Reconstruction and Development (commonly known as the World Bank), the International Finance Corporation, FTSE International, and MSCI. Approved Markets may not include all such emerging markets. In determining whether to approve markets for investment, the Advisor may take into account, among other things, market liquidity, relative availability of investor information, government regulation, including fiscal and foreign exchange repatriation rules and the availability of other access to these markets for the Emerging Markets Master Funds, the Emerging Markets Core Equity Portfolio, the Emerging Markets ex China Core Equity Portfolio and the Emerging Markets Targeted Value Portfolio.
Pending the investment of new capital in Approved Markets securities, the Emerging Markets Master Funds, the Emerging Markets Core Equity Portfolio, the Emerging Markets ex China Core Equity Portfolio and the Emerging Markets Targeted Value Portfolio will typically invest in money market instruments or other highly liquid debt instruments including those denominated in U.S. dollars (including, without limitation, repurchase agreements). In addition, each Emerging Markets Master Fund, the Emerging Markets Core Equity Portfolio, the Emerging Markets ex China Core Equity Portfolio and the Emerging Markets Targeted Value Portfolio, may, for liquidity, or for temporary defensive purposes during periods in which market or economic or political conditions warrant, purchase highly liquid debt instruments or hold freely convertible currencies, although each of the Emerging Markets Master Funds, the Emerging Markets Core Equity Portfolio, the Emerging Markets ex China Core Equity Portfolio and the Emerging Markets Targeted Value Portfolio do not expect the aggregate of all such amounts to exceed 20% of their net assets under normal circumstances.
The Emerging Markets Master Funds, Emerging Markets Core Equity Portfolio, Emerging Markets ex China Core Equity Portfolio and the Emerging Markets Targeted Value Portfolio also may invest up to 10% of their total assets in shares of other investment companies that invest in one or more Approved Markets, although they intend to do so only where access to those markets is otherwise significantly limited. In some Approved Markets, it may be necessary or advisable for an Emerging Markets Master Fund, the Emerging Markets Core Equity Portfolio, the Emerging Markets ex China Core Equity Portfolio or the Emerging Markets Targeted Value Portfolio to establish a wholly owned subsidiary or a trust for the purpose of investing in the local markets.
The Emerging Markets Series and Emerging Markets Small Cap Series seek broad market diversification. The decision to include or exclude the shares of an issuer will be made primarily on the basis of such issuer’s relative market capitalization determined by reference to other companies located in the same country. Company size is measured in terms of reference to other companies located in the same country and in terms of local currencies in order to eliminate the effect of variations in currency exchange rates. In addition, the Emerging Markets Series may consider a company’s price in relation to its book value (a “price to book ratio”).
Generally, changes in the composition and relative ranking (in terms of price to book ratio) of the stocks which are eligible for purchase by the Emerging Markets Value Fund and the Emerging Markets Targeted Value Portfolio take place with every trade when the securities markets are open for trading due primarily to price changes of such securities. On a periodic basis, the Advisor will identify value stocks that are eligible for investment and re-evaluate eligible value stocks no less than semi-annually.
With respect to the Emerging Markets Series, the Advisor may adjust the representation in the Series of an eligible company, or exclude a company, after considering such factors as free float, price momentum, trading strategies, liquidity, size, relative price, profitability, and other factors that the Advisor determines to be appropriate. For the Emerging Markets Small Cap Series, the Advisor may also adjust the representation in the Series of an eligible company, or exclude a company, after considering such factors as free float, price momentum, trading strategies, liquidity, size, relative price, profitability, investment characteristics, and other factors that the Advisor determines to be appropriate. An equity issuer is considered to have a low relative price (i.e., a value stock) primarily because it has a low price in relation to its book value. In assessing relative price, the Advisor may consider additional factors such as price to cash flow or price to earnings ratios. An equity issuer is considered to have high profitability because it has high earnings or profits from operations in relation to its book value or assets. In assessing a company’s investment characteristics, the Advisor considers ratios such as
167
recent changes in assets divided by total assets. The criteria the Advisor uses for assessing relative price, profitability, and investment characteristics are subject to change from time to time.
The Emerging Markets Master Funds, the Emerging Markets Core Equity Portfolio, the Emerging Markets ex China Core Equity Portfolio and the Emerging Markets Targeted Value Portfolio do not seek current income as an investment objective, and investments will not be based upon an issuer’s dividend payment policy or record. However, many of the companies whose securities will be included in an Emerging Markets Master Fund, the Emerging Markets Core Equity Portfolio, the Emerging Markets ex China Core Equity Portfolio or the Emerging Markets Targeted Value Portfolio do pay dividends. It is anticipated, therefore, that the Emerging Markets Master Funds, the Emerging Markets Core Equity Portfolio, the Emerging Markets ex China Core Equity Portfolio and the Emerging Markets Targeted Value Portfolio will receive dividend income.
The Advisor may consider a small capitalization company’s investment characteristics as compared to other eligible companies when making investment decisions and may exclude a small capitalization company with high investment as measured by the company’s recent asset growth. A Portfolio or Master Fund will generally not exclude more than 5% of the eligible small capitalization company universe within each eligible country based on such investment characteristics. With respect to the Emerging Markets Value Portfolio, Emerging Markets Small Cap Portfolio, Emerging Markets Core Equity Portfolio, Emerging Markets ex China Core Equity Portfolio and Emerging Markets Targeted Value Portfolio, the Advisor may decrease the amount that a Portfolio or Master Fund invests in eligible small capitalization companies that have lower profitability and/or higher relative prices.
The Emerging Markets Master Funds, Emerging Markets Core Equity Portfolio and Emerging Markets ex China Core Equity Portfolio may also invest in exchange-traded funds (ETFs) that provide exposure to Approved Markets or other equity markets, including the United States, for the purposes of gaining exposure to the equity markets while maintaining liquidity. In addition to money market instruments and other short-term investments, the Emerging Markets Master Funds and Emerging Markets Core Equity Portfolio and the Emerging Markets ex China Core Equity Portfolio may invest in affiliated and unaffiliated registered and unregistered money market funds to manage cash pending investment in other securities or to maintain liquidity for the payment of redemptions or other purposes. Investments in ETFs and money market funds may involve a duplication of certain fees and expenses.
INVESTMENTS IN UNDERLYING FUNDS
Investment Objectives, Strategies and policies of the Underlying Funds
The following is a summary of the investment strategies, objectives and policies of the Underlying Funds in which the Portfolios invest as of the date of this Prospectus that are not described in this Prospectus. Additional information concerning the investment policies of the Underlying Funds may be found in the Portfolios’ Statement of Additional Information (“SAI”).
Domestic Equity Underlying Funds
DFA Real Estate Securities Portfolio—The investment objective of the DFA Real Estate Securities Portfolio is to achieve long-term capital appreciation. The DFA Real Estate Securities Portfolio, using a market capitalization weighted approach, purchases readily marketable equity securities of companies whose principal activities include ownership, management, development, construction, or sale of residential, commercial or industrial real estate. The Portfolio will principally invest in equity securities of companies in certain REITs and companies engaged in residential construction and firms, except partnerships, whose principal business is to develop commercial property. A company’s market capitalization is the number of its shares outstanding times its price per share. Under a market capitalization weighted approach, companies with higher market capitalizations generally represent a larger proportion of the Portfolio than companies with relatively lower market capitalizations. The Advisor may adjust the representation in the DFA Real Estate Securities Portfolio of an eligible company, or exclude a company, after considering such factors as free float, price momentum, trading strategies, liquidity, size, relative price, profitability, and other factors that the Advisor determines to be appropriate. An equity issuer is considered to have a low relative price (i.e., a value stock) primarily because it has a low price in relation to its book value. In assessing relative price, the Advisor may consider additional factors such as price to cash flow or price to earnings ratios. An equity issuer is considered to have high
168
profitability because it has high earnings or profits from operations in relation to its book value or assets. The criteria the Advisor uses for assessing relative price and profitability are subject to change from time to time.
U.S. Core Equity 1 Portfolio—The investment objective of the U.S. Core Equity 1 Portfolio is to achieve long-term capital appreciation. The U.S. Core Equity 1 Portfolio is designed to purchase a broad and diverse group of securities of U.S. companies. The Portfolio invests in companies of all sizes, with increased exposure to smaller capitalization, lower relative price, and higher profitability companies as compared to their representation in the U.S. Universe. The Advisor generally defines the U.S. Universe as a market capitalization weighted set (e.g., the larger the company, the greater the proportion of the U.S. Universe it represents) of U.S. operating companies listed on a securities exchange in the United States that is deemed appropriate by the Advisor. The Portfolio’s increased exposure to smaller capitalization, lower relative price, and higher profitability companies may be achieved by decreasing the allocation of the Portfolio’s assets to larger capitalization, higher relative price, or lower profitability companies relative to their weight in the U.S. Universe. An equity issuer is considered to have a high relative price (i.e., a growth stock) primarily because it has a high price in relation to its book value. An equity issuer is considered to have a low relative price (i.e., a value stock) primarily because it has a low price in relation to its book value. In assessing relative price, the Advisor may consider additional factors such as price to cash flow or price to earnings ratios. An equity issuer is considered to have high profitability because it has high earnings or profits from operations in relation to its book value or assets. The criteria the Advisor uses for assessing relative price and profitability are subject to change from time to time.
The Advisor may also increase or reduce the U.S. Core Equity 1 Portfolio’s exposure to an eligible company, or exclude a company, based on shorter-term considerations, such as a company’s price momentum and investment characteristics. In assessing a company’s investment characteristics, the Advisor considers ratios such as recent changes in assets divided by total assets. The criteria the Advisor uses for assessing a company’s investment characteristics are subject to change from time to time. In addition, the Advisor seeks to reduce trading costs using a flexible trading approach that looks for opportunities to participate in the available market liquidity, while managing turnover and explicit transaction costs.
The percentage allocation of the assets of the Portfolio to securities of the largest U.S. high relative price companies will generally be reduced from between 2.5% and 25% of their percentage weight in the U.S. Universe. For example, as of December 31, 2022, securities of the largest U.S. high relative price companies comprised 44% of the U.S. Universe and the Advisor allocated approximately 35% of the Portfolio to securities of the largest U.S. high relative price companies. The percentage by which the Portfolio’s allocation to securities of the largest U.S. high relative price companies is reduced will change due to market movements.
U.S. Core Equity 2 Portfolio—The investment objective of the U.S. Core Equity 2 Portfolio is to achieve long-term capital appreciation. The U.S. Core Equity 2 Portfolio is designed to purchase a broad and diverse group of securities of U.S. companies. The Portfolio invests in companies of all sizes, with increased exposure to smaller capitalization, lower relative price, and higher profitability companies as compared to their representation in the U.S. Universe. The Advisor generally defines the U.S. Universe as a market capitalization weighted set (e.g., the larger the company, the greater the proportion of the U.S. Universe it represents) of U.S. operating companies listed on a securities exchange in the United States that is deemed appropriate by the Advisor. The Portfolio’s increased exposure to smaller capitalization, lower relative price, and higher profitability companies may be achieved by decreasing the allocation of the Portfolio’s assets to larger capitalization, higher relative price, or lower profitability companies relative to their weight in the U.S. Universe. An equity issuer is considered to have a high relative price (i.e., a growth stock) primarily because it has a high price in relation to its book value. An equity issuer is considered to have a low relative price (i.e., a value stock) primarily because it has a low price in relation to its book value. In assessing relative price, the Advisor may consider additional factors such as price to cash flow or price to earnings ratios. An equity issuer is considered to have high profitability because it has high earnings or profits from operations in relation to its book value or assets. The criteria the Advisor uses for assessing relative price and profitability are subject to change from time to time.
The Advisor may also increase or reduce the U.S. Core Equity 2 Portfolio’s exposure to an eligible company, or exclude a company, based on shorter-term considerations, such as a company’s price momentum and investment characteristics. In assessing a company’s investment characteristics, the Advisor considers ratios such as recent changes in assets divided by total assets. The criteria the Advisor uses for assessing a company’s investment characteristics are subject to change from time to time. In addition, the Advisor seeks to reduce
169
trading costs using a flexible trading approach that looks for opportunities to participate in the available market liquidity, while managing turnover and explicit transaction costs.
The percentage allocation of the assets of the Portfolio to securities of the largest U.S. high relative price companies will generally be reduced from between 5% and 35% of their percentage weight in the U.S. Universe. For example, as of December 31, 2022, securities of the largest U.S. high relative price companies comprised 44% of the U.S. Universe and the Advisor allocated approximately 31% of the Portfolio to securities of the largest U.S. high relative price companies. The percentage by which the Portfolio’s allocation to securities of the largest U.S. high relative price companies is reduced will change due to market movements.
U.S. Small Cap Portfolio—The U.S. Small Cap Portfolio, using a market capitalization weighted approach, is designed to purchase a broad and diverse group of readily marketable securities of U.S. small cap companies. A company’s market capitalization is the number of its shares outstanding times its price per share. Under a market capitalization weighted approach, companies with higher market capitalizations generally represent a larger proportion of the Portfolio than companies with relatively lower market capitalizations. The Portfolio may emphasize certain stocks, including smaller capitalization companies, lower relative price stocks, and/or higher profitability stocks as compared to their representation in the small-cap value segment of the U.S. market. An equity issuer is considered to have a low relative price (i.e., a value stock) primarily because it has a low price in relation to its book value. In assessing relative price, the Advisor may consider additional factors such as price to cash flow or price to earnings ratios. An equity issuer is considered to have high profitability because it has high earnings or profits from operations in relation to its book value or assets. The criteria the Advisor uses for assessing relative price and profitability are subject to change from time to time.
As a non-fundamental policy, under normal circumstances, the U.S. Small Cap Portfolio will invest at least 80% of its net assets in securities of small cap U.S. companies. As of the date of this Prospectus, for purposes of the U.S. Small Cap Portfolio, the Advisor considers small cap companies to be companies whose market capitalizations are generally in the lowest 90% of total market capitalization or companies whose market capitalizations are smaller than the 1,000th largest U.S. company, whichever results in the higher market capitalization break. Total market capitalization is based on the market capitalization of eligible U.S. operating companies listed on a securities exchange in the United States that is deemed appropriate by the Advisor. Under the Advisor’s market capitalization guidelines described above, based on market capitalization data as of December 31, 2022, the market capitalization of a small cap company would be below $7,650 million. This threshold will change due to market conditions.
The Advisor may also increase or reduce the U.S. Small Cap Value Portfolio’s exposure to an eligible company, or exclude a company, based on shorter-term considerations, such as a company’s price momentum and investment characteristics. In assessing a company’s investment characteristics, the Advisor considers ratios such as recent changes in assets divided by total assets. The criteria the Advisor uses for assessing a company’s investment characteristics are subject to change from time to time. In addition, the Advisor seeks to reduce trading costs using a flexible trading approach that looks for opportunities to participate in the available market liquidity, while managing turnover and explicit transaction costs.
MARKET CAPITALIZATION WEIGHTED APPROACH
The portfolio structures of the DFA International Real Estate Securities Portfolio, DFA Global Real Estate Securities Portfolio, each International Small Company Portfolio Underlying Fund and the DFA International Small Cap Value Portfolio involve market capitalization weighting in determining individual security weights and, where applicable, country or region weights. Market capitalization weighting means each security is generally purchased based on the issuer’s relative market capitalization. Market capitalization weighting may be modified by the Advisor for a variety of reasons. With respect to the DFA International Real Estate Securities Portfolio and DFA Global Real Estate Securities Portfolio, the Advisor may adjust the representation in a Portfolio of an eligible company, or exclude a company, after considering such factors as free float, price momentum, trading strategies, liquidity, size, relative price, profitability, and other factors that the Advisor determines to be appropriate. With respect to each International Small Company Portfolio Underlying Fund and the DFA International Small Cap Value Portfolio, the Advisor may adjust the representation in a Portfolio or Underlying Fund of an eligible company, or exclude a company, after considering such factors as free float, price momentum, trading strategies, liquidity, size, relative price, profitability, investment characteristics, and other factors that the Advisor determines
170
to be appropriate. An equity issuer is considered to have high profitability because it has high earnings or profits from operations in relation to its book value or assets. In assessing a company’s investment characteristics, the Advisor considers ratios such as recent changes in assets divided by total assets. The criteria the Advisor uses for assessing profitability and investment characteristics are subject to change from time to time. The Advisor may deviate from market capitalization weighting to limit or fix the exposure of a Portfolio, Underlying Fund, or Master Fund to a particular issuer to a maximum proportion of the assets of the Portfolio, Underlying Fund, or Master Fund. The Advisor may exclude the stock of a company that meets applicable market capitalization criterion if the Advisor determines, in its judgment, that the purchase of such stock is inappropriate in light of other conditions. With respect to each International Small Company Portfolio Underlying Fund and the DFA International Small Cap Value Portfolio, the Advisor may decrease the amount that a Portfolio or Underlying Fund invests in eligible small capitalization companies that have lower profitability and/or higher relative prices. These adjustments will result in a deviation from traditional market capitalization weighting.
Adjustment for free float modifies market capitalization weighting to exclude the share capital of a company that is not freely available for trading in the public equity markets. For example, the following types of shares may be excluded: (i) those held by strategic investors (such as governments, controlling shareholders and management), (ii) treasury shares, or (iii) shares subject to foreign ownership restrictions.
Furthermore, the Advisor may reduce the relative amount of any security held in order to retain sufficient portfolio liquidity. A portion, but generally not in excess of 20% of assets, may be invested in interest bearing obligations, such as money market instruments, thereby causing further deviation from market capitalization weighting. A further deviation may occur due to holdings in securities received in connection with corporate actions.
Block purchases of eligible securities may be made at opportune prices, even though such purchases exceed the number of shares that, at the time of purchase, adherence to a market capitalization weighted approach would otherwise require. In addition, securities eligible for purchase or otherwise represented in a Portfolio or Master Fund may be acquired in exchange for the issuance of shares. See “PURCHASE OF SHARES—In-Kind Purchases.” While such transactions might cause a deviation from market capitalization weighting, they would ordinarily be made in anticipation of further growth of assets.
Generally, changes in the composition and relative ranking (in terms of market capitalization) of the stocks that are eligible for purchase take place with every trade when the securities markets are open for trading due, primarily, to price changes of such securities. On at least a semi-annual basis, the Advisor will identify companies whose stock is eligible for investment by a Portfolio or Master Fund. Additional investments generally will not be made in securities that have changed in value sufficiently to be excluded from the Advisor’s then current market capitalization requirement for eligible portfolio securities. This may result in further deviation from market capitalization weighting. Such deviation could be substantial if a significant amount of holdings of a Portfolio or Master Fund change in value sufficiently to be excluded from the requirement for eligible securities, but not by a sufficient amount to warrant their sale.
Country weights may be based on the total market capitalization of companies within each country. The country weights may take into consideration the free float of companies within a country or whether these companies are eligible to be purchased for the particular strategy. In addition, to maintain a satisfactory level of diversification, the Investment Committee may limit or fix the exposure to a particular country or region to a maximum proportion of the assets of that vehicle. Country weights may also vary due to general day-to-day trading patterns and price movements. The weighting of countries may vary from their weighting in published international indices.
PORTFOLIO CONSTRUCTION—INTERNATIONAL SMALL COMPANY FUNDS
Each of the International Small Company Portfolios and the International Small Company Portfolio Underlying Funds (collectively the “International Small Company Funds”) intends to invest in the securities of eligible companies using a market capitalization weighted approach. See “Market Capitalization Weighted Approach.” The following discussion applies to the investment policies of the International Small Company Funds.
171
The decision to include or exclude the shares of an issuer will generally be made on the basis of such issuer’s relative market capitalization determined by reference to other companies located in the same country or region. Company size is measured in terms of local currencies in order to eliminate the effect of variations in currency exchange rates.
If securities must be sold in order to obtain funds to make redemption payments, such securities may be repurchased, as additional cash becomes available. In most instances, however, management would anticipate selling securities which had appreciated sufficiently to be eligible for sale and, therefore, would not need to repurchase such securities.
Generally, current income is not sought as an investment objective and investments will not be based upon an issuer’s dividend payment policy or record. However, many of the companies whose securities will be selected for investment do pay dividends. It is anticipated, therefore, that dividend income will be received.
PORTFOLIO TRANSACTIONS—ALL PORTFOLIOS
In general, securities will not be purchased or sold based on the prospects for the economy, the securities markets or the individual issuers whose shares are eligible for purchase. Securities which have depreciated in value since their acquisition will not be sold solely because prospects for the issuer are not considered attractive or due to an expected or realized decline in securities prices in general. Securities generally will not be sold solely to realize short-term profits, but when circumstances warrant, they may be sold without regard to the length of time held. Securities, including those eligible for purchase, may be disposed of, however, at any time when, in the Advisor’s judgment, circumstances warrant their sale, including but not limited to tender offers, mergers and similar transactions, or bids made for block purchases at opportune prices. Generally, securities will be purchased with the expectation that they will be held for longer than one year and will be held until such time as they are no longer considered an appropriate holding in light of the investment policy of each Portfolio, Underlying Fund, and Master Fund.
In attempting to respond to adverse market, economic, political, or other conditions, a Portfolio, Underlying Fund, or Master Fund may, from time to time, invest its assets in a temporary defensive manner that is inconsistent with the Portfolio’s, Underlying Fund’s, or Master Fund’s principal investment strategies. In these circumstances, the Portfolio, Underlying Fund, or Master Fund (and in turn, its corresponding Feeder Portfolio) may be unable to achieve its investment objective.
ADDITIONAL INFORMATION REGARDING INVESTMENT RISKS
Because the value of your investment in a Portfolio will fluctuate, there is the risk that you will lose money. An investment in a Portfolio is not a deposit of a bank and is not insured or guaranteed by the Federal Deposit Insurance Corporation or any other government agency. The following is a description of principal risks of investing in the Portfolios.
The investment performance of each Portfolio that operates as a “Fund of Funds” is affected by the investment performance of the Underlying Funds in which the Portfolio invests. Each Fund of Funds also indirectly pays its proportionate share of the expenses of the Underlying Funds in which it invests. The ability of each Fund of Funds to achieve its investment objective depends on the ability of the Underlying Funds to meet their investment objectives and on the Advisor’s decisions regarding the allocation of the Portfolio’s assets among the Underlying Funds. Through its investments in the Underlying Funds, each Fund of Funds is subject to the risks of the Underlying Funds’ investments. The following includes a description of principal risks of each Fund of Fund and its Underlying Funds.
172
|
|
|
|
|
|
|
|
|
|
|
|
|
|
|
| |||||||||||||||||||||||||||||||||||
|
Large
Cap |
DFA |
International |
Global |
International |
Japanese |
Asia
Pacific | |||||||||||||||||||||||||||||||||||||||||||
|
Asia Pacific Market Risk |
|
|
|
|
|
|
|
|
|
|
|
|
|
|
X |
||||||||||||||||||||||||||||||||||
|
| |||||||||||||||||||||||||||||||||||||||||||||||||
|
China Investments Risk |
|
|
X |
|
|
X |
|
|
X |
X |
|
X |
|
|
|
X |
|||||||||||||||||||||||||||||||||
|
| |||||||||||||||||||||||||||||||||||||||||||||||||
|
Cyber Security Risk |
|
|
X |
|
|
X |
|
|
X |
|
|
X |
|
|
X |
|
|
X |
|
|
X |
||||||||||||||||||||||||||||
|
| |||||||||||||||||||||||||||||||||||||||||||||||||
|
Depositary Receipts Risk |
|
|
X |
|
|
X |
|
|
X |
|
|
X |
|
|
X |
|
|
X |
|
|
X |
||||||||||||||||||||||||||||
|
| |||||||||||||||||||||||||||||||||||||||||||||||||
|
Derivatives Risk |
|
|
X |
|
|
X |
|
|
X |
|
|
X |
|
|
X |
|
|
X |
|
|
X |
||||||||||||||||||||||||||||
|
| |||||||||||||||||||||||||||||||||||||||||||||||||
|
Emerging Markets Risk |
|
|
|
|
|
|
|
|
X |
|
|
|
|
|
| ||||||||||||||||||||||||||||||||||
|
| |||||||||||||||||||||||||||||||||||||||||||||||||
|
Equity Market Risk |
|
|
X |
|
|
X |
|
|
X |
|
|
X |
|
|
X |
|
|
X |
|
|
X |
||||||||||||||||||||||||||||
|
| |||||||||||||||||||||||||||||||||||||||||||||||||
|
European Market Risk |
|
|
|
|
|
|
|
|
|
|
|
|
|
| |||||||||||||||||||||||||||||||||||
|
| |||||||||||||||||||||||||||||||||||||||||||||||||
|
Foreign Securities and Currencies Risk |
|
|
X |
|
|
X |
|
|
X |
|
|
X |
|
|
X |
|
|
X |
|
|
X |
||||||||||||||||||||||||||||
|
| |||||||||||||||||||||||||||||||||||||||||||||||||
|
Fund of Funds Risk |
|
|
|
|
|
|
|
|
X |
|
|
X |
|
|
|
| |||||||||||||||||||||||||||||||||
|
| |||||||||||||||||||||||||||||||||||||||||||||||||
|
Japan Market Risk |
|
|
|
|
|
|
|
|
|
|
|
|
X |
|
| ||||||||||||||||||||||||||||||||||
|
| |||||||||||||||||||||||||||||||||||||||||||||||||
|
Operational Risk |
|
|
X |
|
|
X |
|
|
X |
|
|
X |
|
|
X |
|
|
X |
|
|
X |
||||||||||||||||||||||||||||
|
| |||||||||||||||||||||||||||||||||||||||||||||||||
|
Profitability Investment Risk |
|
|
X |
|
|
X |
|
|
X |
|
|
X |
|
|
X |
|
|
X |
|
|
X |
||||||||||||||||||||||||||||
|
| |||||||||||||||||||||||||||||||||||||||||||||||||
|
Risks of Concentrating in the Real Estate Industry |
|
|
|
|
|
|
|
|
|
|
|
|
|
| |||||||||||||||||||||||||||||||||||
|
| |||||||||||||||||||||||||||||||||||||||||||||||||
|
Securities Lending Risk |
|
|
X |
|
|
X |
|
|
X |
|
|
X |
|
|
X |
|
|
X |
|
|
X |
||||||||||||||||||||||||||||
|
| |||||||||||||||||||||||||||||||||||||||||||||||||
|
Small and Mid-Cap Company Risk |
|
|
|
|
|
|
X |
|
|
|
|
|
|
|
| ||||||||||||||||||||||||||||||||||
|
| |||||||||||||||||||||||||||||||||||||||||||||||||
|
Small Company Risk |
|
|
|
|
|
|
|
|
X |
|
|
X |
|
|
X |
|
|
X |
|||||||||||||||||||||||||||||||
|
| |||||||||||||||||||||||||||||||||||||||||||||||||
|
United Kingdom Market Risk |
|
|
|
|
|
|
|
|
|
|
|
|
|
| |||||||||||||||||||||||||||||||||||
|
| |||||||||||||||||||||||||||||||||||||||||||||||||
|
Value Investment Risk |
|
|
X |
|
|
X |
|
|
X |
|
|
X |
|
|
X |
|
|
X |
|
|
X |
||||||||||||||||||||||||||||
|
| |||||||||||||||||||||||||||||||||||||||||||||||||
173
|
|
|
|
|
|
|
|
|
|
|
|
|
|
|
| |||||||||||||||||||||||||||||||||||
|
United |
Continental |
DFA |
DFA |
DFA |
International |
International | |||||||||||||||||||||||||||||||||||||||||||
|
Asia Pacific Market Risk |
|
|
|
|
|
|
|
|
|
|
|
|
|
| |||||||||||||||||||||||||||||||||||
|
| |||||||||||||||||||||||||||||||||||||||||||||||||
|
China Investments Risk |
|
|
|
|
|
|
X |
|
|
X |
|
|
X |
|
|
X |
|
|
X |
||||||||||||||||||||||||||||||
|
| |||||||||||||||||||||||||||||||||||||||||||||||||
|
Cyber Security Risk |
|
|
X |
|
|
X |
|
|
X |
|
|
X |
|
|
X |
|
|
X |
|
|
X |
||||||||||||||||||||||||||||
|
| |||||||||||||||||||||||||||||||||||||||||||||||||
|
Depositary Receipts Risk |
|
|
X |
|
|
X |
|
|
X |
|
|
|
|
X |
|
|
X |
|
|
X |
|||||||||||||||||||||||||||||
|
| |||||||||||||||||||||||||||||||||||||||||||||||||
|
Derivatives Risk |
|
|
X |
|
|
X |
|
|
X |
|
|
X |
|
|
X |
|
|
X |
|
|
X |
||||||||||||||||||||||||||||
|
| |||||||||||||||||||||||||||||||||||||||||||||||||
|
Emerging Markets Risk |
|
|
|
|
|
|
X |
|
|
X |
|
|
|
|
|
| |||||||||||||||||||||||||||||||||
|
| |||||||||||||||||||||||||||||||||||||||||||||||||
|
Equity Market Risk |
|
|
X |
|
|
X |
|
|
X |
|
|
X |
|
|
X |
|
|
X |
|
|
X |
||||||||||||||||||||||||||||
|
| |||||||||||||||||||||||||||||||||||||||||||||||||
|
European Market Risk |
|
|
|
|
X |
|
|
|
|
|
|
|
|
|
| ||||||||||||||||||||||||||||||||||
|
| |||||||||||||||||||||||||||||||||||||||||||||||||
|
Foreign Securities and Currencies Risk |
|
|
X |
|
|
X |
|
|
X |
|
|
X |
|
|
X |
|
|
X |
|
|
X |
||||||||||||||||||||||||||||
|
| |||||||||||||||||||||||||||||||||||||||||||||||||
|
Fund of Funds Risk |
|
|
|
|
|
|
|
|
X |
|
|
|
|
|
| ||||||||||||||||||||||||||||||||||
|
| |||||||||||||||||||||||||||||||||||||||||||||||||
|
Japan Market Risk |
|
|
|
|
|
|
|
|
|
|
|
|
|
| |||||||||||||||||||||||||||||||||||
|
| |||||||||||||||||||||||||||||||||||||||||||||||||
|
Operational Risk |
|
|
X |
|
|
X |
|
|
X |
|
|
X |
|
|
X |
|
|
X |
|
|
X |
||||||||||||||||||||||||||||
|
| |||||||||||||||||||||||||||||||||||||||||||||||||
|
Profitability Investment Risk |
|
|
X |
|
|
X |
|
|
|
|
|
|
X |
|
|
X |
|
|
X |
||||||||||||||||||||||||||||||
|
| |||||||||||||||||||||||||||||||||||||||||||||||||
|
Risks of Concentrating in the Real Estate Industry |
|
|
|
|
|
|
X |
|
|
X |
|
|
|
|
|
| |||||||||||||||||||||||||||||||||
|
| |||||||||||||||||||||||||||||||||||||||||||||||||
|
Securities Lending Risk |
|
|
X |
|
|
X |
|
|
X |
|
|
X |
|
|
X |
|
|
X |
|
|
X |
||||||||||||||||||||||||||||
|
| |||||||||||||||||||||||||||||||||||||||||||||||||
|
Small and Mid-Cap Company Risk |
|
|
|
|
|
|
X |
|
|
X |
|
|
|
|
X |
|
| ||||||||||||||||||||||||||||||||
|
| |||||||||||||||||||||||||||||||||||||||||||||||||
|
Small Company Risk |
|
|
X |
|
|
X |
|
|
|
|
|
|
X |
|
|
|
| ||||||||||||||||||||||||||||||||
|
| |||||||||||||||||||||||||||||||||||||||||||||||||
|
United Kingdom Market Risk |
|
|
X |
|
|
|
|
|
|
|
|
|
|
|
| ||||||||||||||||||||||||||||||||||
|
| |||||||||||||||||||||||||||||||||||||||||||||||||
|
Value Investment Risk |
|
|
X |
|
|
X |
|
|
|
|
|
|
X |
|
|
X |
|
|
X |
||||||||||||||||||||||||||||||
|
| |||||||||||||||||||||||||||||||||||||||||||||||||
174
|
|
|
|
|
|
|
|
|
|
|
|
|
|
|
| |||||||||||||||||||||||||||||||||||
|
World
ex |
World |
World |
Selectively |
Emerging |
Emerging |
Emerging | |||||||||||||||||||||||||||||||||||||||||||
|
Asia Pacific Market Risk |
|
|
|
|
|
|
|
|
|
|
|
|
|
| |||||||||||||||||||||||||||||||||||
|
| |||||||||||||||||||||||||||||||||||||||||||||||||
|
China Investments Risk |
|
|
X |
|
|
X |
|
|
X |
X |
|
X |
|
|
X |
|
|
X |
|||||||||||||||||||||||||||||||
|
| |||||||||||||||||||||||||||||||||||||||||||||||||
|
Cyber Security Risk |
|
|
X |
|
|
X |
|
|
X |
|
|
X |
|
|
X |
|
|
X |
|
|
X |
||||||||||||||||||||||||||||
|
| |||||||||||||||||||||||||||||||||||||||||||||||||
|
Depositary Receipts Risk |
|
|
X |
|
|
X |
|
|
X |
|
|
X |
|
|
X |
|
|
X |
|
|
X |
||||||||||||||||||||||||||||
|
| |||||||||||||||||||||||||||||||||||||||||||||||||
|
Derivatives Risk |
|
|
X |
|
|
X |
|
|
X |
|
|
X |
|
|
X |
|
|
X |
|
|
X |
||||||||||||||||||||||||||||
|
| |||||||||||||||||||||||||||||||||||||||||||||||||
|
Emerging Markets Risk |
|
|
X |
|
|
X |
|
|
X |
|
|
X |
|
|
X |
|
|
X |
|
|
X |
||||||||||||||||||||||||||||
|
| |||||||||||||||||||||||||||||||||||||||||||||||||
|
Equity Market Risk |
|
|
X |
|
|
X |
|
|
X |
|
|
X |
|
|
X |
|
|
X |
|
|
X |
||||||||||||||||||||||||||||
|
| |||||||||||||||||||||||||||||||||||||||||||||||||
|
European Market Risk |
|
|
|
|
|
|
|
|
|
|
|
|
|
| |||||||||||||||||||||||||||||||||||
|
| |||||||||||||||||||||||||||||||||||||||||||||||||
|
Foreign Securities and Currencies Risk |
|
|
X |
|
|
X |
|
|
X |
|
|
X |
|
|
X |
|
|
X |
|
|
X |
||||||||||||||||||||||||||||
|
| |||||||||||||||||||||||||||||||||||||||||||||||||
|
Fund of Funds Risk |
|
|
X |
|
|
|
|
X |
|
|
X |
|
|
|
|
|
| ||||||||||||||||||||||||||||||||
|
| |||||||||||||||||||||||||||||||||||||||||||||||||
|
Japan Market Risk |
|
|
|
|
|
|
|
|
|
|
|
|
|
| |||||||||||||||||||||||||||||||||||
|
| |||||||||||||||||||||||||||||||||||||||||||||||||
|
Operational Risk |
|
|
X |
|
|
X |
|
|
X |
|
|
X |
|
|
X |
|
|
X |
|
|
X |
||||||||||||||||||||||||||||
|
| |||||||||||||||||||||||||||||||||||||||||||||||||
|
Profitability Investment Risk |
|
|
X |
|
|
X |
|
|
X |
|
|
X |
|
|
X |
|
|
X |
|
|
X |
||||||||||||||||||||||||||||
|
| |||||||||||||||||||||||||||||||||||||||||||||||||
|
Risks of Concentrating in the Real Estate Industry |
|
|
|
|
|
|
|
|
|
|
|
|
|
| |||||||||||||||||||||||||||||||||||
|
| |||||||||||||||||||||||||||||||||||||||||||||||||
|
Securities Lending Risk |
|
|
X |
|
|
X |
|
|
X |
|
|
X |
|
|
X |
|
|
X |
|
|
X |
||||||||||||||||||||||||||||
|
| |||||||||||||||||||||||||||||||||||||||||||||||||
|
Small and Mid-Cap Company Risk |
|
|
X |
|
|
X |
|
|
X |
|
|
X |
|
|
|
|
X |
|
|
X |
|||||||||||||||||||||||||||||
|
| |||||||||||||||||||||||||||||||||||||||||||||||||
|
Small Company Risk |
|
|
|
|
|
|
|
|
|
|
|
|
|
| |||||||||||||||||||||||||||||||||||
|
| |||||||||||||||||||||||||||||||||||||||||||||||||
|
United Kingdom Market Risk |
|
|
|
|
|
|
|
|
|
|
|
|
|
| |||||||||||||||||||||||||||||||||||
|
| |||||||||||||||||||||||||||||||||||||||||||||||||
|
Value Investment Risk |
|
|
X |
|
|
X |
|
|
X |
|
|
X |
|
|
X |
|
|
X |
|
|
X |
||||||||||||||||||||||||||||
|
| |||||||||||||||||||||||||||||||||||||||||||||||||
175
|
|
|
|
|
|
|
||||||||||||||||
|
Emerging |
Emerging |
Emerging | |||||||||||||||||||
|
Asia Pacific Market Risk |
|
|
|
|
|
| |||||||||||||||
|
| |||||||||||||||||||||
|
China Investments Risk |
|
|
X |
|
|
X |
|
| |||||||||||||
|
| |||||||||||||||||||||
|
Cyber Security Risk |
|
|
X |
|
|
X |
|
|
X |
||||||||||||
|
| |||||||||||||||||||||
|
Depositary Receipts Risk |
|
|
X |
|
|
X |
|
|
X |
||||||||||||
|
| |||||||||||||||||||||
|
Derivatives Risk |
|
|
X |
|
|
X |
|
|
X |
||||||||||||
|
| |||||||||||||||||||||
|
Emerging Markets Risk |
|
|
X |
|
|
X |
|
|
X |
||||||||||||
|
| |||||||||||||||||||||
|
Equity Market Risk |
|
|
X |
|
|
X |
|
|
X |
||||||||||||
|
| |||||||||||||||||||||
|
European Market Risk |
|
|
|
|
|
| |||||||||||||||
|
| |||||||||||||||||||||
|
Foreign Securities and Currencies Risk |
|
|
X |
|
|
X |
|
|
X |
||||||||||||
|
| |||||||||||||||||||||
|
Fund of Funds Risk |
|
|
|
|
|
| |||||||||||||||
|
| |||||||||||||||||||||
|
Japan Market Risk |
|
|
|
|
|
| |||||||||||||||
|
| |||||||||||||||||||||
|
Operational Risk |
|
|
X |
|
|
X |
|
|
X |
||||||||||||
|
| |||||||||||||||||||||
|
Profitability Investment Risk |
|
|
X |
|
|
X |
|
|
X |
||||||||||||
|
| |||||||||||||||||||||
|
Risks of Concentrating in the Real Estate Industry |
|
|
|
|
|
| |||||||||||||||
|
| |||||||||||||||||||||
|
Securities Lending Risk |
|
|
X |
|
|
X |
|
|
X |
||||||||||||
|
| |||||||||||||||||||||
|
Small and Mid-Cap Company Risk |
|
|
|
|
X |
|
|
X |
|||||||||||||
|
| |||||||||||||||||||||
|
Small Company Risk |
|
|
X |
|
|
|
| ||||||||||||||
|
| |||||||||||||||||||||
|
United Kingdom Market Risk |
|
|
|
|
|
| |||||||||||||||
|
| |||||||||||||||||||||
|
Value Investment Risk |
|
|
X |
|
|
X |
|
|
X |
||||||||||||
|
| |||||||||||||||||||||
Asia Pacific Market Risk: The Portfolio’s performance is expected to be closely tied to the social, political and economic conditions within such Asia Pacific countries and to be more volatile than the performance of funds with more geographically diverse investments.
China Investments Risk: There are special risks associated with investments in China, Hong Kong and Taiwan. The Chinese government has implemented significant economic reforms in order to liberalize trade policy, promote foreign investment in the economy, reduce government control of the economy and develop market mechanisms. But there can be no assurance that these reforms will continue or that they will be effective. Despite reforms and privatizations of companies in certain sectors, the Chinese government still exercises substantial influence over many aspects of the private sector and may own or control many companies. The Chinese government continues to maintain a major role in economic policy making and investing in China involves risks of losses due to expropriation, nationalization, confiscation of assets and property, and the imposition of restrictions on foreign investments and on repatriation of capital invested. In addition, investments in Taiwan could be adversely affected by its political and economic relationship with China. The Chinese economy is also vulnerable to the long-running disagreements with Hong Kong related to integration.
The Portfolio investing in China A-shares through Stock Connect is subject to trading, clearance, settlement, and other procedures, which could pose risks to the Portfolio. Trading through the Stock Connect program is subject to daily quotas that limit the maximum daily net purchases on any particular day, each of which may restrict or preclude the Portfolio’s ability to invest in China A-shares through the Stock Connect program. Trading through Stock Connect may require pre-validation of cash or securities prior to acceptance of orders. This requirement may limit the Portfolio’s ability to dispose of its A-shares purchased through Stock Connect in a timely manner.
A primary feature of the Stock Connect program is the application of the home market’s laws and rules applicable to investors in China A-shares. Therefore, the Portfolio’s investments in Stock Connect China A-shares are generally subject to the securities regulations and listing rules of the People’s Republic of China (“PRC”),
176
among other restrictions. Stock Connect can only operate when both PRC and Hong Kong markets are open for trading and when banking services are available in both markets on the corresponding settlement days. As such, the Shanghai and Shenzhen markets may be open at a time when Stock Connect is not trading, with the result that prices of China A-shares may fluctuate at times when the Portfolio is unable to add to or exit its position, which could adversely affect the Portfolio’s performance.
Changes in the operation of the Stock Connect program may restrict or otherwise affect the Portfolio’s investments or returns. Furthermore, any changes in laws, regulations and policies of the China A-shares market or rules in relation to Stock Connect may affect China A-share prices. These risks are heightened generally by the developing state of the PRC’s investment and banking systems and the uncertainty about the precise nature of the rights of equity owners and their ability to enforce such rights under Chinese law. An investment in China A-Shares is also generally subject to the risks identified under “Emerging Markets Risk,” and foreign investment risks such as price controls, expropriation of assets, confiscatory taxation, and nationalization may be heightened when investing in China. Certain investments in Chinese companies may be made through a special structure known as a VIE. In a VIE structure, foreign investors, such as the Portfolio, will only own stock in a shell company rather than directly in the VIE, which must be owned by Chinese nationals (and/or Chinese companies) to obtain the licenses and/or assets required to operate in certain restricted or prohibited sectors in China. The value of the shell company is derived from its ability to consolidate the VIE into its financials pursuant to contractual arrangements that allow the shell company to exert a degree of control over, and obtain economic benefits arising from, the VIE without formal legal ownership. While VIEs are a longstanding industry practice and are well known by Chinese officials and regulators, historically the structure has not been formally recognized under Chinese law and Chinese regulations regarding the structure are evolving. It is uncertain whether Chinese officials or regulators will withdraw their acceptance of the structure. It is also uncertain whether the contractual arrangements, which may be subject to conflicts of interest between the legal owners of the VIE and foreign investors, would be enforced by Chinese courts or arbitration bodies. Prohibitions of these structures by the Chinese government, or the inability to enforce such contracts, from which the shell company derives its value, would likely cause the VIE-structured holding(s) to suffer significant, detrimental, and possibly permanent losses, and in turn, adversely affect the Portfolio’s returns and net asset value.
Cyber Security Risk: The Portfolio’s and its service providers’ use of internet, technology and information systems may expose the Portfolio to potential risks linked to cyber security breaches of those technological or information systems. Cyber security breaches, amongst other things, could allow an unauthorized party to gain access to proprietary information, customer data, or fund assets, or cause the Portfolio and/or its service providers to suffer data corruption or lose operational functionality.
Depositary Receipts Risk: Depositary receipts, such as EDRs, GDRs and ADRs, are subject to many of the risks of the underlying securities. For some depositary receipts, the custodian or similar financial institution that holds the issuer’s shares in a trust account is located in the issuer’s home country. In these cases if the issuer’s home country does not have developed financial markets, the Portfolio could be exposed to the credit risk of the custodian or financial institution and greater market risk. In addition, the depository institution may not have physical custody of the underlying securities at all times and may charge fees for various services. The Portfolio may experience delays in receiving its dividend and interest payments or exercising rights as a shareholder. There may be an increased possibility of untimely responses to certain corporate actions of the issuer in an unsponsored depositary receipt program. Accordingly, there may be less information available regarding issuers of securities underlying unsponsored programs and there may not be a correlation between this information and the market value of the depositary receipts.
Derivatives Risk: Derivatives are instruments, such as futures, and options thereon, and foreign currency forward contracts, (collectively, “Derivative instruments”), whose value is derived from that of other assets, rates or indices. Derivative instruments can be used for hedging (attempting to reduce risk by offsetting one investment position with another) or non-hedging purposes. Hedging with derivative instruments may increase expenses, and there is no guarantee that a hedging strategy will work. While hedging can reduce or eliminate losses, it can also reduce or eliminate gains or cause losses if the market moves in a manner different from that anticipated by the Portfolio or if the cost of the derivative instrument outweighs the benefit of the hedge. In regard to currency hedging, it is generally not possible to precisely match the foreign currency exposure of such foreign currency forward contracts to the value of the securities involved due to fluctuations in the market values of such securities and cash flows into and out of the Portfolio between the date a foreign currency forward contract is entered into
177
and the date it expires. The use of derivative instruments for non-hedging purposes may be considered to carry more risk than other types of investments. When the Portfolio uses derivative instruments, the Portfolio will be directly exposed to the risks of those derivatives. Derivative instruments expose the Portfolio to counterparty risk (the risk that the derivative counterparty will not fulfill its contractual obligations), including credit risk of the derivative counterparty, and settlement risk (the risk faced when one party to a transaction has performed its obligations under a contract but has not yet received value from its counterparty). The possible lack of a liquid secondary market for derivative instruments and the resulting inability of the Portfolio to sell or otherwise close a derivatives position could expose the Portfolio to losses and could make derivative instruments more difficult for the Portfolio to value accurately. Some derivative instruments are more sensitive to interest rate changes and market price fluctuations than other securities. The Portfolio could also suffer losses related to its derivatives positions as a result of unanticipated market movements, which losses are potentially unlimited. The Advisor may not be able to predict correctly the direction of securities prices, interest rates, currency exchange rates and other economic factors, which could cause the Portfolio’s derivatives positions to lose value. Valuation of derivative instruments may also be more difficult in times of market turmoil since many investors and market makers may be reluctant to purchase derivative instruments or quote prices for them. Changes in the value of a derivative instrument may not correlate perfectly with the underlying asset, securities, rate or index, and the Portfolio could lose more than the principal amount invested.
Emerging Markets Risk: Securities of issuers associated with emerging market countries, including, but not limited to, issuers that are organized under the laws of, maintain a principal place of business in, derive significant revenues from, or issue securities backed by the government (or, its agencies or instrumentalities) of emerging market countries may be subject to higher and additional risks than securities of issuers in developed foreign markets. These risks include, but are not limited to (i) social, political and economic instability; (ii) government intervention, including policies or regulations that may restrict the Portfolio’s investment opportunities, including restrictions on investment in issuers or industries deemed sensitive to an emerging market country’s national interests; (iii) less transparent and established taxation policies; (iv) less developed legal systems allowing for enforcement of private property rights and/or redress for injuries to private property; (v) the lack of a capital market structure or market-oriented economy; (vi) higher degree of corruption and fraud; (vii) counterparties and financial institutions with less financial sophistication, creditworthiness and/or resources as those in developed foreign markets; and (viii) the possibility that the process of easing restrictions on foreign investment occurring in some emerging market countries may be slowed or reversed by unanticipated economic, political or social events in such countries, or the countries that exercise a significant influence over those countries. Similar to foreign issuers, emerging market issuers may not be subject to uniform accounting, auditing and financial reporting standards and there may be less publicly available financial and other information about such issuers, comparable to U.S. issuers. Stock markets in many emerging market countries are relatively small, expensive to trade in and generally have higher risks than those in developed markets. Securities in emerging markets also may be less liquid than those in developed markets and foreigners are often limited in their ability to invest in, and withdraw assets from, these markets. Additional restrictions may be imposed under other conditions. Frontier market countries generally have smaller economies or less developed capital markets and, as a result, the risks of investing in emerging market countries are magnified in frontier market countries.
Equity Market Risk: Even a long-term investment approach cannot guarantee a profit. Economic, market, political, and issuer-specific conditions and events will cause the value of equity securities, and the Portfolio that owns them, to rise or fall. Stock markets tend to move in cycles, with periods of rising prices and periods of falling prices. In addition, economies and financial markets throughout the world have become increasingly interconnected, which increases the likelihood that events or conditions in one region or country will adversely affect markets or issuers in other regions or countries. Portfolio securities may be negatively impacted by inflation (or expectations for inflation), interest rates, global demand for particular products/services or resources, natural disasters, pandemics, epidemics, terrorism, war, military confrontations, regulatory events and governmental or quasi-governmental actions, among others.
The coronavirus (COVID-19) pandemic has resulted, at times, in market closures, market volatility, liquidity constraints and increased trading costs. Efforts to contain the spread of COVID-19 have resulted in global travel restrictions and disruptions of healthcare systems, business operations and supply chains, layoffs, reduced consumer demand, defaults and credit rating downgrades, and other significant economic impacts. The effects of COVID-19 have impacted global economic activity and may heighten pre-existing political, social and
178
economic risks, domestically or globally. The full impact and duration of the COVID-19 pandemic (or other future epidemics and pandemics) are unpredictable and may adversely affect the Portfolio’s performance.
European Market Risk: The Portfolio’s performance is expected to be closely tied to the social, political and economic conditions within such European countries and to be more volatile than the performance of funds with more geographically diverse investments.
Foreign Securities and Currencies Risk: Foreign securities prices may decline or fluctuate because of: (a) economic or political actions of foreign governments, and/or (b) less regulated or liquid securities markets. Investors holding these securities may also be exposed to foreign currency risk (the possibility that foreign currency will fluctuate in value against the U.S. dollar or that a foreign government will convert, or be forced to convert, its currency to another currency, changing its value against the U.S. dollar). The Large Cap International Portfolio, The DFA International Value Series, International Core Equity Portfolio, The Japanese Small Company Series, The Asia Pacific Small Company Series, The United Kingdom Small Company Series, The Continental Small Company Series, DFA International Real Estate Portfolio, DFA International Small Cap Value Portfolio, International Vector Equity Portfolio, International High Relative Profitability Portfolio, World ex U.S. Core Equity Portfolio, The Emerging Markets Series, Emerging Markets Value Fund, Emerging Markets Targeted Value Portfolio, Emerging Markets Small Cap Series and Emerging Markets Core Equity Portfolio do not hedge foreign currency risk.
Foreign issuers may not be subject to uniform accounting, auditing and financial reporting standards and there may be less publicly available financial and other information about such issuers, comparable to U.S. issuers. Certain countries’ legal institutions, financial markets, and services are less developed than those in the U.S. or other major economies. The Portfolio may have greater difficulty voting proxies, exercising shareholder rights, securing dividends and obtaining information regarding corporate actions on a timely basis, pursuing legal remedies, and obtaining judgments with respect to foreign investments in foreign courts than with respect to domestic issuers in U.S. courts.
Fund of Funds Risk: The investment performance of the Portfolio is affected by the investment performance of the Underlying Funds in which the Portfolio invests. The ability of the Portfolio to achieve its investment objective depends on the ability of the Underlying Funds to meet their investment objectives and on the Advisor’s decisions regarding the allocation of the Portfolio’s assets among Underlying Funds. There can be no assurance that the investment objective of the Portfolio or any Underlying Fund will be achieved. When the Portfolio invests in Underlying Funds, investors are exposed to a proportionate share of the expenses of those Underlying Funds in addition to the expenses of the Portfolio. Through its investments in the Underlying Funds, the Portfolio is subject to the risks of the Underlying Funds’ investments.
Japan Market Risk: The Portfolio’s performance is expected to be closely tied to the social, political and economic conditions within Japan and to be more volatile than the performance of funds with more geographically diverse investments.
Operational Risk: Operational risks include human error, changes in personnel, system changes, faults in communication, and failures in systems, technology, or processes. Various operational events or circumstances are outside the Advisor’s control, including instances at third parties. The Portfolio and the Advisor seek to reduce these operational risks through controls and procedures. However, these measures do not address every possible risk and may be inadequate to address these risks.
Profitability Investment Risk: High relative profitability stocks may perform differently from the market as a whole and an investment strategy purchasing these securities may cause the Portfolio to at times underperform equity funds that use other investment strategies.
Risks of Concentrating in the Real Estate Industry: The Portfolio is concentrated in the real estate industry. The exclusive focus by the Portfolio on the real estate industry will cause the Portfolio to be exposed to the general risks of direct real estate ownership. The value of securities in the real estate industry can be affected by changes in real estate values and rental income, property taxes, and tax and regulatory requirements. Also, the value of securities in the real estate industry may decline with changes in interest rates. Investing in REITs and REIT-like entities involves certain unique risks in addition to those risks associated with investing in the real estate industry
179
in general. REITs and REIT-like entities are dependent upon management skill, may not be diversified, and are subject to heavy cash flow dependency and self-liquidation. REITs and REIT-like entities also are subject to the possibility of failing to qualify for tax free pass-through of income. Also, many foreign REIT-like entities are deemed for tax purposes as passive foreign investment companies (PFICs), which could result in the receipt of taxable dividends to shareholders at an unfavorable tax rate. Also, because REITs and REIT-like entities typically are invested in a limited number of projects or in a particular market segment, these entities are more susceptible to adverse developments affecting a single project or market segment than more broadly diversified investments. The performance of the Portfolio may be materially different from the broad equity market.
Securities Lending Risk: Securities lending involves the risk that the borrower may fail to return the securities in a timely manner or at all. As a result, the Portfolio may lose money and there may be a delay in recovering the loaned securities. The Portfolio could also lose money if it does not recover the securities and/or the value of the collateral falls, including the value of investments made with cash collateral. Securities lending also may have certain adverse tax consequences.
Small and Mid-Cap Company Risk: Securities of small and mid-cap companies are often less liquid than those of large companies and this could make it difficult to sell a small or mid-cap company security at a desired time or price. As a result, small and mid-cap company stocks may fluctuate relatively more in price. In general, small and mid-capitalization companies are also more vulnerable than larger companies to adverse business or economic developments and they may have more limited resources.
Small Company Risk: Securities of small companies are often less liquid than those of large companies and this could make it difficult to sell a small company security at a desired time or price. As a result, small company stocks may fluctuate relatively more in price. In general, smaller capitalization companies are also more vulnerable than larger companies to adverse business or economic developments and they may have more limited resources.
United Kingdom Market Risk: The Portfolio’s performance is expected to be closely tied to the social, political and economic conditions within the United Kingdom (“UK”) and to be more volatile than the performance of funds with more geographically diverse investments. There is continuing uncertainty regarding the ramifications of the UK’s vote to withdraw from the European Union (“EU”) in June 2016 (“Brexit”). On January 31, 2020, the UK officially withdrew from the EU and on May 1, 2021, the UK and EU formally entered into the EU-UK Trade and Cooperation Agreement (“Agreement”). While the Agreement is viewed as a positive step towards finalizing the framework of the future relationship between the EU and UK, many aspects of the relationship are still under negotiation and it is unclear when these negotiations will be complete. Brexit may cause greater market volatility and illiquidity, currency fluctuations, deterioration in economic activity, a decrease in business confidence, and increased likelihood of a recession in the UK. While it is not possible to determine the precise impact these events may have on the Portfolio, the impact on the UK could be significant and could adversely affect the value and liquidity of investments in the UK.
Value Investment Risk: Value stocks may perform differently from the market as a whole and an investment strategy purchasing these securities may cause the Portfolio to at times underperform equity funds that use other investment strategies. Value stocks can react differently to political, economic, and industry developments than the market as a whole and other types of stocks. Value stocks also may underperform the market for long periods of time.
Other Information
COMMODITY POOL OPERATOR EXEMPTION
Each Portfolio, Master Fund and Underlying Fund is operated by a person that has claimed an exclusion from the definition of the term “commodity pool operator” under the Commodity Exchange Act (“CEA”) with respect to the Portfolios, Master Funds, and Underlying Funds described in this Prospectus, and, therefore, such person is not subject to registration or regulation as a pool operator under the CEA with respect to such Portfolios, Master Funds, and Underlying Funds.
180
FUND OF FUNDS PORTFOLIO TURNOVER
The portfolio turnover rate provided for the Global Small Company Portfolio, International Small Company Portfolio, World ex U.S. Value Portfolio, World Core Equity Portfolio and Selectively Hedged Global Equity Portfolio under the heading “Portfolio Turnover” for the respective Portfolio is unaudited. The portfolio turnover rate presented for each Fund of Funds, excluding the DFA Global Real Estate Securities Portfolio, was derived from the portfolio turnover rates of the Underlying Funds in which the Fund of Funds invests. The portfolio turnover rate of the DFA Global Real Estate Securities Portfolio’s direct investments portfolio is audited.
Securities Loans
All of the Portfolios, Master Funds and Underlying Funds are authorized to lend securities to qualified brokers, dealers, banks and other financial institutions for the purpose of earning additional income, although inasmuch as the Feeder Portfolios will only hold shares of a corresponding Master Fund, these Portfolios do not intend to lend those shares. While a Portfolio, Master Fund or Underlying Fund may earn additional income from lending securities, such activity is incidental to the investment objective of a Portfolio, Master Fund or Underlying Fund. For information concerning the revenue from securities lending, see “SECURITIES LENDING REVENUE.” The value of securities loaned may not exceed 331/3% of the value of a Portfolio’s or Master Fund’s total assets, which includes the value of collateral received. To the extent a Portfolio, Master Fund or Underlying Fund loans a portion of its securities, a Portfolio, Master Fund or Underlying Fund will receive collateral consisting generally of cash or U.S. government securities. Collateral received will be maintained by marking to market daily and (i) in an amount equal to at least 100% of the current market value of the loaned securities with respect to securities of the U.S. Government or its agencies, (ii) in an amount generally equal to 102% of the current market value of the loaned securities with respect to U.S. securities, and (iii) in an amount generally equal to 105% of the current market value of the loaned securities with respect to foreign securities. Subject to their stated investment policies, the Portfolios, Master Funds and Underlying Funds will generally invest the cash collateral received for the loaned securities in The DFA Short Term Investment Fund (the “Money Market Series”), an affiliated registered money market fund advised by the Advisor for which the Advisor receives a management fee of 0.05% of the average daily net assets of the Money Market Series. The Portfolios, Master Funds and Underlying Funds may also invest such collateral in securities of the U.S. Government or its agencies, repurchase agreements collateralized by securities of the U.S. Government or its agencies, and unaffiliated registered and unregistered money market funds. For purposes of this paragraph, agencies include both agency debentures and agency mortgage backed securities.
In addition, the Portfolios, Master Funds and Underlying Funds will be able to terminate the loan at any time and will receive reasonable interest on the loan, as well as amounts equal to any dividends, interest or other distributions on the loaned securities. However, dividend income received from loaned securities may not be eligible to be taxed at qualified dividend income rates. See the statement of additional information (“SAI”) for a further discussion of the tax consequences related to securities lending. A Portfolio, Master Fund or Underlying Fund will be entitled to recall a loaned security in time to vote proxies or otherwise obtain rights to vote proxies of loaned securities if the Portfolio, Master Fund or Underlying Fund knows a material event will occur. In the event of the bankruptcy of the borrower, DFA Investment Dimensions Group, Inc., Dimensional Investment Group Inc. (each a “Fund” and collectively the “Funds”), the Emerging Markets Value Fund (collectively with the Trust, the “Master Trusts”) or the Trust could experience delay in recovering the loaned securities or only recover cash or a security of equivalent value. See “Principal Risks—Securities Lending Risks” for a discussion of the risks related to securities lending.
181
Securities Lending Revenue
During the fiscal year ended October 31, 2022, the following Portfolios received the following net revenues from a securities lending program (see “SECURITIES LOANS”), which constituted a percentage of the average daily net assets of the Portfolio:
|
|
|
|
|
| ||||||||||
|
Portfolio |
Net Revenue** |
Percentage | ||||||||||||
|
Large Cap International Portfolio |
$ |
|
2,014,895 |
|
0.04 |
% |
| |||||||
|
| ||||||||||||||
|
DFA International Value Portfolio* |
$ |
|
3,223,476 |
|
0.04 |
% |
| |||||||
|
| ||||||||||||||
|
International Core Equity Portfolio |
$ |
|
17,192,145 |
|
0.06 |
% |
| |||||||
|
| ||||||||||||||
|
Japanese Small Company Portfolio* |
$ |
|
173,826 |
|
0.05 |
% |
| |||||||
|
| ||||||||||||||
|
Asia Pacific Small Company Portfolio* |
$ |
|
734,777 |
|
0.23 |
% |
| |||||||
|
| ||||||||||||||
|
United Kingdom Small Company Portfolio* |
$ |
|
1,860 |
|
0.01 |
% |
| |||||||
|
| ||||||||||||||
|
Continental Small Company Portfolio* |
$ |
|
764,734 |
|
0.10 |
% |
| |||||||
|
| ||||||||||||||
|
DFA International Real Estate Securities Portfolio |
$ |
|
2,672,506 |
|
0.05 |
% |
| |||||||
|
| ||||||||||||||
|
DFA Global Real Estate Securities Portfolio |
$ |
|
176,273 |
|
0.00 |
% |
| |||||||
|
| ||||||||||||||
|
DFA International Small Cap Value Portfolio |
$ |
|
4,011,797 |
|
0.04 |
% |
| |||||||
|
| ||||||||||||||
|
International Vector Equity Portfolio |
$ |
|
2,311,814 |
|
0.07 |
% |
| |||||||
|
| ||||||||||||||
|
International High Relative Profitability Portfolio |
$ |
|
686,220 |
|
0.03 |
% |
| |||||||
|
| ||||||||||||||
|
World ex U.S. Core Equity Portfolio |
$ |
|
2,892,513 |
|
0.08 |
% |
| |||||||
|
| ||||||||||||||
|
Emerging Markets Portfolio* |
$ |
|
5,047,409 |
|
0.10 |
% |
| |||||||
|
| ||||||||||||||
|
Emerging Markets Value Portfolio* |
$ |
|
14,187,704 |
|
0.12 |
% |
| |||||||
|
| ||||||||||||||
|
Emerging Markets Targeted Value Portfolio |
$ |
|
208,176 |
|
0.10 |
% |
| |||||||
|
| ||||||||||||||
|
Emerging Markets Small Cap Portfolio* |
$ |
|
18,927,331 |
|
0.42 |
% |
| |||||||
|
| ||||||||||||||
|
Emerging Markets Core Equity Portfolio |
$ |
|
44,773,778 |
|
0.17 |
% |
| |||||||
|
| ||||||||||||||
|
Emerging Markets ex China Core Equity Portfolio |
|
$ |
|
61,243 |
|
0.02 |
% |
| ||||||
|
| ||||||||||||||
|
* |
A Portfolio with a corresponding Master Fund or Underlying Fund(s) that is taxed as a partnership. “Net Revenue” reflects the proportional share of the securities lending revenue generated by the Master Fund or Underlying Fund(s) that was received by the Portfolio. | ||
|
** |
The amounts included in the table above may differ from the amounts disclosed in the Portfolios’ annual reports due to timing differences, reconciliations, and certain other adjustments. |
Management of the Funds
The Advisor serves as investment advisor to each of the Portfolios, Master Funds and Underlying Funds. Pursuant to an Investment Management Agreement with each Portfolio and Master Fund, the Advisor is responsible for the management of their respective assets. With respect to an Investment Management Agreement with each Feeder Portfolio, the Advisor manages the portion of each Feeder Portfolio’s assets that are retained by the Feeder Portfolio for direct investment and, at its discretion, may make a determination to withdraw a Feeder Portfolio’s investment from its corresponding Master Fund to invest in another Master Fund or manage all the Feeder Fund’s assets directly if the Advisor believes it is in the best interests of the Feeder Portfolio and its shareholders to do so. As of the date of this Prospectus, each Feeder Portfolio invests substantially all of its assets in its corresponding Master Fund. The Portfolios and the Master Funds are managed using a team approach. The investment team includes the Investment Committee of the Advisor, portfolio managers and trading personnel.
182
The Investment Committee is composed primarily of certain officers and directors of the Advisor who are appointed annually. As of the date of this Prospectus, the Investment Committee has fourteen members. Investment strategies for all Portfolios and all Master Funds are set by the Investment Committee, which meets on a regular basis and also as needed to consider investment issues. The Investment Committee also sets and reviews all investment related policies and procedures and approves any changes in regards to approved countries, security types and brokers.
In accordance with the team approach used to manage the portfolios, the portfolio managers and portfolio traders implement the policies and procedures established by the Investment Committee. The portfolio managers and portfolio traders also make daily investment decisions regarding the portfolios based on the parameters established by the Investment Committee. The individuals named in a Portfolio’s “INVESTMENT ADVISOR/PORTFOLIO MANAGEMENT” section coordinate the efforts of all other portfolio managers or trading personnel with respect to the day to day management of such Portfolio.
Mr. Collins-Dean is Vice President and a Senior Portfolio Manager of the Advisor. Mr. Collins-Dean holds an MBA from the University of Chicago and a BS from Wake Forest University. Mr. Collins-Dean joined the Advisor in 2014, has been a portfolio manager since 2016, and has been responsible for the International Core Equity Portfolio, DFA International Real Estate Securities Portfolio, DFA Global Real Estate Securities Portfolio, International Vector Equity Portfolio, World ex U.S. Core Equity Portfolio, Emerging Markets Core Equity Portfolio since 2019 and Emerging Markets ex China Core Equity Portfolio since inception (2021).
Mr. Fogdall is Global Head of Portfolio Management, Chairman of the Investment Committee, Vice President, and a Senior Portfolio Manager of the Advisor. Mr. Fogdall has an MBA from the University of California, Los Angeles and a BS from Purdue University. Mr. Fogdall joined the Advisor as a portfolio manager in 2004 and has been responsible for the Portfolios since 2010 or since inception with respect to the Selectively Hedged Global Equity Portfolio (2011), World Core Equity Portfolio (2012), World ex U.S. Core Equity Portfolio (2013), Global Small Company Portfolio (2017), International High Relative Profitability Portfolio (2017), Emerging Markets Targeted Value Portfolio (2018) and Emerging Markets ex China Core Equity Portfolio (2021).
Ms. Phillips is Deputy Head of Portfolio Management, North America, a member of the Investment Committee, Vice President, and a Senior Portfolio Manager of the Advisor. Ms. Phillips holds an MBA from the University of Chicago Booth School of Business and a BA from the University of Puget Sound. Ms. Phillips joined the Advisor in 2012, has been a portfolio manager since 2014, and has been responsible for the International Core Equity Portfolio, DFA International Real Estate Securities Portfolio, DFA Global Real Estate Securities Portfolio, International Vector Equity Portfolio, World ex U.S. Core Equity Portfolio, World Core Equity Portfolio, Selectively Hedged Global Equity Portfolio and Emerging Markets Core Equity Portfolio since 2017, and the Emerging Markets ex China Core Equity Portfolio since inception (2021).
Mr. Pu is Deputy Head of Portfolio Management, North America, a member of the Investment Committee, Vice President, and a Senior Portfolio Manager of the Advisor. Mr. Pu has an MBA from the University of California, Los Angeles, an MS and PhD from Caltech, and a BS from Cooper Union for the Advancement of Science and Art. Mr. Pu joined the Advisor as a portfolio manager in 2006 and has been responsible for the International Core Equity Portfolio, DFA International Real Estate Securities Portfolio, DFA Global Real Estate Securities Portfolio, International Vector Equity Portfolio, World ex U.S. Core Equity Portfolio, World Core Equity Portfolio and Emerging Markets Core Equity Portfolio since 2015, the Global Small Company Portfolio, World ex U.S. Value Portfolio and Selectively Hedged Global Equity Portfolio since 2017, the Emerging Markets Portfolio, the Emerging Markets Value Portfolio, the Emerging Markets Targeted Value Portfolio and the Emerging Markets Small Cap Portfolio since 2020 and since inception for Emerging Markets ex China Core Equity Portfolio (2021).
Mr. Keswani is Vice President and a Senior Portfolio Manager of the Advisor. Mr. Keswani holds an MBA from the Massachusetts Institute of Technology Sloan School of Management, an MS from Pennsylvania State University, and a BS from Purdue University. Mr. Keswani joined the Advisor in 2011, has been a portfolio manager since 2013 and has been responsible for the International Small Company Portfolio, Japanese Small Company Portfolio, Asia Pacific Small Company Portfolio, United Kingdom Small Company Portfolio, Continental Small Company Portfolio and DFA International Small Cap Value Portfolio since 2015 and the Large Cap International Portfolio, the DFA International Value Portfolio and the International High Relative Profitability Portfolio since 2020.
183
Mr. Bhagwanjee is a Vice President and Senior Portfolio Manager of the Advisor. Mr. Bhagwanjee holds an MBA from the University of Chicago and a BS from Purdue University. Mr. Bhagwanjee joined the Advisor in 2014, has been a portfolio manager since 2017, and has been responsible for the DFA Global Real Estate Securities Portfolio and the World Core Equity Portfolio since 2020 and the Global Small Company Portfolio, World ex U.S. Value Portfolio and Selectively Hedged Global Equity Portfolio since 2022.
Mr. Schneider is Deputy Head of Portfolio Management, North America, a member of the Investment Committee, Vice President, and a Senior Portfolio Manager of the Advisor. Mr. Schneider holds an MBA from the University of Chicago Booth School of Business, an MS from the University of Minnesota, and a BS from Iowa State University. Mr. Schneider joined the Advisor in 2011, has been a portfolio manager since 2013, and has been responsible for the Large Cap International Portfolio, the International Small Company Portfolio, the Japanese Small Company Portfolio, the United Kingdom Small Company Portfolio, the Continental Small Company Portfolio and the DFA International Small Cap Value Portfolio since 2020 and the DFA International Value Portfolio, Asia Pacific Small Company Portfolio and International High Relative Profitability Portfolio since 2022.
Mr. Wren is a Vice President and Senior Portfolio Manager of the Advisor. Mr. Wren holds an MBA and an MPA from the University of Texas at Austin. Mr. Wren joined the Advisor in 2010, has been a portfolio manager since 2018, and has been responsible for the Emerging Markets Portfolio, the Emerging Markets Value Portfolio, the Emerging Markets Targeted Value Portfolio and the Emerging Markets Small Cap Portfolio since 2020.
The Portfolios’ SAI provides information about each portfolio manager’s compensation, other accounts managed by the portfolio manager, and the portfolio manager’s ownership of Fund shares.
The Advisor and with respect to the sub-advised Portfolios and Master Funds detailed below, Dimensional Fund Advisors Ltd. (“DFAL”) and DFA Australia Limited (“DFA Australia”), provide the Portfolios, the Master Funds and Underlying Funds with a trading department and selects brokers and dealers to effect securities transactions. Securities transactions are placed with a view to obtaining best price and execution. The Advisor may pay compensation, out of the Advisor’s profits and not as an additional charge to a Portfolio, to financial intermediaries to support the sale of Portfolio shares. The Advisor’s address is 6300 Bee Cave Road, Building One, Austin, TX 78746. A discussion regarding the basis for the Boards of Trustees/Directors approving the Investment Management Agreements with respect to the Portfolios and Master Funds, is available in the semi-annual reports for the Portfolios and Master Funds for the fiscal period ending April 30, 2022.
The Funds and the Master Trusts bear all of their own fees, expenses, charges, assessments, taxes, and other costs incurred in their operations, whether incurred directly by the Funds/Master Trusts or incurred by the Advisor on their behalf. The expenses payable by the Funds/Master Trusts shall include, but are not limited to: services of their independent registered public accounting firm, legal counsel to the Funds/Master Trusts and their disinterested trustees/directors, fees and expenses of disinterested trustees/directors, employees and consultants, accounting and pricing costs (including the daily calculations of net asset value), brokerage fees, commissions and transfer taxes in connection with the acquisition and disposition of portfolio securities, taxes and other governmental fees levied against the Funds/Master Trusts, insurance premiums, investment fees and expenses of the Funds/Master Trusts, including the interest expense of borrowing money, the costs incidental to meetings of their shareholders and trustees/directors, the cost of filing their registration statements under the federal securities laws and the cost of any other filings required under federal and state securities laws, the costs of preparing, printing and mailing proxies, shareholder reports, prospectuses, statements of additional information and other fund documents, transfer and dividend disbursing agency, administrative services and custodian fees, including the expenses of issuing, repurchasing or redeeming their shares, fees and expenses of securities lending agents and the oversight of the securities lending activities of the Funds/Master Trusts, fees and expenses associated with trade administration oversight services with respect to reconciliations and the oversight of settlement and collateral management, litigation, regulatory examinations/proceedings and other extraordinary or nonrecurring expenses, and other expenses properly payable by the Funds/Master Trusts, except as provided in the Fee Waiver and Expense Assumption Agreements for certain classes of the Portfolios. Expenses allocable to a particular Portfolio or Master Fund or class of a Portfolio are so allocated. The expenses of a Fund which are not allocable to a particular Portfolio or class of a Portfolio are to be borne by each Portfolio or class of a Portfolio of the Fund on the basis of its relative net assets. Similarly, the expenses of the Master
184
Trusts which are not allocable to a particular Series are to be borne by each Master Fund on the basis of its relative net assets.
The Advisor has been engaged in the business of providing investment management services since May 1981. The Advisor is currently organized as a Delaware limited partnership and is controlled and operated by its general partner, Dimensional Holdings Inc., a Delaware corporation. The Advisor controls Dimensional Fund DFAL and DFA Australia. As of January 31, 2023, assets under management for all Dimensional affiliated advisors totaled approximately $626 billion.
MANAGEMENT FEES
The “Annual Fund Operating Expenses” table describes the fees incurred by each Portfolio (excluding the Portfolios listed below) for the services provided by the Advisor for the fiscal year ended October 31, 2022. The "Management Fee" listed in the "Annual Fund Operating Expenses" table for the Portfolios (excluding the Portfolios listed below) provides the investment management fee that was payable by the respective Portfolio to the Advisor.
The “Management Fee” listed in the “Annual Fund Operating Expenses” table for the Non-Feeder Portfolios (excluding the Portfolios listed below) provides the investment management fee that was payable by the respective Portfolio to the Advisor. The “Management Fee” listed in the “Annual Fund Operating Expenses” table for each Feeder Portfolio includes the investment management fees payable to the Advisor by the Portfolio and the Portfolio’s Master Fund.
The “Annual Fund Operating Expenses” table for the DFA Global Real Estate Securities Portfolio describes the management fee to be paid by the Portfolio as a result of a decrease in the management fee payable by the Portfolio effective February 28, 2023. The rate of the management fee payable to the Advisor by the DFA Global Real Estate Securities Portfolio was reduced from 0.20% to 0.19% of the Portfolio’s average daily net assets on an annualized basis effective February 28, 2023.
The following table describes the effective management fee paid to the Advisor by each Portfolio listed below, based on the Portfolio’s average daily net assets on an annualized basis, during the fiscal year ended October 31, 2022, and the management fee payable by each Portfolio effective as of February 28, 2022 as a result of a decrease in the management fee:
|
|
|
|
|
| ||||||||||
|
Portfolio |
Effective |
Management | ||||||||||||
|
DFA International Value Portfolio |
0.27 |
%* |
|
|
|
0.25 |
% |
| ||||||
|
| ||||||||||||||
|
Global Small Company Portfolio |
0.37 |
%* |
|
|
0.35 |
% |
| |||||||
|
| ||||||||||||||
|
International Small Company Portfolio |
0.27 |
%* |
|
|
0.25 |
% |
| |||||||
|
| ||||||||||||||
|
Japanese Small Company Portfolio |
0.37 |
%* |
|
|
0.35 |
% |
| |||||||
|
| ||||||||||||||
|
Asia Pacific Small Company Portfolio |
0.37 |
%* |
|
|
0.35 |
% |
| |||||||
|
| ||||||||||||||
|
United Kingdom Small Company Portfolio |
0.37 |
%* |
|
|
0.35 |
% |
| |||||||
|
| ||||||||||||||
|
Continental Small Company Portfolio |
0.37 |
%* |
|
|
0.35 |
% |
| |||||||
|
| ||||||||||||||
|
DFA International Small Cap Value Portfolio |
0.41 |
%* |
|
|
0.39 |
% |
| |||||||
|
| ||||||||||||||
|
International Vector Equity Portfolio |
0.32 |
%* |
|
|
0.30 |
% |
| |||||||
|
| ||||||||||||||
|
World ex U.S. Value Portfolio |
0.34 |
%* |
|
|
|
0.32 |
% |
| ||||||
|
| ||||||||||||||
|
Emerging Markets Value Portfolio |
0.39 |
%* |
|
|
|
0.38 |
% |
| ||||||
|
| ||||||||||||||
|
* |
Management fee reflects a management fee reduction that was effective as of February 28, 2022. | |||||||||||||||||||||||||||||||||||||||||||||||||||||||||||||||||||||||||||||||||||||||||||||||||
The Advisor, not the Portfolios and Master Funds listed below, compensates the sub-advisors.
185
Sub-Advisors—The International High Relative Profitability Portfolio, the Global Small Company Portfolio, the Japanese Small Company Series, the Asia Pacific Small Company Series, the International Core Equity Portfolio, the DFA International Real Estate Securities Portfolio, the DFA Global Real Estate Portfolio, the International Vector Equity Portfolio, the Large Cap International Portfolio, the International Value Series, the DFA International Small Cap Value Portfolio, the World ex U.S. Value Portfolio, the World ex U.S. Core Equity Portfolio, the World Core Equity Portfolio, the Selectively Hedged Global Equity Portfolio, the Emerging Markets Series, the Emerging Markets Small Cap Series, the Emerging Markets Core Equity Portfolio, the Emerging Markets ex China Core Equity Portfolio, the Dimensional Emerging Markets Value Fund and the Emerging Markets Targeted Value Portfolio
Pursuant to Sub-Advisory Agreements with the Advisor, DFA Australia, has the authority and responsibility to select brokers and dealers to execute securities transactions for the International High Relative Profitability Portfolio, Global Small Company Portfolio, Japanese Small Company Series, Asia Pacific Small Company Series, International Core Equity Portfolio, DFA International Real Estate Securities Portfolio, DFA Global Real Estate Portfolio, International Vector Equity Portfolio, the Large Cap International Portfolio, the International Value Series, the DFA International Small Cap Value Portfolio, the World ex U.S. Value Portfolio, the World ex U.S. Core Equity Portfolio, the World Core Equity Portfolio, the Selectively Hedged Global Equity Portfolio, the Emerging Markets Series, the Emerging Markets Small Cap Series, the Emerging Markets Core Equity Portfolio, the Dimensional Emerging Markets Value Fund and the Emerging Markets Targeted Value Portfolio. DFA Australia’s duties include the maintenance of a trading desk for each Series or Portfolio and the determination of the best and most efficient means of executing securities transactions. On at least a semi-annual basis, the Advisor reviews the holdings of the International High Relative Profitability Portfolio, Japanese Small Company Series, Asia Pacific Small Company Series, International Core Equity Portfolio, DFA International Real Estate Securities Portfolio, DFA Global Real Estate Portfolio, International Vector Equity Portfolio, the Large Cap International Portfolio, the International Value Series, the DFA International Small Cap Value Portfolio, the World ex U.S. Value Portfolio, the World ex U.S. Core Equity Portfolio, the World Core Equity Portfolio, the Selectively Hedged Global Equity Portfolio, the Emerging Markets Series, the Emerging Markets Small Cap Series, the Emerging Markets Core Equity Portfolio, the Emerging Markets ex China Core Equity Portfolio, the Dimensional Emerging Markets Value Fund and the Emerging Markets Targeted Value Portfolio, and reviews the trading process and the execution of securities transactions. The Advisor is responsible for determining those securities which are eligible for purchase and sale by each Series and Portfolio and may delegate this task, subject to its own review, to DFA Australia. DFA Australia maintains and furnishes to the Advisor information and reports on securities of international companies, including its recommendations of securities to be added to the securities that are eligible for purchase by each Series and Portfolio as well as making recommendations and elections on corporate actions. DFA Australia has been a U.S. federally registered investment advisor since 1994 and is located at Level 43 Gateway, 1 Macquarie Place, Sydney, New South Wales 2000, Australia.
Sub-Advisors—The International High Relative Profitability Portfolio, the Global Small Company Portfolio, the United Kingdom Small Company Series, the Continental Small Company Series, the International Core Equity Portfolio, the DFA International Real Estate Securities Portfolio, the DFA Global Real Estate Securities Portfolio, the International Vector Equity Portfolio, the Large Cap International Portfolio, the International Value Series, the DFA International Small Cap Value Portfolio, the World ex U.S. Value Portfolio, the World ex U.S. Core Equity Portfolio, the World Core Equity Portfolio, the Selectively Hedged Global Equity Portfolio, the Emerging Markets Series, the Emerging Markets Small Cap Series, the Emerging Markets Core Equity Portfolio, the Emerging Markets ex China Core Equity Portfolio, the Dimensional Emerging Markets Value Fund and the Emerging Markets Targeted Value Portfolio
Pursuant to Sub-Advisory Agreements with the Advisor, DFAL, a company that is organized under the laws of England, has the authority and responsibility to select brokers or dealers to execute securities transactions for the International High Relative Profitability Portfolio, Global Small Company Portfolio, United Kingdom Small Company Series, Continental Small Company Series, International Core Equity Portfolio, DFA International Real Estate Securities Portfolio, DFA Global Real Estate Securities Portfolio, International Vector Equity Portfolio, the Large Cap International Portfolio, the International Value Series, the DFA International Small Cap Value Portfolio, the World ex U.S. Value Portfolio, the World ex U.S. Core Equity Portfolio, the World Core Equity Portfolio, the Selectively Hedged Global Equity Portfolio, the Emerging Markets Series, the Emerging Markets Small Cap Series, the Emerging Markets Core Equity Portfolio, the Emerging Markets ex China Core Equity Portfolio, the Dimensional Emerging Markets Value Fund and the Emerging Markets Targeted Value Portfolio. DFAL’s duties
186
include the maintenance of a trading desk for the Series and Portfolio and the determination of the best and most efficient means of executing securities transactions. On at least a semi-annual basis, the Advisor reviews the holdings of the International High Relative Profitability Portfolio, United Kingdom Small Company Series, Continental Small Company Series, International Core Equity Portfolio, DFA Global Real Estate Securities Portfolio, International Vector Equity Portfolio, DFA International Real Estate Securities Portfolio, the Large Cap International Portfolio, the International Value Series, the DFA International Small Cap Value Portfolio, the World ex U.S. Value Portfolio, the World ex U.S. Core Equity Portfolio, the World Core Equity Portfolio, the Selectively Hedged Global Equity Portfolio, the Emerging Markets Series, the Emerging Markets Small Cap Series, the Emerging Markets Core Equity Portfolio, the Dimensional Emerging Markets Value Fund and the Emerging Markets Targeted Value Portfolio and reviews the trading process and the execution of securities transactions. The Advisor is responsible for determining those securities which are eligible for purchase and sale by each Series and Portfolio and may delegate this task, subject to its own review, to DFAL. DFAL maintains and furnishes to the Advisor information and reports on securities of United Kingdom and European equity market companies, including its recommendations of securities to be added to the securities that are eligible for purchase by each Series and Portfolio as well as making recommendations and elections on corporate actions. DFAL has been a U.S. federally registered investment advisor since 1991 and is located at 20 Triton Street, Regent’s Place, London NW13BF, United Kingdom.
Manager of Managers Structure
The Advisor, the Funds, and, on behalf of certain Master Funds, the Trust or Dimensional Emerging Markets Value Fund, have received an exemptive order from the SEC for a manager of managers structure that allows the Advisor to appoint, remove or change Dimensional Wholly-Owned Sub-advisors (defined below), and enter into, amend and terminate sub-advisory agreements with Dimensional Wholly-Owned Sub-advisors, without prior shareholder approval, but subject to Board approval. A “Dimensional Wholly-Owned Sub-advisor” includes (1) sub-advisors that are wholly-owned by the Advisor ( i.e., an indirect or direct “wholly-owned subsidiary” (as such term is defined in the Investment Company Act of 1940 (the “1940 Act”)) of the Advisor, or (2) a sister company of the Advisor that is an indirect or direct “wholly-owned subsidiary” (as such term is defined in the 1940 Act) of the same company that, indirectly or directly, wholly owns the Advisor) (“Dimensional Wholly-Owned Sub-advisors”). A Board only will approve a change with respect to sub-advisors if the Directors conclude that such arrangements would be in the best interests of the shareholders of the Large Cap International Portfolio, DFA International Value Portfolio or Series, International Core Equity Portfolio, Global Small Company Portfolio International Small Company Portfolio, Japanese Small Company Portfolio or Series, Asia Pacific Small Company Portfolio or Series, United Kingdom Small Company Portfolio or Series, Continental Small Company Portfolio or Series, DFA International Real Estate Securities Portfolio, DFA Global Real Estate Securities Portfolio, DFA International Small Cap Value Portfolio, International Vector Equity Portfolio, International High Relative Profitability Portfolio, World ex U.S. Value Portfolio, World ex U.S. Core Equity Portfolio, World Core Equity Portfolio, Selectively Hedged Global Equity Portfolio, Emerging Markets Portfolio or Series, Emerging Markets Value Portfolio or Fund, Emerging Markets Small Cap Portfolio or Series, Emerging Markets Core Equity Portfolio, Emerging Markets ex China Core Equity Portfolio, or the Emerging Markets Targeted Value Portfolio (the “MOM-Eligible Portfolios”). As described above, DFA Australia and/or DFAL, each a Dimensional Wholly-Owned Sub-advisor, currently serve as sub-advisors to each MOM-Eligible Portfolio or its Underlying Fund(s) or Master Fund. If a new Dimensional Wholly-Owned Sub-advisor is hired for a MOM-Eligible Portfolio or its Master Fund, shareholders will receive information about the new sub-advisor within 90 days of the change. The exemptive order allows greater flexibility for the Advisor to utilize, if desirable, personnel throughout the worldwide organization enabling a MOM-Eligible Portfolio to operate more efficiently. The Advisor will not hire unaffiliated sub-advisors without prior shareholder approval and did not request the ability to do so in its application to the SEC for an exemptive order to allow the manager of managers structure.
The use of the manager of managers structure with respect to a MOM-Eligible Portfolio is subject to certain conditions set forth in the SEC exemptive order. Under the manager of managers structure, the Advisor has the ultimate responsibility, subject to oversight by the applicable Board, to oversee the Dimensional Wholly-Owned Sub-advisors and recommend their hiring, termination and replacement. The Advisor will provide general management services to a MOM-Eligible Portfolio, including overall supervisory responsibility for the general management and investment of the Portfolio’s assets. Subject to review and approval of the applicable Board, the Advisor will (a) set a MOM-Eligible Portfolio’s overall investment strategies, (b) evaluate, select, and recommend Dimensional Wholly-Owned Sub-advisors to manage all or a portion of a MOM-Eligible Portfolio’s
187
assets, and (c) implement procedures reasonably designed to ensure that Dimensional Wholly-Owned Sub-advisors comply with a MOM-Eligible Portfolio’s investment objective, policies and restrictions. Subject to review by the applicable Board, the Advisor will (a) when appropriate, allocate and reallocate a MOM-Eligible Portfolio’s assets among multiple Dimensional Wholly-Owned Sub-advisors; and (b) monitor and evaluate the performance of Dimensional Wholly-Owned Sub-advisors.
SHAREHOLDER SERVICES
On behalf of a Portfolio, the Funds may enter into shareholder servicing agreements with financial intermediaries to provide shareholder servicing, recordkeeping, account maintenance and other services to Institutional Class shareholders of the Portfolio. For the array of services provided to Institutional Class shareholders of a Portfolio, the Funds may pay such financial intermediaries a fee for such services. These expenses will be included in “Other Expenses” in the “Annual Fund Operating Expenses” table.
FEE WAIVER AND EXPENSE ASSUMPTION AGREEMENTS
Pursuant to an Amended and Restated Fee Waiver and/or Expense Assumption Agreement (each, a “Fee Waiver Agreement”), the Advisor has contractually agreed to waive certain fees, and in certain instances, assume certain expenses of the Portfolios, as described in the notes below. The Fee Waiver Agreement for the non-Feeder Portfolios below, and a portion of the Fee Waiver Agreement for certain Feeder Portfolios below, will remain in effect through February 28, 2024, and may only be terminated by the Fund’s Board of Directors prior to that date. The Fee Waiver Agreement for such Portfolios shall continue in effect from year to year thereafter unless terminated by a Fund or the Advisor. The Fee Waiver Agreement with respect to the total management fees paid by the Feeder Portfolios, as described in the notes below, will remain in effect permanently, unless terminated by a Fund. With respect to each Fee Waiver Agreement, prior year waived fees and/or assumed expenses can be recaptured only if the expense ratio following such recapture would be less than the expense cap that was in place when such prior year fees were waived and/or expenses assumed, and less than the current expense cap in place for the Portfolio. With respect to the World ex U.S. Value Portfolio, World Core Equity Portfolio and Selectively Hedged Global Equity Portfolio, the Advisor shall also not be reimbursed for any management fees previously waived to offset a Portfolio’s proportionate share of the management fees paid by such Portfolio through its investment in other funds managed by the Advisor.
DFA International Value
Portfolio
Emerging Markets Portfolio
Emerging Markets Value
Portfolio
Emerging Markets Small Cap Portfolio
The Advisor has contractually agreed to permanently waive all or a portion of the management fee of each Portfolio listed below to the extent necessary to limit the total management fees paid to the Advisor by a Portfolio, including the proportionate share of the management fees a Portfolio pays indirectly through its investment in other funds managed by the Advisor, except for the fees paid indirectly through its investment of securities lending cash collateral in the Money Market Series, to the rate listed below as a percentage of the average net assets of a class of a Portfolio on an annualized basis.
|
|
|
| |||||
|
Portfolio |
Total
Management | ||||||
|
DFA International Value Portfolio |
|
|
0.25 |
% |
| ||
|
| |||||||
|
Emerging Markets Portfolio |
|
|
0.29 |
% |
| ||
|
| |||||||
|
Emerging Markets Value Portfolio |
|
|
0.38 |
% |
| ||
|
| |||||||
|
Emerging Markets Small Cap Portfolio |
|
|
0.52 |
% |
| ||
|
| |||||||
With respect to the Emerging Markets Portfolio, in addition to the permanent fee waiver described above for the Portfolio, the Advisor has contractually agreed to further waive all or a portion of its management fee and to assume the other direct expenses of a class of the Portfolio (excluding expenses incurred through its investment in other investment companies managed by the Advisor) (“Portfolio Expenses”) to the extent necessary to limit
188
the Portfolio Expenses of each class of the Portfolio to 0.49% of the average net assets of a class of the Portfolio on an annualized basis (the “Expense Limitation Amount”). At any time that the Portfolio Expenses of a class of the Portfolio are less than the applicable Expense Limitation Amount for such class of shares of the Portfolio, the Advisor retains the right to recover any fees previously waived and/or expenses previously assumed to the extent that such recovery will not cause the annualized Portfolio Expenses for such class of shares of the Portfolio to exceed the applicable Expense Limitation Amount. Except, the Portfolio is not obligated to reimburse the Advisor for fees waived in connection with the permanent fee waiver. Also, the Portfolio is not obligated to reimburse the Advisor for fees previously waived or expenses previously assumed by the Advisor more than thirty-six months before the date of such reimbursement.
Large Cap International
Portfolio
International Core Equity Portfolio
DFA International Real
Estate Securities Portfolio
International Vector Equity Portfolio
Emerging
Markets Core Equity Portfolio
The Advisor has contractually agreed to waive all or a portion of its management fee and assume the ordinary operating expenses of a class of each of the following Portfolios (excluding the expenses that the Portfolio incurs indirectly through its investment in other investment companies) (“Portfolio Expenses”) to the extent necessary to limit the Portfolio Expenses of a class of each Portfolio, on an annualized basis, to the rates listed below as a percentage of a class of the respective Portfolio’s average net assets (the “Expense Limitation Amount”). At any time that the Portfolio Expenses of a class of a Portfolio are less than the applicable Expense Limitation Amount for such class of shares of the Portfolio, the Advisor retains the right to recover any fees previously waived and/or expenses previously assumed to the extent that such recovery will not cause the annualized Portfolio Expenses for such class of shares of the Portfolio to exceed the applicable Expense Limitation Amount identified below. A Portfolio is not obligated to reimburse the Advisor for fees previously waived or expenses previously assumed by the Advisor more than thirty-six months before the date of such reimbursement.
|
|
|
| |||||
|
Portfolio |
Expense
Limitation | ||||||
|
Large Cap International Portfolio |
|
|
0.24 |
% |
| ||
|
| |||||||
|
International Core Equity Portfolio |
|
|
0.30 |
% |
| ||
|
| |||||||
|
DFA International Real Estate Securities Portfolio |
|
|
0.29 |
% |
| ||
|
| |||||||
|
International Vector Equity Portfolio |
|
|
0.60 |
% |
| ||
|
| |||||||
|
Emerging Markets Core Equity Portfolio |
|
|
0.54 |
% |
| ||
|
| |||||||
International High Relative
Profitability Portfolio
Global Small Company Portfolio
Emerging Markets
Targeted Value Portfolio
Emerging Markets ex China Core Equity
Portfolio
Pursuant to a Fee Waiver and Expense Assumption Agreement (the “Fee Waiver Agreement”) for the Portfolios, the Advisor has contractually agreed to waive all or a portion of its management fee and to assume the ordinary operating expenses of a class of each Portfolio (including the expenses that the Portfolio bears as a shareholder of other funds managed by the Advisor, excluding money market funds, but excluding the expenses that the Portfolio incurs indirectly through its investment in unaffiliated investment companies) (“Portfolio Expenses”) to the extent necessary to limit the Portfolio Expenses of the Institutional Class Shares of the Portfolio to the rate listed below as a percentage of the average net assets of the Institutional Class Shares of the Portfolio on an annualized basis (the “Expense Limitation Amount”). At any time that the Portfolio Expenses of a class of a Portfolio are less than the Expense Limitation Amount, the Advisor retains the right to recover any fees previously waived and/or expenses previously assumed to the extent that such recovery will not cause the annualized Portfolio Expenses for such class of shares of the Portfolio to exceed the Expense Limitation Amount. The Portfolios will not reimburse the Advisor for fees waived or expenses previously assumed by the Advisor more than thirty-six months before the date of such reimbursement.
189
|
|
|
| |||||
|
Portfolio |
Expense
Limitation | ||||||
|
International High Relative Profitability Portfolio |
|
|
0.35 |
% |
| ||
|
| |||||||
|
Global Small Company Portfolio |
|
|
0.42 |
% |
| ||
|
| |||||||
|
Emerging Markets Targeted Value Portfolio |
|
|
0.85 |
% |
| ||
|
| |||||||
|
Emerging Markets ex China Core Equity Portfolio |
|
|
0.43 |
% |
| ||
|
| |||||||
International Small Company Portfolio
The Advisor has contractually agreed to waive all or a portion of its management fee and to assume the other direct expenses of a class of the Portfolio (excluding expenses incurred through its investment in other investment companies) (“Portfolio Expenses”) to the extent necessary to limit the Portfolio Expenses of a class of the Portfolio to the rate listed below as a percentage of the average net assets of a class of the Portfolio on an annualized basis (the “Expense Limitation Amount”). At any time that the Portfolio Expenses of a class of the Portfolio are less than Expense Limitation Amount for such class of shares of the Portfolio, the Advisor retains the right to recover any fees previously waived and/or expenses previously assumed to the extent that such recovery will not cause the annualized Portfolio Expenses for such class of shares of the Portfolio to exceed the applicable Expense Limitation Amount identified below. The Portfolio is not obligated to reimburse the Advisor for fees previously waived or expenses previously assumed by the Advisor more than thirty-six months before the date of such reimbursement.
|
|
|
| |||||
|
Portfolio |
Expense
Limitation | ||||||
|
International Small Company Portfolio |
|
|
0.45 |
% |
| ||
|
| |||||||
Japanese Small Company
Portfolio
Asia Pacific Small Company Portfolio
United Kingdom Small
Company Portfolio
Continental Small Company Portfolio
The Advisor has contractually agreed to permanently waive all or a portion of the management fee of each Portfolio listed below to the extent necessary to limit the total management fees paid to the Advisor by a Portfolio, including the proportionate share of the management fees a Portfolio pays indirectly through its investment in other funds managed by the Advisor, except for the fees paid indirectly through its investment of securities lending cash collateral in the Money Market Series, to 0.35% of the average net assets of a class of a Portfolio on an annualized basis (the “Permanent Fee Waiver”). In addition to the Permanent Fee Waiver, the Advisor has contractually agreed to further waive all or a portion of its management fee and to assume the other direct expenses of a class of a Portfolio (excluding expenses incurred through its investment in other investment companies managed by the Advisor) (“Portfolio Expenses”) to the extent necessary to limit the Portfolio Expenses of each class of the Portfolio to the rate listed below as a percentage of the average net assets of a class of a Portfolio on an annualized basis (the “Expense Limitation Amount”). At any time that the Portfolio Expenses of a class of a Portfolio are less than the applicable Expense Limitation Amount for such class of shares of the Portfolio, the Advisor retains the right to recover any fees previously waived and/or expenses previously assumed to the extent that such recovery will not cause the annualized Portfolio Expenses for such class of shares of the Portfolio to exceed the applicable Expense Limitation Amount identified below. Except, a Portfolio is not obligated to reimburse the Advisor for fees waived in connection with the Permanent Fee Waiver. Also, a Portfolio is not obligated to reimburse the Advisor for fees previously waived or expenses previously assumed by the Advisor more than thirty-six months before the date of such reimbursement.
190
|
|
|
| |||||
|
Portfolio |
Expense
Limitation | ||||||
|
Japanese Small Company Portfolio |
|
|
0.42 |
% |
| ||
|
| |||||||
|
Asia Pacific Small Company Portfolio |
|
|
0.42 |
% |
| ||
|
| |||||||
|
United Kingdom Small Company Portfolio |
|
|
0.42 |
% |
| ||
|
| |||||||
|
Continental Small Company Portfolio |
|
|
0.42 |
% |
| ||
|
| |||||||
DFA Global Real Estate Securities Portfolio
The Advisor has contractually agreed to waive all or a portion of its management fee and to assume the expenses of a class of the Portfolio (including the expenses that the Portfolio bears as a shareholder of other funds managed by the Advisor but excluding the expenses that the Portfolio incurs indirectly through investment of its securities lending cash collateral in the Money Market Series and its investment in unaffiliated investment companies) (“Portfolio Expenses”) to the extent necessary to limit the Portfolio Expenses of a class of the Portfolio, on an annualized basis, to the rate listed below as a percentage of the average net assets of a class of the Portfolio (the “Expense Limitation Amount”). At any time that the Portfolio Expenses of a class of the Portfolio are less than the Expense Limitation Amount for such class of shares of the Portfolio, the Advisor retains the right to recover any fees previously waived and/or expenses previously assumed to the extent that such recovery will not cause the annualized Portfolio Expenses for such class of shares of the Portfolio to exceed the applicable Expense Limitation Amount identified below. The Portfolio is not obligated to reimburse the Advisor for fees previously waived or expenses previously assumed by the Advisor more than thirty-six months before the date of such reimbursement.
|
|
|
| |||||
|
Portfolio |
Expense
Limitation | ||||||
|
DFA Global Real Estate Securities Portfolio |
0.22 |
% |
| ||||
|
| |||||||
World ex U.S. Value Portfolio
The Advisor has contractually agreed to waive up to the full amount of the Portfolio’s management fee of 0.32% to the extent necessary to offset the proportionate share of the management fees paid by the Portfolio through its investment in other funds managed by the Advisor, except for the fees paid through its investment of securities lending cash collateral in the Money Market Series (the “Underlying Funds”). In addition, the Advisor also agrees to waive all or a portion of the management fee that remains payable by the Portfolio (i.e., the management fee remaining after the proportionate share of the Underlying Funds’ management fees have been offset (the “Remaining Management Fee”)) to the extent necessary to reduce the Portfolio’s ordinary operating expenses (including expenses incurred through its investment in other investment companies but excluding the expenses that the Portfolio incurs indirectly through investment of its securities lending cash collateral in the Money Market Series) (“Portfolio Expenses”) to the rate listed below as a percentage of the average net assets of a class of the Portfolio on an annualized basis (the “Expense Limitation Amount”). The maximum amount that may be waived to limit Portfolio Expenses is the amount of the Remaining Management Fee. At any time that the Portfolio Expenses of a class of the Portfolio are less than the Expense Limitation Amount for such class of shares of the Portfolio, the Advisor retains the right to recover any fees previously waived and/or expenses previously assumed to the extent that such recovery will not cause the annualized Portfolio Expenses for such class of shares of the Portfolio to exceed the applicable Expense Limitation Amount identified below. The Portfolio is not obligated to reimburse the Advisor for fees previously waived or expenses previously assumed by the Advisor more than thirty-six months before the date of such reimbursement.
|
|
|
| |||||
|
Portfolio |
Expense
Limitation | ||||||
|
World ex U.S. Value Portfolio |
|
|
0.60 |
% |
| ||
|
| |||||||
191
World ex U.S. Core Equity Portfolio
The Advisor has contractually agreed to waive all or a portion of the management fee and to assume the expenses of a class of the Portfolio (including the expenses that the Portfolio bears as a shareholder of other funds managed by the Advisor but excluding the expenses that the Portfolio incurs indirectly through investment of its securities lending cash collateral in the Money Market Series and its investment in unaffiliated investment companies) (“Portfolio Expenses”) to the extent necessary to limit the Portfolio Expenses of a class of the Portfolio to the rate listed below as a percentage of the average net assets of a class of the Portfolio on an annualized basis (the “Expense Limitation Amount”). At any time that the Portfolio Expenses of a class of the Portfolio are less than the Expense Limitation Amount for such class of the Portfolio, the Advisor retains the right to recover any fees previously waived and/or expenses previously assumed to the extent that such recovery will not cause the annualized Portfolio Expenses of a class of the Portfolio to exceed the Expense Limitation Amount. The Portfolio is not obligated to reimburse the Advisor for fees previously waived or expenses previously assumed by the Advisor more than thirty-six months before the date of such reimbursement.
|
|
|
| |||||
|
Portfolio |
Expense
Limitation | ||||||
|
World ex U.S. Core Equity Portfolio |
|
|
0.39 |
% |
| ||
|
| |||||||
World Core Equity Portfolio
The Advisor has contractually agreed to waive up to the full amount of the Portfolio’s management fee of 0.22% to the extent necessary to offset the proportionate share of the management fees paid by the Portfolio through its investment in other funds managed by the Advisor, except for the fees paid through its investment of securities lending cash collateral in the Money Market Series (the “Underlying Funds”) (including the Portfolio’s proportionate share of any management fees that an Underlying Fund paid through its investment in an affiliated cash management fund). In addition, under the Fee Waiver Agreement, the Advisor has also agreed to assume the expenses of a class of the Portfolio to the extent necessary to reduce the ordinary operating expenses (including expenses incurred through its investment in other investment companies but excluding the expenses that the Portfolio incurs indirectly through investment of its securities lending cash collateral in the Money Market Series) (“Portfolio Expenses”) of a class of the Portfolio so that such Portfolio Expenses do not exceed the rate listed below as a percentage of the average net assets of a class of the Portfolio on an annualized basis (the “Expense Limitation Amount”). At any time that the Portfolio Expenses of a class of the Portfolio are less than the Expense Limitation Amount for such class of shares of the Portfolio, the Advisor retains the right to recover any fees previously waived and/or expenses previously assumed to the extent that such recovery will not cause the annualized Portfolio Expenses for such class of shares of the Portfolio to exceed the applicable Expense Limitation Amount. The Portfolio is not obligated to reimburse the Advisor for fees previously waived or expenses previously assumed by the Advisor more than thirty-six months before the date of such reimbursement.
|
|
|
| |||||
|
Portfolio |
Expense
Limitation | ||||||
|
World Core Equity Portfolio |
|
|
0.27 |
% |
| ||
|
| |||||||
Selectively Hedged Global Equity Portfolio
The Advisor has contractually agreed to waive up to the full amount of the Portfolio’s management fee of 0.24% to the extent necessary to offset the proportionate share of the management fees paid by the Portfolio through its investment in other funds managed by the Advisor, except for the fees paid through investment of securities lending cash collateral in the Money Market Series (the “Underlying Funds”). In addition, under the Fee Waiver Agreement, the Advisor has also agreed to waive all or a portion of the management fee and to assume the expenses of a class of the Portfolio to the extent necessary to reduce the ordinary operating expenses (including expenses incurred through its investment in other investment companies but excluding the expenses that the Portfolio incurs indirectly through its investment of its securities lending cash collateral in the Money Market Series) (“Portfolio Expenses”) of a class of the Portfolio, on an annualized basis, to the rate listed below as a percentage of the average net assets of the class of the Portfolio (the “Expense Limitation Amount”). At any time that the Portfolio Expenses of a class of the Portfolio are less than the Expense Limitation Amount for such class
192
of shares of the Portfolio, the Advisor retains the right to recover any fees previously waived and/or expenses previously assumed to the extent that such recovery will not cause the annualized Portfolio Expenses for such class of shares of the Portfolio to exceed the applicable Expense Limitation Amount identified below. The Portfolio is not obligated to reimburse the Advisor for fees previously waived or expenses previously assumed by the Advisor more than thirty-six months before the date of such reimbursement.
|
|
|
| |||||
|
Portfolio |
Expense
Limitation | ||||||
|
Selectively Hedged Global Equity Portfolio |
|
|
0.40 |
% |
| ||
|
| |||||||
Dividends, Capital Gains Distributions and Taxes
Dividends and Distributions. Each Portfolio intends to qualify each year as a regulated investment company under the Internal Revenue Code of 1986, as amended (the “Code”). As a regulated investment company, a Portfolio generally pays no federal income tax on the income and gains it distributes to you. Dividends from net investment income of the Portfolios (other than the Global Small Company Portfolio, DFA International Real Estate Securities Portfolio, DFA Global Real Estate Securities Portfolio, Japanese Small Company Portfolio, Asia Pacific Small Company Portfolio, Selectively Hedged Global Equity Portfolio, and Emerging Markets Targeted Value Portfolio) are distributed quarterly (on a calendar basis) and any net realized capital gains (after any reductions for available capital loss carryforwards) are distributed annually, typically in December. The Global Small Company Portfolio, DFA International Real Estate Securities Portfolio, DFA Global Real Estate Securities Portfolio, Japanese Small Company Portfolio, Asia Pacific Small Company Portfolio, Selectively Hedged Global Equity Portfolio, and Emerging Markets Targeted Value Portfolio make distributions from net investment income and any net realized capital gains (after any reductions for available capital loss carryforwards) annually, typically in December. The DFA International Small Cap Value Portfolio, Large Cap International Portfolio, International Core Equity Portfolio, Emerging Markets Core Equity Portfolio, and DFA International Real Estate Securities Portfolio, and any other Portfolio that becomes an investment option for the Advisor’s funds of funds in the future, may also make an additional dividend distribution from net investment income in October of each year. A Portfolio may distribute such income dividends and capital gains more frequently, if necessary, in order to reduce or eliminate federal excise or income taxes on the Portfolio.
Capital gains distributions may vary considerably from year to year as a result of a Portfolio’s normal investment activities and cash flows. During a time of economic volatility, a Portfolio may experience capital losses and unrealized depreciation in value of investments, the effect of which may be to reduce or eliminate capital gains distributions for a period of time. A Portfolio may be required to distribute taxable realized gains from a prior year, even if the Portfolio has a net realized loss for the year of distribution.
You will automatically receive all income dividends and capital gains distributions in additional shares of the Portfolio whose shares you hold at net asset value (as of the business date following the dividend record date), unless, upon written notice to the Advisor and completion of account information, you request to receive income dividends or capital gains distributions, or both, in cash.
193
|
|
|
|
|
| ||||||||||
|
Portfolio/Master Fund |
Net
Investment | |||||||||||||
|
Annually |
Quarterly | |||||||||||||
|
Large Cap International |
|
|
|
|
X |
|||||||||
|
| ||||||||||||||
|
DFA International Value |
|
|
|
|
X |
|||||||||
|
| ||||||||||||||
|
International Core Equity |
|
|
|
|
X |
|||||||||
|
| ||||||||||||||
|
Global Small Company |
|
|
X |
|
| |||||||||
|
| ||||||||||||||
|
International Small Company |
|
|
|
|
X |
|||||||||
|
| ||||||||||||||
|
Japanese Small Company |
|
|
X |
|
| |||||||||
|
| ||||||||||||||
|
Asia Pacific Small Company |
|
|
X |
|
| |||||||||
|
| ||||||||||||||
|
United Kingdom Small Company |
|
|
|
|
X |
|||||||||
|
| ||||||||||||||
|
Continental Small Company |
|
|
|
|
X |
|||||||||
|
| ||||||||||||||
|
DFA International Real Estate Securities |
|
|
X |
|
| |||||||||
|
| ||||||||||||||
|
DFA Global Real Estate Securities |
|
|
X |
|
| |||||||||
|
| ||||||||||||||
|
DFA International Small Cap Value |
|
|
|
|
X |
|||||||||
|
| ||||||||||||||
|
International Vector Equity |
|
|
|
|
X |
|||||||||
|
| ||||||||||||||
|
International High Relative Profitability |
|
|
|
|
X |
|||||||||
|
| ||||||||||||||
|
World ex U.S. Value |
|
|
|
|
X |
|||||||||
|
| ||||||||||||||
|
World ex U.S. Core Equity |
|
|
|
|
X |
|||||||||
|
| ||||||||||||||
|
World Core Equity |
|
|
|
|
X |
|||||||||
|
| ||||||||||||||
|
Selectively Hedged Global Equity |
|
|
X |
|
| |||||||||
|
| ||||||||||||||
|
Emerging Markets |
|
|
|
|
X |
|||||||||
|
| ||||||||||||||
|
Emerging Markets Value |
|
|
|
|
X |
|||||||||
|
| ||||||||||||||
|
Emerging Markets Small Cap |
|
|
|
|
X |
|||||||||
|
| ||||||||||||||
|
Emerging Markets Core Equity |
|
|
|
|
X |
|||||||||
|
| ||||||||||||||
|
Emerging Markets Targeted Value |
|
|
X |
|
| |||||||||
|
| ||||||||||||||
|
Emerging Markets ex China Core Equity |
|
|
|
|
X |
|||||||||
|
| ||||||||||||||
Annual Statements. Each year, you will receive a statement that shows the tax status of distributions you received the previous calendar year. Distributions declared in October, November or December to shareholders of record in such month, but paid in January, are taxable as if they were paid in December.
Avoid “Buying A Dividend.” At the time you purchase your Portfolio shares, a Portfolio’s net asset value may reflect undistributed income or undistributed capital gains. A subsequent distribution to you of such amounts, although constituting a return of your investment, would be taxable. Buying shares in a Portfolio just before it declares an income dividend or capital gains distribution is sometimes known as “buying a dividend.” In addition, a Portfolio’s net asset value may, at any time, reflect net unrealized appreciation, which may result in future taxable distributions to you.
Tax Considerations. This discussion of “Tax Considerations” should be read in conjunction with the remaining subsections below containing additional information. Also, unless otherwise indicated, the discussion below with respect to a Portfolio includes in the case of a Feeder Portfolio invested in a Master Fund or a Portfolio invested in an Underlying Fund classified as a partnership, its pro rata share of its corresponding Master Fund’s or Underlying Fund’s income and assets and in the case of a Portfolio invested in an Underlying Fund classified as a corporation, its pro rata share of the dividends and distributions paid by such Underlying Fund.
194
In general, if you are a taxable investor, Portfolio distributions are taxable to you as ordinary income, capital gains, or some combination of both. This is true whether you reinvest your distributions in additional Portfolio shares or receive them in cash.
For federal income tax purposes, Portfolio distributions of short-term capital gains are taxable to you at ordinary income rates. Portfolio distributions of long-term capital gains are taxable to you at long-term capital gain rates no matter how long you have owned your shares. A portfolio with a high portfolio turnover rate (a measure of how frequently assets within a portfolio are bought and sold) is more likely to generate short-term capital gains than a portfolio with a low portfolio turnover. A portion of income dividends reported by a Portfolio as qualified dividend income may be eligible for taxation by individual shareholders at long-term capital gain rates provided certain requirements are met.
Compared to other types of investments, derivatives may be less tax efficient. For example, the use of derivatives by a Portfolio may cause the Portfolio to realize higher amounts of ordinary income or short-term capital gain, distributions from which are taxable to individual shareholders at ordinary income tax rates rather than at the more favorable tax rates for long-term capital gains. Changes in government regulation of derivative instruments could affect the character, timing and amount of a Portfolio’s taxable income or gains, and may limit or prevent the Portfolio from using certain types of derivative instruments as a part of its investment strategy. A Portfolio’s use of derivatives also may be limited by the requirements for taxation of the Portfolio as a regulated investment company.
If a Portfolio qualifies to pass through to you the tax benefits from foreign taxes it pays on its investments, and elects to do so, then any foreign taxes it pays on these investments will be treated as paid by you. You will then be entitled either to deduct your share of these taxes in computing your taxable income, or to claim a foreign tax credit for these taxes against your U.S. federal income tax (subject to limitations for certain shareholders).
The Board of Trustees of a Master Fund reserves the right to change the entity classification of a Master Fund for U.S. federal income tax purposes at any time, as may be permitted or required under the Code. For instance, the Board might cause a Master Fund that is classified as a partnership to elect to be classified as a corporation and taxable as a regulated investment company or disregarded entity (if it has one shareholder) or vice versa. Such a change in entity classification may be prompted by, among other things, changes in law, the investment strategy of a Master Fund, or the nature and number of shareholders of a Master Fund or other factors or events adversely affecting the ability of a Master Fund to comply with the Code. A change in entity classification of a Master Fund may be a taxable event, causing the Master Fund and shareholders of the Master Fund that are subject to tax to recognize a taxable gain or loss. Such a change in entity classification would also cause the shareholders of the Master Fund to be subject to a different taxation regime, which may adversely affect some shareholders depending upon their particular circumstances.
Sale or Redemption of Portfolio Shares. The sale of shares of a Portfolio is a taxable event and may result in a capital gain or loss to you. Capital gain or loss may be realized from an ordinary redemption of shares or an exchange of shares between two Portfolios. Any loss incurred on the sale or exchange of a Portfolio’s shares, held for six months or less, will be treated as a long-term capital loss to the extent of capital gain dividends received with respect to such shares.
A Portfolio is required to report to you and the Internal Revenue Service annually on Form 1099-B not only the gross proceeds of Portfolio shares you sell or redeem but also the cost basis for shares you sell or redeem that were purchased or acquired on or after January 1, 2012. Cost basis will be calculated using the Portfolios’ default method of average cost, unless you instruct a Portfolio to use a different calculation method. Shareholders should carefully review the cost basis information provided by a Portfolio and make any additional basis, holding period or other adjustments that are required when reporting these amounts on their federal income tax returns. If your account is held by your investment representative (financial advisor or other broker), please contact that representative with respect to reporting of cost basis and available elections for your account. Tax-advantaged retirement accounts will not be affected.
Medicare Tax. An additional 3.8% Medicare tax is imposed on certain net investment income (including ordinary dividends and capital gain distributions received from a Portfolio and net gains from redemptions or other taxable dispositions of Portfolio shares) of U.S. individuals, estates and trusts to the extent that such person’s
195
“modified adjusted gross income” (in the case of an individual) or “adjusted gross income” (in the case of an estate or trust) exceeds a threshold amount. This Medicare tax, if applicable, is reported by you on, and paid with, your federal income tax return.
Backup Withholding. By law, a Portfolio may be required to withhold 24% of taxable dividends, capital gains distributions, and redemption proceeds paid to you if you do not provide your proper taxpayer identification number and certain required certifications. You may avoid this withholding requirement by providing and certifying on the account registration form your correct Taxpayer Identification Number and by certifying that you are not subject to backup withholding and are a U.S. person (including a U.S. resident alien). A Portfolio must also withhold if the Internal Revenue Service instructs it to do so.
State and Local Taxes. In addition to federal taxes, you may be subject to state and local taxes on distributions from a Portfolio and on gains arising on redemption or exchange of a Portfolio’s shares. Distributions of interest income and capital gains realized from certain types of U.S. Government securities may be exempt from state personal income taxes. To the extent an Underlying Fund organized as a corporation invests in U.S. Government obligations, distributions derived from interest on these obligations and paid to its corresponding Portfolio and, in turn, to shareholders are unlikely to be exempt from state and local income tax.
Non-U.S. Investors. Non-U.S. investors may be subject to U.S. withholding tax, at either the 30% statutory rate or a lower rate if you are a resident of a country that has a tax treaty with the U.S., and are subject to special U.S. tax certification requirements to avoid backup withholding and claim any treaty benefits. Exemptions from U.S. withholding tax are provided for certain capital gain dividends paid by a Portfolio from net long-term capital gains, if any, interest-related dividends paid by a Portfolio from its qualified net interest income from U.S. sources and short-term capital gain dividends, if such amounts are reported by a Portfolio. However, notwithstanding such exemptions from U.S. withholding at the source, any such dividends and distributions of income and capital gains will be subject to backup withholding at a rate of 24% if you fail to properly certify that you are not a U.S. person. Non-U.S. investors also may be subject to U.S. estate tax.
Other Reporting and Withholding Requirements. Under the Foreign Account Tax Compliance Act (“FATCA”), a Portfolio will be required to withhold a 30% tax on income dividends made by the Portfolio to certain foreign entities, referred to as foreign financial institutions or non-financial foreign entities, that fail to comply (or be deemed compliant) with extensive reporting and withholding requirements designed to inform the U.S. Department of the Treasury of U.S.-owned foreign investment accounts. After December 31, 2018, FATCA withholding also would have applied to certain capital gain distributions, return of capital distributions and the proceeds arising from the sale of Portfolio shares; however, based on proposed regulations issued by the Internal Revenue Service, which may be relied upon currently, such withholding is no longer required unless final regulations provide otherwise (which is not expected). A Portfolio may disclose the information that it receives from its shareholders to the Internal Revenue Service, non-U.S. taxing authorities or other parties as necessary to comply with FATCA or similar laws. Withholding also may be required if a foreign entity that is a shareholder of a Portfolio fails to provide the Portfolio with appropriate certifications or other documentation concerning its status under FATCA.
SPECIAL TAX CONSIDERATIONS FOR INVESTORS THAT INVEST IN DFA INTERNATIONAL REAL ESTATE SECURITIES PORTFOLIO, OR THE DFA GLOBAL REAL ESTATE SECURITIES PORTFOLIO.
PFIC Securities. The Portfolio may invest in securities of foreign entities that could be deemed for tax purposes to be PFICs. In general, any foreign corporation is considered a PFIC if 75% or more of its gross income for its taxable year is passive income, or 50% or more of its average assets (by value) are held for the production of passive income. When investing in PFIC securities, the Portfolio intends to mark-to-market these securities and recognize any unrealized gains as ordinary income at the end of its fiscal year. Deductions for losses are allowable only to the extent of any current or previously recognized gains. These gains (reduced by allowable losses) are treated as ordinary income that the Portfolio is required to distribute, even though it has not sold or received dividends from these securities. You should also be aware that the designation of a foreign security as a PFIC security will cause its income dividends to fall outside of the definition of qualified foreign corporation dividends. These dividends generally will not qualify for the reduced rate of taxation on qualified dividends when distributed to you by the Portfolio. Due to various complexities in identifying PFICs, the Portfolio can give no assurances that it will be able to identify portfolio securities in foreign corporations that are PFICs in time for the
196
Portfolio to make a mark-to-market election. If the Portfolio (or an Underlying Fund organized as a corporation) is unable to identify an investment as a PFIC and thus does not make a mark-to-market election, the Portfolio (or Underlying Fund) may be subject to U.S. federal income tax on a portion of any “excess distribution” or gain from the disposition of such shares even if such income is distributed as a taxable dividend by the Portfolio to its shareholders. Additional charges in the nature of interest may be imposed on the Portfolio (or Underlying Fund) in respect of deferred taxes arising from such distributions or gains. Any such taxes or interest charges could in turn reduce the Portfolio’s distributions paid to you.
Investment in U.S. REITS. A U.S. REIT is not subject to federal income tax on the income and gains it distributes to shareholders. Dividends paid by a U.S. REIT, other than capital gain distributions, will be taxable as ordinary income up to the amount of the U.S. REIT’s current and accumulated earnings and profits. Capital gain dividends paid by a U.S. REIT to a Portfolio will be treated as long-term capital gains by a Portfolio and, in turn, may be distributed by a Portfolio to its shareholders as a capital gain distribution. Because of certain noncash expenses, such as property depreciation, an equity U.S. REIT’s cash flow may exceed its taxable income. The equity U.S. REIT, and in turn a Portfolio, may distribute this excess cash to shareholders in the form of a return of capital distribution. However, if a U.S. REIT is operated in a manner that fails to qualify as a REIT, an investment in the U.S. REIT would become subject to double taxation, meaning the taxable income of the U.S. REIT would be subject to federal income tax at the corporate income tax rate without any deduction for dividends paid to shareholders and the dividends would be taxable to shareholders as ordinary income (or possibly as qualified dividend income) to the extent of the U.S. REIT’s current and accumulated earnings and profits.
Receipt of Excess Inclusion Income by a Portfolio. The Portfolio may derive “excess inclusion income” from certain equity interests in mortgage pooling vehicles either directly or through an investment in a U.S. REIT. Please see the SAI for a discussion of the risks and special tax consequences to tax-exempt and other shareholders in the event the Portfolio realizes excess inclusion income in excess of certain threshold amounts.
Investment in U.S. Real Property. The sale of a U.S. real property interest by a U.S. REIT or U.S. real property holding corporation in which a Portfolio invests may trigger special tax consequences to the Portfolio’s non-U.S. investors. Please see the SAI for a discussion of the risks and special tax consequences to shareholders from a sale of a U.S. real property interest by a U.S. REIT or U.S. real property holding corporation in which a Portfolio invests.
Qualified REIT dividends. Under 2017 legislation commonly known as the Tax Cuts and Jobs Act, “qualified REIT dividends” (i.e., ordinary REIT dividends other than capital gain dividends and portions of REIT dividends designated as qualified dividend income) are treated as eligible for a 20% deduction by noncorporate taxpayers.
A Portfolio may choose to report the special character of “qualified REIT dividends” to its shareholders, provided both the Fund and the shareholder meets certain holding period requirements with respect to their shares.
This discussion of “DIVIDENDS, CAPITAL GAINS DISTRIBUTIONS AND TAXES” is not intended or written to be used as tax advice. Because everyone’s tax situation is unique, you should consult your tax professional about federal, state, local or foreign tax consequences before making an investment in a Portfolio. Prospective investors should also consult the SAI.
Purchase of Shares
CASH PURCHASES
Investors who do not already have an agreement in place with a Fund may purchase Institutional Class shares of any Portfolio by first contacting the Portfolio’s transfer agent at (888) 576-1167. Investors that invest through a financial intermediary should contact such intermediary with regard to purchase instructions. The Portfolios generally are available for investment only by institutional clients, clients of registered investment advisors, clients of financial institutions, and a limited number of certain other investors, each as approved from time to time by the Advisor (“Eligible Investors”). Eligible Investors include employees, former employees, shareholders and directors of the Advisor and the Funds and friends and family members of such persons. The Portfolios generally are available for investment only to U.S. citizens, U.S. residents, and U.S. domestic corporations, partnerships,
197
trusts, or other entities. For purposes of this limitation, U.S. citizens and U.S. residents must reside in the U.S. and U.S. domestic corporations, partnerships, trusts, and other entities must have a U.S. address of record. All investments are subject to approval of the Advisor, and all investors must complete and submit the necessary account registration forms in good order. The Funds reserve the right to reject any initial or additional investment and to suspend the offering of shares of any Portfolio.
All purchases must be received in good order. “Good order” with respect to the purchase of shares means that (1) a fully completed and properly signed Account Registration Form and any additional supporting legal documentation required by the Advisor and/or transfer agent have been received in legible form, and (2) the transfer agent has been notified of the purchase, no later than the close of regular trading on the NYSE (normally, 4:00 p.m. ET) (“Market Close”) on the day of the purchase. It is the investor or financial intermediary’s responsibility to ensure notification is received in good order by the transfer agent prior to the Market Close on the purchase date.
Under certain conditions, Portfolios may accept and process purchase orders after the close of the NYSE on days that the NYSE unexpectedly closes early and may accept orders on a business day that the NYSE is unexpectedly closed. All orders will be processed at the next determined net asset value per share.
Payment
Payment of the total amount due should be made in U.S. dollars. If your payment is not received on settlement date, your purchase may be canceled. If an order to purchase shares must be canceled due to nonpayment, the purchaser will be responsible for any loss incurred by a Fund arising out of such cancellation. To recover any such loss, the Funds reserve the right to redeem shares owned by any purchaser whose order is canceled, and such purchaser may be prohibited or restricted in the manner of placing further orders.
Purchase by wire or check
Wire. Investors having an account with a bank that is a member or a correspondent of a member of the Federal Reserve System may purchase shares by wire after providing notification to the transfer agent by an approved method. The transfer agent can be reached by phone at (888) 576-1167. Notification must include the account number, account name, Portfolio number, trade date and purchase amount. On or before settlement date, the investor paying by wire must request their bank to transmit immediately available funds (federal funds) by wire to the Fund’s custodian for the account of DFA Investment Dimensions Group Inc. (specify the Portfolio) or, with regard to purchases of the DFA International Value Portfolio, for the account of Dimensional Investment Group Inc. Additional investments also may be made through the wire procedure by first notifying the transfer agent. If your payment is not received on settlement date, your purchase may be canceled.
Check. Investors who wish to purchase shares of any Portfolio by check should first call the Portfolio’s transfer agent at (888) 576-1167 for additional instructions. Checks should be made payable to Dimensional Funds. Reference the name of the Portfolio in which you wish to invest.
Shares also may be purchased and sold by individuals through securities firms that may charge a service fee or commission for such transactions. No such fee or commission is charged on shares that are purchased or redeemed directly from the Funds. Investors who are clients of investment advisory organizations may also be subject to investment advisory fees under their own arrangements with such organizations.
IN-KIND PURCHASES
If accepted by the Funds, shares of the Portfolios may be purchased in exchange for securities that are eligible for acquisition by the Portfolios (or their corresponding Master Funds or Underlying Funds) or otherwise represented in their portfolios as described in this Prospectus or as otherwise consistent with the Funds’ policies or procedures or in exchange for local currencies in which such securities of the Portfolios, or the Master Funds are denominated. Securities and local currencies accepted by the Funds for exchange and Fund shares to be issued in the exchange will be valued as set forth under “VALUATION OF SHARES” at the time of the next determination of net asset value after such acceptance. All dividends, interest, subscription, or other rights pertaining to such securities shall become the property of the Portfolio whose shares are being acquired and
198
must be delivered to the Fund by the investor upon receipt from the issuer. Investors who desire to purchase shares of the Portfolios with local currencies should first contact the Advisor.
The Funds will not accept securities in exchange for shares of a Portfolio unless: (1) such securities are, at the time of the exchange, eligible to be included, or otherwise represented, in the Portfolio whose shares are to be issued (or in its corresponding Master Fund or Underlying Funds) and current market values are available for such securities based on a Fund’s valuation procedures; (2) the investor represents and agrees that all securities offered to be exchanged are not subject to any restrictions upon their sale by the Portfolio under the Securities Act of 1933 or under the laws of the country in which the principal market for such securities exists, or otherwise; and (3) at the discretion of the respective Fund, the value of any such security (except U.S. government securities) being exchanged, together with other securities of the same issuer owned by the Portfolio, Master Fund or Underlying Fund, may not exceed 5% of the net assets of the Portfolio, Master Fund or Underlying Fund immediately after the transaction, however, this last limitation does not apply to the International Small Company Portfolio.
A gain or loss for federal income tax purposes will generally be realized by investors who are subject to federal taxation upon the exchange depending upon the cost of the securities or local currency exchanged. Investors interested in such exchanges should contact the Advisor. Purchases of shares will be made in full and fractional shares calculated to three decimal places. In the interest of economy and convenience, certificates for shares will not be issued.
Policy Regarding Excessive Short-Term Trading
The Portfolios are designed for long-term investors (except as described below) and are not intended for investors that engage in excessive short-term trading activity that may be harmful to the Portfolios, including but not limited to market timing. Excessive short-term trading into and out of the Portfolios can disrupt portfolio management strategies, harm performance and increase Portfolio expenses for all shareholders, including long-term shareholders who do not generate these costs.
In addition, certain Portfolios and Master Funds may be more susceptible to the risks of short-term trading than other Portfolios and Master Funds. The nature of the holdings of the International Portfolios and International Master Funds may present opportunities for a shareholder to engage in a short-term trading strategy that exploits possible delays between changes in the price of a Portfolio’s or Master Fund’s holdings and the reflection of those changes in the Portfolio’s net asset value (called “arbitrage market timing”). Such delays may occur because a Portfolio or its Master Fund, if applicable, has significant investments in foreign securities where, due to time zone differences, the values of those securities are established some time before the Portfolio and/or the Master Fund calculate their net asset values. In such circumstances, the available market prices for such foreign securities may not accurately reflect the latest indications of value at the time the International Portfolio calculates its net asset value. There is a possibility that arbitrage market timing may dilute the value of a Portfolio’s shares if redeeming shareholders receive proceeds (and purchasing shareholders receive shares) based upon a net asset value that does not reflect appropriate fair value prices.
The Boards of Directors of the Funds (collectively, the “Board”) have adopted a policy (the “Trading Policy”) and the Advisor and DFA Securities LLC (collectively, “Dimensional”) and Dimensional’s agents have implemented the following procedures, which are designed to discourage and prevent market timing or excessive short-term trading in the Funds: (i) trade activity monitoring and purchase blocking procedures; and (ii) use of fair value pricing.
The Funds, Dimensional and their agents monitor trades and flows of money in and out of the Portfolios from time to time in an effort to detect excessive short-term trading activities, and for consistent enforcement of the Trading Policy. The Funds reserve the right to take the actions necessary to stop excessive or disruptive trading activities, including refusing or canceling purchase or exchange orders for any reason, without prior notice, particularly purchase or exchange orders that the Funds believe are made on behalf of market timers. The Funds, Dimensional and their agents reserve the right to restrict, refuse or cancel any purchase or exchange request made by an investor indefinitely if the Funds or Dimensional believe that any combination of trading activity in
199
the accounts is potentially disruptive to a Portfolio. In making such judgments, the Funds and Dimensional seek to act in a manner that is consistent with the interests of shareholders. For purposes of applying these procedures, Dimensional may consider an investor’s trading history in the Portfolios, and accounts under common ownership, influence or control.
In addition to the Funds’ general ability to restrict potentially disruptive trading activity as described above, the Funds also have adopted purchase blocking procedures. Under the Funds’ purchase blocking procedures, where an investor has engaged in any two purchases and two redemptions (including redemptions that are part of an exchange transaction) in a Portfolio in any rolling 30 calendar day monitoring period (i.e., two “round trips”), the Funds and Dimensional intend to block the investor from making any additional purchases in that Portfolio for 90 calendar days (a “purchase block”). If implemented, a purchase block will begin at some point after the transaction that caused the investor to have engaged in the prohibited two round-trips is detected by the Funds, Dimensional, or their agents. The Funds and Dimensional are permitted to implement a longer purchase block, or permanently bar future purchases by an investor, if they determine that it is appropriate.
Under the Funds’ purchase blocking procedures, the following purchases and redemptions will not trigger a purchase block: (i) purchases and redemptions of shares having a value in each transaction of less than $25,000; (ii) purchases and redemptions by U.S. registered investment companies that operate as fund of funds and non-U.S. investment companies that operate as fund of funds that the Funds or Dimensional, in their sole discretion, have determined are not designed and/or are not serving as vehicles for excessive short-term or other disruptive trading (in each case, the fund of funds shall agree to be subject to monitoring by Dimensional); (iii) purchases and redemptions by a feeder portfolio of a master fund’s shares; (iv) systematic or automated transactions where the shareholder, financial advisor or investment fiduciary does not exercise direct control over the investment decision; (v) retirement plan contributions, loans, loan repayments and distributions (including hardship withdrawals) identified as such in the retirement plan recordkeeper’s system; (vi) purchase transactions involving transfers of assets, rollovers, Roth IRA conversions and IRA recharacterizations; (vii) purchases of shares with Portfolio dividends or capital gain distributions; (viii) transfers and reregistrations of shares within the same Portfolio; and (ix) transactions by 529 Plans. Notwithstanding the Funds’ purchase blocking procedures, all transactions in Portfolio shares are subject to the right of the Funds and Dimensional to restrict potentially disruptive trading activity (including purchases and redemptions described above that will not be subject to the purchase blocking procedures).
The Funds, Dimensional or their designees will have the ability, pursuant to Rule 22c-2 under the Investment Company Act of 1940 (the “1940 Act”), to request information from financial intermediaries, such as 401(k) plan administrators, trust companies and broker dealers (together, “Intermediaries”), concerning trades placed in omnibus and other multi-investor accounts (together, “Omnibus Accounts”), in order to attempt to monitor trades that are placed by the underlying shareholders of these Omnibus Accounts. The Funds, Dimensional and their designees will use the information obtained from the Intermediaries to monitor trading in the Funds and to attempt to identify shareholders in Omnibus Accounts engaged in trading that is inconsistent with the Trading Policy or otherwise not in the best interests of the Funds. The Funds, Dimensional or their designees, when they detect trading patterns in shares of the Funds that may constitute short-term or excessive trading, will provide written instructions to the Intermediary to restrict or prohibit further purchases or exchanges of shares of the Portfolios by a shareholder that has been identified as having engaged in excessive or short-term transactions in the Portfolios’ shares (directly or indirectly through the Intermediary’s account) that violate the Trading Policy.
The ability of the Funds and Dimensional to impose these limitations, including the purchase blocking procedures, on investors investing through Intermediaries is dependent on the receipt of information necessary to identify transactions by the underlying investors and the Intermediary’s cooperation in implementing the Trading Policy. Investors seeking to engage in excessive short-term trading practices may deploy a variety of strategies to avoid detection, and despite the efforts of the Funds and Dimensional to prevent excessive short-term trading, there is no assurance that the Funds, Dimensional or their agents will be able to identify those shareholders or curtail their trading practices. The ability of the Funds, Dimensional and their agents to detect and limit excessive short-term trading also may be restricted by operational systems and technological limitations.
Transactions in certain rebalancing programs and asset allocation programs, or fund-of-funds products, may be exempt from the Trading Policy subject to approval by the CCO. In addition, the purchase blocking procedures
200
will not apply to a redemption transaction in which a Portfolio distributes portfolio securities to a shareholder in-kind, where the redemption will not disrupt the efficient portfolio management of the Portfolio/Master Fund/Underlying Fund and the redemption is consistent with the interests of the remaining shareholders of the Portfolio/Master Fund/Underlying Fund.
The purchase blocking procedures of the Trading Policy do not apply to shareholders whose shares are held on the books of certain Intermediaries that have not expressly adopted procedures to implement this Policy. The Funds and Dimensional may work with Intermediaries to implement purchase blocking procedures or other procedures that the Funds and Dimensional determine are reasonably designed to achieve the objective of this Trading Policy. At the time the Intermediaries adopt these procedures, shareholders whose accounts are on the books of such Intermediaries will be subject to the Trading Policy’s purchase blocking procedures or another frequent trading policy that achieves the objective of the purchase blocking procedures. Investors that invest in the Portfolios through an Intermediary should contact the Intermediary for information concerning the policies and procedures that apply to the investor.
As of the date of this Prospectus, the ability of the Funds and Dimensional to apply the purchase blocking procedures on purchases by all investors and the ability of the Funds and Dimensional to monitor trades through Omnibus Accounts maintained by Intermediaries may be restricted due to systems limitations of both the Funds’ service providers and the Intermediaries. The Funds expect that the application of the Trading Policy as described above, including the purchase blocking procedures (subject to the limitations described above), will be able to be implemented by Intermediaries in compliance with Rule 22c-2 under the 1940 Act.
In addition to monitoring trade activity, the Board has approved fair value pricing procedures that govern the pricing of the securities of the Portfolios, Master Funds and Underlying Funds. These procedures are designed to help ensure that the prices at which Portfolio shares are purchased and redeemed are fair, and do not result in dilution of shareholder interests or other harm to shareholders. See the discussion under “VALUATION OF SHARES—Net Asset Value” for additional details regarding fair value pricing of the Portfolio’s securities.
Although the procedures are designed to discourage excessive short-term trading, none of the procedures individually nor all of the procedures taken together can completely eliminate the possibility that excessive short-term trading activity in a Portfolio may occur. The Portfolios, Master Funds and Underlying Funds do not knowingly accommodate excessive or disruptive trading activities, including market timing.
Valuation of Shares
NET ASSET VALUE
The net asset value per share of each class of each Portfolio and the net asset value per share of each Master Fund and Underlying Fund is calculated after the close of the NYSE (normally, 4:00 p.m. ET) by dividing the total value of the investments and other assets of the Portfolio, Master Fund or Underlying Fund less any liabilities, by the total outstanding shares of the stock of the respective Portfolio, Master Fund or Underlying Fund. Note: The time at which transactions and shares are priced may be changed in case of an emergency or if the NYSE closes at a time other than 4:00 p.m. ET.
The value of the shares of each Non-Feeder Portfolio will fluctuate in relation to its own investment experience. The value of the shares of the Feeder Portfolios and Funds of Funds will fluctuate in relation to the investment experience of the Master Funds or Underlying Funds in which such Portfolios invest. Securities held by the Portfolios, Master Funds and Underlying Funds will be valued in accordance with applicable laws and procedures approved by the Board of Directors or Trustees, and generally, as described below.
Securities held by the Portfolios, Master Funds and Underlying Funds (including over-the-counter securities) are valued at the last quoted sale price of the day. Securities held by the Portfolios, Master Funds and Underlying Funds that are listed on Nasdaq are valued at the Nasdaq Official Closing Price (“NOCP”). If there is no last reported sale price or NOCP of the day, the Portfolios, Master Funds and Underlying Funds value the securities at the mean between the most recent quoted bid and asked prices. Price information on listed securities is taken from the exchange where the security is primarily traded. Generally, options will be valued using the same
201
pricing methods discussed above. Generally, securities issued by open-end investment companies, such as the Master Funds and Underlying Funds, are valued using their respective net asset values or public offering prices, as appropriate, for purchase orders placed at the close of the NYSE.
Debt securities will be valued on the basis of prices provided by one or more pricing services or other reasonably reliable sources including broker/dealers that typically handle the purchase and sale of such securities. Securities which are traded over-the-counter and on a stock exchange generally will be valued according to the broadest and most representative market, and it is expected that for bonds and other fixed income securities, this ordinarily will be the over-the-counter market.
The value of the securities and other assets of the Portfolios, Master Funds and Underlying Funds for which no market quotations are readily available (including restricted securities), or for which market quotations have become unreliable, are determined in good faith at fair value in accordance with Rule 2a-5 under the 1940 Act pursuant to procedures approved by the Board of Directors or Trustees, as the case may be. Fair value pricing may also be used if events that have a significant effect on the value of an investment (as determined in the discretion of the Advisor) occur before the net asset value is calculated. When fair value pricing is used, the prices of securities used by the Portfolios, Master Funds and Underlying Funds may differ from the quoted or published prices for the same securities on their primary markets or exchanges.
To the extent that a Portfolio, Master Fund or Underlying Fund holds large numbers of securities, it is likely that it will have a larger number of securities that may be deemed illiquid and therefore must be valued pursuant to fair value pricing procedures approved by the Board of Directors or Trustees, than would a fund that holds a smaller number of securities. Portfolios that invest in small capitalization companies are more likely to hold illiquid securities than would a fund that invests in larger capitalization companies.
As of the date of this Prospectus, the Portfolios, Master Funds and Underlying Funds holding foreign equity securities (the “Foreign Equity Funds”) will also fair value price in the circumstances described below. Generally, trading in foreign securities markets is completed each day at various times before the close of the NYSE. For example, trading in the Japanese securities markets is completed each day at the close of the Tokyo Stock Exchange (normally, 2:00 a.m. ET), which is fourteen hours before the close of the NYSE (normally, 4:00 p.m. ET) and the time that the net asset values of the Foreign Equity Funds are computed. Due to the time differences between the closings of the relevant foreign securities exchanges and the time the Foreign Equity Funds price their shares at the close of the NYSE, the Foreign Equity Funds will fair value their foreign investments when it is determined that the market quotations for the foreign investments are either unreliable or not readily available. The fair value prices will attempt to reflect the impact of the U.S. financial markets’ perceptions and trading activities on the Foreign Equity Funds’ foreign investments since the last closing prices of the foreign investments were calculated on their primary foreign securities markets or exchanges. For these purposes, the Advisor has determined that movements in relevant indices or other appropriate market indicators, after the close of the Tokyo Stock Exchange or the London Stock Exchange, demonstrate that market quotations may be unreliable, and may trigger fair value pricing. Consequently, fair valuation of portfolio securities may occur on a daily basis. The fair value pricing by the Foreign Equity Funds utilizes data furnished by an independent pricing service (and that data draws upon, among other information, the market values of foreign investments). When a Foreign Equity Fund uses fair value pricing, the values assigned to the Foreign Equity Fund’s foreign investments may not be the quoted or published prices of the investments on their primary markets or exchanges. The Advisor monitors the operation of the method used to fair value price the Foreign Equity Funds’ foreign investments.
Valuing securities at fair value involves greater reliance on judgment than valuing securities that have readily available market quotations. There can be no assurance that a Portfolio, Master Fund or Underlying Fund could obtain the fair value assigned to a security if it were to sell the security at approximately the time at which the Portfolio, Master Fund or Underlying Fund determines its net asset value per share. As a result, the sale or redemption by a Portfolio, Master Fund or Underlying Fund of its shares at net asset value, at a time when a holding or holdings are valued at fair value, may have the effect of diluting or increasing the economic interest of existing shareholders.
The net asset values per share of the Portfolios (in respect to those Portfolios that are Feeder Portfolios or Funds of Funds, the Master Funds or Underlying Funds, respectively) are expressed in U.S. dollars by translating the net assets of each Portfolio, Master Fund or Underlying Fund using the mean of the most recent bid and asked prices
202
for the dollar as quoted by generally recognized reliable sources. Because the Portfolios and Master Funds and the International Underlying Funds own securities that are primarily traded in foreign markets which may trade on days when the Portfolios, Master Funds and Underlying Funds do not price their shares, the net asset values of the Portfolios and such Master Funds and Underlying Funds may change on days when shareholders will not be able to purchase or redeem shares.
The Portfolios, Master Funds and Underlying Funds generally calculate their net asset values per share and accept purchase and redemption orders on days that the NYSE is open for trading.
Certain of the securities holdings of the DFA International Real Estate Securities Portfolio, DFA Global Real Estate Securities Portfolio, International High Relative Profitability Portfolio, World ex U.S. Value Portfolio, World ex U.S. Core Equity Portfolio, World Core Equity Portfolio, the Emerging Markets Series, Emerging Markets Small Cap Series, the Emerging Markets Value Fund, Emerging Markets Core Equity Portfolio, Emerging Markets ex China Core Equity Portfolio and the Emerging Markets Targeted Value Portfolio in Approved Markets may be subject to tax, investment and currency repatriation regulations of the Approved Markets that could have a material effect on the values of the securities. For example, such funds might be subject to different levels of taxation on current income and realized gains depending upon the holding period of the securities. In general, a longer holding period (e.g., 5 years) may result in the imposition of lower tax rates than a shorter holding period (e.g., 1 year). The DFA Global Real Estate Securities Portfolio, the DFA International Real Estate Securities Portfolio, International High Relative Profitability Portfolio, World ex U.S. Value Portfolio, World ex U.S. Core Equity Portfolio, World Core Equity Portfolio, the Emerging Markets Master Funds, the Emerging Markets Core Equity Portfolio, the Emerging Markets ex China Core Equity Portfolio and the Emerging Markets Targeted Value Portfolio may also be subject to certain contractual arrangements with investment authorities in an Approved Market which require a Master Fund or Portfolio to maintain minimum holding periods or to limit the extent of repatriation of income and realized gains.
Futures contracts are valued using the settlement price established each day on the exchange on which they are traded. The value of such futures contracts held by a Portfolio, Master Fund or Underlying Fund is determined each day as of such close. In the absence of prices that are readily available as defined in Rule 2a-5, the futures contract will be valued in good faith at fair value in accordance with procedures approved by the Board of Directors or Trustees.
PUBLIC OFFERING PRICE
Provided that the transfer agent has received the investor’s purchase order in good order as described in “PURCHASE OF SHARES,” shares of the Portfolio selected will be priced at the public offering price, which is the net asset value of the shares next determined after receipt of such order. The transfer agent or the Funds may, from time to time, appoint sub-transfer agents or various financial intermediaries (“Intermediaries”) for the receipt of purchase orders, redemption orders and funds from certain investors. Intermediaries, in turn, are authorized to designate other financial intermediaries (“Sub-designees”) to receive purchase and redemption orders for the Portfolios’ shares from investors. With respect to such investors, the shares of the Portfolio selected will be priced at the public offering price calculated after receipt of the purchase order by the Intermediary or Sub-designee, as applicable, that is authorized to receive purchase orders. If the investor buys shares through an Intermediary or a Sub-designee, the purchase price will be the public offering price next calculated after the Intermediary or Sub-designee, as applicable, receives the order, rather than on the day the custodian receives the investor’s payment (provided that the Intermediary or Sub-designee, as applicable, has received the investor’s purchase order in good order, and the investor has complied with the Intermediary’s or Sub-designee’s payment procedures). No reimbursement fee or sales charge is imposed on purchases. If an order to purchase shares must be canceled due to non-payment, the purchaser will be responsible for any loss incurred by a Portfolio arising out of such cancellation. The Funds reserve the right to redeem shares owned by any purchaser whose order is canceled to recover any resulting loss to a Portfolio and may prohibit or restrict the manner in which such purchaser may place further orders.
When authorized by a Fund, certain financial institutions purchasing a Portfolio’s shares on behalf of customers or plan participants may place a purchase order unaccompanied by payment. Payment for these shares must be received by the time designated by the Fund (not to exceed the period established for settlement under
203
applicable regulations). If payment is not received by this time, the order may be cancelled. The financial institution is responsible for any costs or losses incurred by the Fund if payment is not received or delayed.
Exchange of Shares
Investors may exchange Institutional Class shares of one Portfolio for Institutional Class shares of another Portfolio by first contacting the Portfolio’s transfer agent at (888) 576-1167 to notify the transfer agent of the proposed exchange, and then sending a letter of instruction to the transfer agent by an approved method. Shareholders that invest in the Portfolios through a financial intermediary should contact their financial intermediary for information regarding exchanges.
Exchanges are accepted into those Portfolios that are eligible for the exchange privilege, subject to the purchase requirement set forth in the applicable Portfolio’s prospectus. Investors may contact the transfer agent at the above-listed phone number for more information on such exchanges, for a list of those Portfolios that accept exchanges, and to request a copy of the prospectuses of other Portfolios of DFA Investment Dimensions Group Inc. or Dimensional Investment Group Inc. that may be offered in an exchange. There is no fee imposed on an exchange. However, the Funds reserve the right to impose an administrative fee in order to cover the costs incurred in processing an exchange. Any such fee will be disclosed in the Prospectus. An exchange is treated as a redemption and a purchase. Therefore, an investor could realize a taxable gain or a loss on the transaction. The Funds reserve the right to revise or terminate the exchange privilege, or limit the amount of or reject any exchange, as deemed necessary, at any time.
The exchange privilege is not intended to afford shareholders a way to speculate on short-term movements in the markets. Accordingly, in order to prevent excessive use of the exchange privilege that may potentially disrupt the management of the Portfolios or otherwise adversely affect the Funds, any proposed exchange will be subject to the approval of the Advisor. Such approval will depend on: (i) the size of the proposed exchange; (ii) the prior number of exchanges by that shareholder; (iii) the nature of the underlying securities and the cash position of the Portfolios involved in the proposed exchange; (iv) the transaction costs involved in processing the exchange; and (v) the total number of redemptions by exchange already made out of a Portfolio. Excessive use of the exchange privilege is defined as any pattern of exchanges among portfolios by an investor that evidences market timing.
The redemption and purchase prices of shares redeemed and purchased by exchange, respectively, are the net asset values next determined after the transfer agent has received a letter of instruction in good order. “Good order” means a completed letter of instruction specifying the dollar amount to be exchanged, signed by all registered owners (or representatives thereof) of the shares; and if a Fund does not have on file the authorized signatures for the account, proof of authority. Exchanges will be accepted only if the shares of the Portfolio being acquired are registered in the investor’s state of residence.
Redemption of Shares
REDEMPTION PROCEDURE
Investors who desire to redeem shares of a Portfolio must first contact the Portfolio’s transfer agent at (888) 576-1167. Shareholders who invest in the Portfolios through a financial intermediary should contact their financial intermediary regarding redemption procedures. Each Portfolio will redeem shares at the net asset value of such shares next determined, after receipt of a written request for redemption in good order, by the transfer agent (or by an Intermediary or a Sub-designee, if applicable). “Good order” means that the request to redeem shares must include all necessary documentation, to be received in writing by the transfer agent no later than the close of regular trading on the NYSE (normally, 4:00 p.m. ET) (“Market Close”), including but not limited to, a letter of instruction specifying the number of shares or dollar amount to be redeemed, signed by all registered owners (or representatives thereof) of the shares and, if a Fund does not have on file the authorized signatures for the account, proof of authority. It is the investor or financial intermediary’s responsibility to ensure notification is received in good order by the transfer agent prior to the Market Close on the redemption date.
204
Under certain conditions, Portfolios may accept and process redemption orders after the close of the NYSE on days that the NYSE unexpectedly closes early and may accept orders on a business day that the NYSE is unexpectedly closed. All orders will be processed at the next determined net asset value per share.
Shareholders redeeming shares who do not already have an agreement in place with a Fund and have authorized redemption payment by wire in writing, may request that redemption proceeds be paid in federal funds wired to the bank they have designated in writing. The Funds reserve the right to send redemption proceeds by check in their discretion; a shareholder may request overnight delivery of such check at the shareholder’s own expense. If the proceeds are to be wired to a bank account that differs from the standing instructions on file, or paid by check to an address other than the address of record, the transfer agent may request a Medallion Signature Guarantee. If the proceeds are wired to the shareholder’s account at a bank that is not a member of the Federal Reserve System, there could be a delay in crediting the funds to the shareholder’s bank account. The Funds reserve the right at any time to suspend or terminate the redemption by wire procedure after prior notification to shareholders. No fee is charged for redemptions. The redemption of all shares in an account will result in the account being closed. A new Account Registration Form will be required for future investments. See “PURCHASE OF SHARES.” In the interests of economy and convenience, certificates for shares are not issued.
For redemption proceeds that are paid directly to a shareholder by a Portfolio, each Portfolio typically expects to send (via check, wire or automated clearing house) redemption payments within 1 business day after receipt of a written request for redemption in good order by the transfer agent. For payments that are made to an intermediary for transmittal to a shareholder, each Portfolio expects to pay redemption proceeds to the intermediary within 1 to 2 business days following the Portfolio’s receipt of the redemption order from the intermediary. Under certain circumstances and when deemed in the best interest of a Portfolio, redemption proceeds may take up to seven calendar days to be sent after receipt of the redemption request. In addition, with respect to investors redeeming shares that were purchased by check, payment will not be made until the Funds can verify that the payments for the purchase have been, or will be, collected, which may take more than seven calendar days. Investors may avoid this delay by submitting a certified check along with the purchase order.
Redemption proceeds will typically be paid by Federal Reserve wire payment. A Portfolio typically expects to satisfy redemption requests from available cash and cash equivalents or the sale of portfolio assets. In certain circumstances, such as stressed market conditions, a Portfolio may use other methods to meet redemptions, including the use of a line of credit or participating in an interfund lending program in reliance on exemptive relief from the SEC. In addition, as described below, a Portfolio reserves the right to meet redemption requests through an in-kind redemption, typically in response to a particularly large redemption, at the request of a client or in stressed market conditions. Also, see “Redemption and Transfer of Shares” in the SAI for information regarding redemption requests that exceed $250,000 or 1% of the value of a Portfolio’s assets, whichever is less.
REDEMPTION OF SMALL ACCOUNTS
With respect to each Portfolio, the Funds reserve the right to redeem an account if the value of the shares in a specific Portfolio is $500 or less. Before a Fund involuntarily redeems shares from such an account and sends the proceeds to the stockholder, the Fund will give written notice of the redemption to the stockholder at least sixty days before the redemption date. The stockholder will then have sixty days from the date of the notice to make an additional investment in order to bring the value of the shares in the account for a specific Portfolio to more than $500 and avoid such involuntary redemption. The redemption price to be paid to a stockholder for shares redeemed by a Fund under this right will be the aggregate net asset value of the shares in the account at the close of business on the redemption date.
IN-KIND REDEMPTIONS
When in the best interests of a Portfolio, a Portfolio that is not a Feeder Portfolio or Fund of Funds may also make a redemption payment, in whole or in part, by a distribution of portfolio securities that the Portfolio owns in lieu of cash. When in the best interests of a Feeder Portfolio or Fund of Funds, the Portfolio may make a redemption payment, in whole or in part, by a distribution of portfolio securities that the Feeder Portfolio or Fund of Funds receives from the Master Fund or Underlying Funds in lieu of cash. Such distributions may be pro rata or another method that is determined to be fair to both the redeeming shareholder and the remaining
205
shareholders in accordance with policies and procedures adopted by a Fund. The securities that the investor receives as redemption proceeds are subject to market risk until the investor liquidates those securities, and, if the proceeds include illiquid securities, the investor will bear the risk of not being able to sell the securities at all. Investors may also incur brokerage charges and other transaction costs selling securities that were received in payment of redemptions. The International Portfolios reserve the right to redeem their shares in the currencies in which their investments (and, in respect of the Feeder Portfolios and Funds of Funds, the currencies in which the investments of the corresponding Master Funds or Underlying Funds) are denominated. Investors may incur charges in converting such securities to dollars and the value of the securities may be affected by currency exchange fluctuations.
The Feeder Portfolios
Other institutional investors, including other mutual funds, may invest in each Master Fund. Accordingly, the expenses of such other funds and, correspondingly, their returns may differ from those of the Feeder Portfolios. Please contact The DFA Investment Trust Company and the Dimensional Emerging Markets Value Fund at 6300 Bee Cave Road, Building One, Austin, TX 78746, (512) 306-7400 for information about the availability of investing in a Master Fund other than through a Feeder Portfolio.
The aggregate amount of expenses for a Feeder Portfolio and the corresponding Master Fund may be greater than it would be if the Portfolio were to invest directly in the securities held by the corresponding Master Fund. However, the total expense ratios for the Feeder Portfolios and the Master Funds are expected to be less over time than such ratios would be if the Portfolios were to invest directly in the underlying securities. This arrangement enables various institutional investors, including the Feeder Portfolios, to pool their assets, which may be expected to result in economies by spreading certain fixed costs over a larger asset base. Each shareholder in a Master Fund, including a Feeder Portfolio, will pay its proportionate share of the expenses of that Master Fund. By investing in shares of the International Master Funds, Global Small Company Portfolio and International Small Company Portfolio will indirectly bear their pro rata share of the operating expenses, management expenses and brokerage costs of such Master Funds, as well as the expense of operating the Portfolio.
The shares of the Master Funds will be offered to institutional investors for the purpose of increasing the funds available for investment, to reduce expenses as a percentage of total assets and to achieve other economies that might be available at higher asset levels. Investment in a Master Fund by other institutional investors offers potential benefits to the Master Funds, and through their investment in the Master Funds, the Feeder Portfolios also. However, such economies and expense reductions might not be achieved, and additional investment opportunities, such as increased diversification, might not be available if other institutions do not invest in the Master Funds. Also, if an institutional investor were to redeem its interest in a Master Fund, the remaining investors in that Master Fund could experience higher pro rata operating expenses, thereby producing lower returns, and the Master Fund’s security holdings may become less diverse, resulting in increased risk. Institutional investors that have a greater pro rata ownership interest in a Master Fund than the corresponding Feeder Portfolio could have effective voting control over the operation of the Master Fund.
If the Board of Directors of the relevant Fund determines that it is in the best interest of a Feeder Portfolio, the Feeder Portfolio may withdraw its investment in a Master Fund at any time. Upon any such withdrawal, the Board would consider what action the Portfolio might take, including either seeking to invest its assets in another registered investment company with the same investment objective as the Portfolio, which might not be possible, or retaining an investment advisor to manage the Portfolio’s assets in accordance with its own investment objective, possibly at increased cost. Shareholders of a Feeder Portfolio will receive written notice thirty days before the effective date of any change in the investment objective of its corresponding Master Fund. A withdrawal by a Feeder Portfolio of its investment in the corresponding Master Fund could result in a distribution in kind of portfolio securities (as opposed to a cash distribution) to the Portfolio. Should such a distribution occur, the Portfolio could incur brokerage fees or other transaction costs in converting such securities to cash in order to pay redemptions. In addition, a distribution in kind to the Portfolio could result in a less diversified portfolio of investments and could affect adversely the liquidity of the Portfolio. Any net capital gains so realized will be distributed to such a Portfolio’s shareholders as described in “DIVIDENDS, CAPITAL GAINS DISTRIBUTIONS AND TAXES.”
206
Disclosure of Portfolio Holdings
Each Portfolio, Master Fund and Underlying Fund generally will disclose up to its 25 largest portfolio holdings (or with respect to a Feeder Portfolio, the holdings of its Master Fund) (other than cash and cash equivalents) and the percentages that each of these largest portfolio holdings represent of the total assets of the Portfolio, Master Fund or Underlying Fund, as of the most recent month-end, online at the Advisor’s public website, http://us.dimensional.com, within 20 days after the end of each month. Each Portfolio, Master Fund and Underlying Fund also generally will disclose its complete portfolio holdings (or with respect to a Feeder Portfolio, the holdings of its Master Fund) (other than cash and cash equivalents), as of month-end, online at the Advisor’s public website, 30 days following the month-end or more frequently and at different periods when authorized in accordance with the Portfolios, Master Funds and Underlying Funds’ policies and procedures. Each Portfolio, Master Fund and Underlying Fund may, but is not required to, disclose a list of portfolio securities that generally would be included as proceeds in a redemption in-kind, as frequently as on a daily basis, online at the Advisor’s public Web site. Please consult the SAI for a description of the other policies and procedures that govern disclosure of the portfolio holdings by the Portfolios, Master Funds and Underlying Funds.
Delivery of Shareholder Documents
To eliminate duplicate mailings and reduce expenses, the Portfolios may deliver a single copy of certain shareholder documents, such as this Prospectus and annual and semi-annual reports, to related shareholders at the same address, even if accounts are registered in different names. This practice is known as “householding.” The Portfolios will not household personal information documents, such as account statements. If you do not want the mailings of these documents to be combined with other members of your household, please call the transfer agent at (888) 576-1167. We will begin sending individual copies of the shareholder documents to you within 30 days of receiving your request.
Financial Highlights
The Financial Highlights table is meant to help you understand each Portfolio’s financial performance for the past 5 years or, if shorter, the period of that Portfolio’s operations, as indicated by the table. The total returns in the table represent the rate that you would have earned (or lost) on an investment in the Portfolio, assuming reinvestment of all dividends and distributions. This information has been audited by PricewaterhouseCoopers LLP, whose report, along with the Portfolios’ financial statements, is included in the annual reports. Further information about the Portfolios’ performance is contained in the annual reports, which are available upon request.
207
DFA Investment Dimensions Group Inc.
Financial
Highlights
(For a share
outstanding throughout each period)
|
|
|
|
|
|
|
|
|
|
|
| |||||||||||||||||||||||||
|
Large
Cap International Portfolio | |||||||||||||||||||||||||||||||||||
|
Year |
Year |
Year |
Year |
Year | |||||||||||||||||||||||||||||||
|
Net Asset Value, Beginning of Year |
|
$ |
|
27.63 |
|
$ |
|
20.90 |
|
|
$ |
|
22.78 |
|
|
$ |
|
21.29 |
|
$ |
|
23.52 |
|||||||||||||
|
| |||||||||||||||||||||||||||||||||||
|
Income From Investment Operations# |
|
|
|
|
|
|
|
|
|
| |||||||||||||||||||||||||
|
Net Investment Income (Loss) |
|
0.78 |
|
0.70 |
|
|
0.49 |
|
|
0.70 |
|
0.66 |
|||||||||||||||||||||||
|
Net Gains (Losses) on Securities (Realized and Unrealized) |
|
(6.54 |
) |
|
|
6.70 |
|
|
(1.87 |
) |
|
|
|
1.47 |
|
(2.25 |
) |
| |||||||||||||||||
|
| |||||||||||||||||||||||||||||||||||
|
Total From Investment Operations |
|
(5.76 |
) |
|
|
7.40 |
|
|
(1.38 |
) |
|
|
|
2.17 |
|
(1.59 |
) |
| |||||||||||||||||
|
| |||||||||||||||||||||||||||||||||||
|
Less Distributions |
|
|
|
|
|
|
|
|
|
| |||||||||||||||||||||||||
|
Net Investment Income |
|
(0.81 |
) |
|
|
(0.67 |
) |
|
|
|
(0.50 |
) |
|
|
|
(0.68 |
) |
|
|
(0.64 |
) |
| |||||||||||||
|
| |||||||||||||||||||||||||||||||||||
|
Total Distributions |
|
(0.81 |
) |
|
|
(0.67 |
) |
|
|
|
(0.50 |
) |
|
|
|
(0.68 |
) |
|
|
(0.64 |
) |
| |||||||||||||
|
| |||||||||||||||||||||||||||||||||||
|
Net Asset Value, End of Year |
|
$ |
|
21.06 |
|
$ |
|
27.63 |
|
|
$ |
|
20.90 |
|
|
$ |
|
22.78 |
|
$ |
|
21.29 |
|||||||||||||
|
| |||||||||||||||||||||||||||||||||||
|
Total Return |
|
(21.12 |
)% |
|
|
35.55 |
% |
|
|
|
(6.05 |
)% |
|
|
|
10.38 |
% |
|
|
(6.97 |
)% |
| |||||||||||||
|
| |||||||||||||||||||||||||||||||||||
|
Net Assets, End of Year (thousands) |
|
$ |
|
4,820,678 |
|
$ |
|
6,032,181 |
|
|
$ |
|
4,700,488 |
|
|
$ |
|
5,356,475 |
|
$ |
|
4,587,406 |
|||||||||||||
|
Ratio of Expenses to Average Net Assets |
|
0.17 |
% |
|
|
0.19 |
% |
|
|
|
0.22 |
% |
|
|
|
0.23 |
% |
|
|
0.23 |
% |
| |||||||||||||
|
Ratio of Expenses to Average Net Assets (Excluding Fees Waived, Expenses Reimbursed by Advisor and Fees Paid Indirectly) |
|
0.17 |
% |
|
|
0.19 |
% |
|
|
|
0.23 |
% |
|
|
|
0.24 |
% |
|
|
0.23 |
% |
| |||||||||||||
|
Ratio of Net Investment Income to Average Net Assets |
|
3.17 |
% |
|
|
2.65 |
% |
|
|
|
2.31 |
% |
|
|
|
3.22 |
% |
|
|
2.78 |
% |
| |||||||||||||
|
Portfolio Turnover Rate |
|
9 |
% |
|
|
14 |
% |
|
|
|
19 |
% |
|
|
|
7 |
% |
|
|
8 |
% |
| |||||||||||||
|
| |||||||||||||||||||||||||||||||||||
|
# |
Computed using average shares outstanding. |
208
Dimensional Investment Group Inc.
Financial
Highlights
(For a share
outstanding throughout each period)
|
|
|
|
|
|
|
|
|
|
| ||||||||||||||||||||||||||
|
DFA
International Value Portfolio | |||||||||||||||||||||||||||||||||||
|
Year |
Year |
Year |
Year |
Year | |||||||||||||||||||||||||||||||
|
Net Asset Value, Beginning of Year |
|
$ |
|
19.80 |
|
$ |
|
13.54 |
|
|
$ |
|
17.18 |
|
|
$ |
|
17.74 |
|
$ |
|
19.94 |
|||||||||||||
|
| |||||||||||||||||||||||||||||||||||
|
Income From Investment Operations# |
|
|
|
|
|
|
|
|
|
| |||||||||||||||||||||||||
|
Net Investment Income (Loss) |
|
0.79 |
|
0.62 |
|
|
0.38 |
|
|
0.63 |
|
0.60 |
|||||||||||||||||||||||
|
Net Gains (Losses) on Securities (Realized and Unrealized) |
|
(3.49 |
) |
|
|
6.23 |
|
|
(3.58 |
) |
|
|
|
(0.11 |
) |
|
|
(2.21 |
) |
| |||||||||||||||
|
| |||||||||||||||||||||||||||||||||||
|
Total From Investment Operations |
|
(2.70 |
) |
|
|
6.85 |
|
|
(3.20 |
) |
|
|
|
0.52 |
|
(1.61 |
) |
| |||||||||||||||||
|
| |||||||||||||||||||||||||||||||||||
|
Less Distributions |
|
|
|
|
|
|
|
|
|
| |||||||||||||||||||||||||
|
Net Investment Income |
|
(0.87 |
) |
|
|
(0.59 |
) |
|
|
|
(0.44 |
) |
|
|
|
(0.56 |
) |
|
|
(0.59 |
) |
| |||||||||||||
|
Net Realized Gains |
|
(0.04 |
) |
|
|
— |
|
|
— |
|
|
(0.52 |
) |
|
|
— |
|||||||||||||||||||
|
| |||||||||||||||||||||||||||||||||||
|
Total Distributions |
|
(0.91 |
) |
|
|
(0.59 |
) |
|
|
|
(0.44 |
) |
|
|
|
(1.08 |
) |
|
|
(0.59 |
) |
| |||||||||||||
|
| |||||||||||||||||||||||||||||||||||
|
Net Asset Value, End of Year |
|
$ |
|
16.19 |
|
$ |
|
19.80 |
|
|
$ |
|
13.54 |
|
|
$ |
|
17.18 |
|
$ |
|
17.74 |
|||||||||||||
|
| |||||||||||||||||||||||||||||||||||
|
Total Return |
|
(13.90 |
)% |
|
|
50.90 |
% |
|
|
|
(18.87 |
)% |
|
|
|
3.37 |
% |
|
|
(8.32 |
)% |
| |||||||||||||
|
| |||||||||||||||||||||||||||||||||||
|
Net Assets, End of Year (thousands) |
|
$ |
|
7,492,497 |
|
$ |
|
8,312,480 |
|
|
$ |
|
6,557,488 |
|
|
$ |
|
9,173,478 |
|
$ |
|
9,421,965 |
|||||||||||||
|
Ratio of Expenses to Average Net Assets* |
|
0.30 |
% |
|
|
0.36 |
% |
|
|
|
0.40 |
% |
|
|
|
0.44 |
% |
|
|
0.43 |
% |
| |||||||||||||
|
Ratio of Expenses to Average Net Assets (Excluding Fees Waived, Expenses Reimbursed by Advisor)* |
|
0.50 |
% |
|
|
0.56 |
% |
|
|
|
0.60 |
% |
|
|
|
0.64 |
% |
|
|
0.63 |
% |
| |||||||||||||
|
Ratio of Net Investment Income to Average Net Assets |
|
4.30 |
% |
|
|
3.36 |
% |
|
|
|
2.57 |
% |
|
|
|
3.70 |
% |
|
|
3.01 |
% |
| |||||||||||||
|
| |||||||||||||||||||||||||||||||||||
|
# |
Computed using average shares outstanding. | ||
|
* |
Represents the combined ratios for the respective portfolio and its respective pro-rata share of its Master Fund. |
209
DFA Investment Dimensions Group Inc.
Financial
Highlights
(For a share
outstanding throughout each period)
|
|
|
|
|
|
|
|
|
|
|
| |||||||||||||||||||||||||
|
International
Core Equity Portfolio | |||||||||||||||||||||||||||||||||||
|
Year |
Year |
Year |
Year |
Year | |||||||||||||||||||||||||||||||
|
Net Asset Value, Beginning of Year |
|
$ |
|
16.35 |
|
$ |
|
12.08 |
|
|
$ |
|
13.19 |
|
|
$ |
|
12.65 |
|
$ |
|
14.23 |
|||||||||||||
|
| |||||||||||||||||||||||||||||||||||
|
Income From Investment Operations# |
|
|
|
|
|
|
|
|
|
| |||||||||||||||||||||||||
|
Net Investment Income (Loss) |
|
0.47 |
|
0.40 |
|
|
0.28 |
|
|
0.41 |
|
0.38 |
|||||||||||||||||||||||
|
Net Gains (Losses) on Securities (Realized and Unrealized) |
|
(4.07 |
) |
|
|
4.24 |
|
|
(1.11 |
) |
|
|
|
0.53 |
|
(1.60 |
) |
| |||||||||||||||||
|
| |||||||||||||||||||||||||||||||||||
|
Total From Investment Operations |
|
(3.60 |
) |
|
|
4.64 |
|
|
(0.83 |
) |
|
|
|
0.94 |
|
(1.22 |
) |
| |||||||||||||||||
|
| |||||||||||||||||||||||||||||||||||
|
Less Distributions |
|
|
|
|
|
|
|
|
|
| |||||||||||||||||||||||||
|
Net Investment Income |
|
(0.53 |
) |
|
|
(0.37 |
) |
|
|
|
(0.28 |
) |
|
|
|
(0.40 |
) |
|
|
(0.36 |
) |
| |||||||||||||
|
| |||||||||||||||||||||||||||||||||||
|
Total Distributions |
|
(0.53 |
) |
|
|
(0.37 |
) |
|
|
|
(0.28 |
) |
|
|
|
(0.40 |
) |
|
|
(0.36 |
) |
| |||||||||||||
|
| |||||||||||||||||||||||||||||||||||
|
Net Asset Value, End of Year |
|
$ |
|
12.22 |
|
$ |
|
16.35 |
|
|
$ |
|
12.08 |
|
|
$ |
|
13.19 |
|
$ |
|
12.65 |
|||||||||||||
|
| |||||||||||||||||||||||||||||||||||
|
Total Return |
|
(22.29 |
)% |
|
|
38.56 |
% |
|
|
|
(6.32 |
)% |
|
|
|
7.67 |
% |
|
|
(8.79 |
)% |
| |||||||||||||
|
| |||||||||||||||||||||||||||||||||||
|
Net Assets, End of Year (thousands) |
|
$ |
|
26,208,206 |
|
$ |
|
34,629,583 |
|
|
$ |
|
24,965,561 |
|
|
$ |
|
30,559,427 |
|
$ |
|
27,174,589 |
|||||||||||||
|
Ratio of Expenses to Average Net Assets |
|
0.24 |
% |
|
|
0.25 |
% |
|
|
|
0.30 |
% |
|
|
|
0.29 |
% |
|
|
0.30 |
% |
| |||||||||||||
|
Ratio of Expenses to Average Net Assets (Excluding Fees Waived, Expenses Reimbursed by Advisor and Fees Paid Indirectly) |
|
0.24 |
% |
|
|
0.25 |
% |
|
|
|
0.30 |
% |
|
|
|
0.31 |
% |
|
|
0.30 |
% |
| |||||||||||||
|
Ratio of Net Investment Income to Average Net Assets |
|
3.27 |
% |
|
|
2.56 |
% |
|
|
|
2.24 |
% |
|
|
|
3.21 |
% |
|
|
2.67 |
% |
| |||||||||||||
|
Portfolio Turnover Rate |
|
11 |
% |
|
|
8 |
% |
|
|
|
4 |
% |
|
|
|
6 |
% |
|
|
4 |
% |
| |||||||||||||
|
| |||||||||||||||||||||||||||||||||||
|
# |
Computed using average shares outstanding. |
210
DFA Investment Dimensions Group Inc.
Financial
Highlights
(For a share
outstanding throughout each period)
|
|
|
|
|
|
|
|
|
|
| ||||||||||||||||||||||||||
|
Global Small Company Portfolio | |||||||||||||||||||||||||||||||||||
|
Year |
Year |
Year |
Year |
Year | |||||||||||||||||||||||||||||||
|
Net Asset Value, Beginning of Year |
|
$ |
|
15.52 |
|
$ |
|
10.50 |
|
|
$ |
|
11.07 |
|
|
$ |
|
10.73 |
|
$ |
|
11.53 |
|||||||||||||
|
| |||||||||||||||||||||||||||||||||||
|
Income From Investment Operations# |
|
|
|
|
|
|
|
|
|
| |||||||||||||||||||||||||
|
Net Investment Income (Loss) |
|
0.23 |
|
0.22 |
|
|
0.15 |
|
|
0.18 |
|
0.19 |
|||||||||||||||||||||||
|
Net Gains (Losses) on Securities (Realized and Unrealized) |
|
(2.68 |
) |
|
|
4.97 |
|
|
(0.55 |
) |
|
|
|
0.27 |
|
(0.75 |
) |
| |||||||||||||||||
|
| |||||||||||||||||||||||||||||||||||
|
Total From Investment Operations |
|
(2.45 |
) |
|
|
5.19 |
|
|
(0.40 |
) |
|
|
|
0.45 |
|
(0.56 |
) |
| |||||||||||||||||
|
| |||||||||||||||||||||||||||||||||||
|
Less Distributions |
|
|
|
|
|
|
|
|
|
| |||||||||||||||||||||||||
|
Net Investment Income |
|
(0.25 |
) |
|
|
(0.17 |
) |
|
|
|
(0.17 |
) |
|
|
|
(0.11 |
) |
|
|
(0.17 |
) |
| |||||||||||||
|
Net Realized Gains |
|
(0.30 |
) |
|
|
— |
|
|
— |
|
|
— |
|
(0.07 |
) |
| |||||||||||||||||||
|
| |||||||||||||||||||||||||||||||||||
|
Total Distributions |
|
(0.55 |
) |
|
|
(0.17 |
) |
|
|
|
(0.17 |
) |
|
|
|
(0.11 |
) |
|
|
(0.24 |
) |
| |||||||||||||
|
| |||||||||||||||||||||||||||||||||||
|
Net Asset Value, End of Year |
|
$ |
|
12.52 |
|
$ |
|
15.52 |
|
|
$ |
|
10.50 |
|
|
$ |
|
11.07 |
|
$ |
|
10.73 |
|||||||||||||
|
| |||||||||||||||||||||||||||||||||||
|
Total Return |
|
(16.32 |
)% |
|
|
49.81 |
% |
|
|
|
(3.75 |
)% |
|
|
|
4.29 |
% |
|
|
(5.02 |
)% |
| |||||||||||||
|
| |||||||||||||||||||||||||||||||||||
|
Net Assets, End of Year (thousands) |
|
$ |
|
82,920 |
|
$ |
|
99,631 |
|
|
$ |
|
43,568 |
|
|
$ |
|
41,286 |
|
$ |
|
31,380 |
|||||||||||||
|
Ratio of Expenses to Average Net Assets+,** |
|
0.44 |
% |
|
|
0.47 |
% |
|
|
|
0.47 |
% |
|
|
|
0.49 |
% |
|
|
0.49 |
% |
| |||||||||||||
|
Ratio of Expenses to Average Net Assets (Excluding Fees Waived, Expenses Reimbursed by Advisor)+,** |
|
0.66 |
% |
|
|
0.71 |
% |
|
|
|
0.85 |
% |
|
|
|
0.93 |
% |
|
|
0.90 |
% |
| |||||||||||||
|
Ratio of Net Investment Income to Average Net Assets |
|
1.66 |
% |
|
|
1.49 |
% |
|
|
|
1.50 |
% |
|
|
|
1.69 |
% |
|
|
1.58 |
% |
| |||||||||||||
|
| |||||||||||||||||||||||||||||||||||
|
** The Ratio of Expenses to Average Net Assets is inclusive of acquired fund fees and expenses incurred by the Portfolio indirectly as a result of Portfolio’s investment in Underlying Funds as follows: |
|
0.22 |
% |
|
|
0.24 |
% |
|
|
|
0.27 |
% |
|
|
|
0.27 |
% |
|
|
0.26 |
% |
| |||||||||||||
|
| |||||||||||||||||||||||||||||||||||
|
# |
Computed using average shares outstanding. | |||||||||||||||||||||||||||||||||||||||||||||||||||||||||||||||||||||||||||||||||||||||||||||||||
|
+ |
Represents the combined ratios for the respective portfolio and its respective pro-rata share of its Master and Underlying Funds. | |||||||||||||||||||||||||||||||||||||||||||||||||||||||||||||||||||||||||||||||||||||||||||||||||
211
DFA Investment Dimensions Group Inc.
Financial
Highlights
(For a share
outstanding throughout each period)
|
|
|
|
|
|
|
|
|
|
|
| |||||||||||||||||||||||||
|
International
Small Company Portfolio | |||||||||||||||||||||||||||||||||||
|
Year |
Year |
Year |
Year |
Year | |||||||||||||||||||||||||||||||
|
Net Asset Value, Beginning of Year |
|
$ |
|
23.29 |
|
$ |
|
16.84 |
|
|
$ |
|
18.21 |
|
|
$ |
|
18.46 |
|
$ |
|
21.52 |
|||||||||||||
|
| |||||||||||||||||||||||||||||||||||
|
Income From Investment Operations# |
|
|
|
|
|
|
|
|
|
| |||||||||||||||||||||||||
|
Net Investment Income (Loss) |
|
0.54 |
|
0.41 |
|
|
0.33 |
|
|
0.43 |
|
0.46 |
|||||||||||||||||||||||
|
Net Gains (Losses) on Securities (Realized and Unrealized) |
|
(6.44 |
) |
|
|
6.42 |
|
|
(0.93 |
) |
|
|
|
0.58 |
|
(2.41 |
) |
| |||||||||||||||||
|
| |||||||||||||||||||||||||||||||||||
|
Total From Investment Operations |
|
(5.90 |
) |
|
|
6.83 |
|
|
(0.60 |
) |
|
|
|
1.01 |
|
(1.95 |
) |
| |||||||||||||||||
|
| |||||||||||||||||||||||||||||||||||
|
Less Distributions |
|
|
|
|
|
|
|
|
|
| |||||||||||||||||||||||||
|
Net Investment Income |
|
(0.67 |
) |
|
|
(0.38 |
) |
|
|
|
(0.37 |
) |
|
|
|
(0.44 |
) |
|
|
(0.44 |
) |
| |||||||||||||
|
Net Realized Gains |
|
(0.79 |
) |
|
|
— |
|
|
(0.40 |
) |
|
|
|
(0.82 |
) |
|
|
(0.67 |
) |
| |||||||||||||||
|
| |||||||||||||||||||||||||||||||||||
|
Total Distributions |
|
(1.46 |
) |
|
|
(0.38 |
) |
|
|
|
(0.77 |
) |
|
|
|
(1.26 |
) |
|
|
(1.11 |
) |
| |||||||||||||
|
| |||||||||||||||||||||||||||||||||||
|
Net Asset Value, End of Year |
|
$ |
|
15.93 |
|
$ |
|
23.29 |
|
|
$ |
|
16.84 |
|
|
$ |
|
18.21 |
|
$ |
|
18.46 |
|||||||||||||
|
| |||||||||||||||||||||||||||||||||||
|
Total Return |
|
(26.55 |
)% |
|
|
40.83 |
% |
|
|
|
(3.64 |
)% |
|
|
|
6.44 |
% |
|
|
(9.54 |
)% |
| |||||||||||||
|
| |||||||||||||||||||||||||||||||||||
|
Net Assets, End of Year (thousands) |
|
$ |
|
9,320,095 |
|
$ |
|
13,465,853 |
|
|
$ |
|
10,148,132 |
|
|
$ |
|
12,750,110 |
|
$ |
|
12,656,204 |
|||||||||||||
|
Ratio of Expenses to Average Net Assets*,@ |
|
0.41 |
% |
|
|
0.46 |
% |
|
|
|
0.53 |
% |
|
|
|
0.54 |
% |
|
|
0.53 |
% |
| |||||||||||||
|
Ratio of Expenses to Average Net Assets (Excluding Fees Waived, Expenses Reimbursed by Advisor)*,@ |
|
0.41 |
% |
|
|
0.46 |
% |
|
|
|
0.53 |
% |
|
|
|
0.54 |
% |
|
|
0.53 |
% |
| |||||||||||||
|
Ratio of Net Investment Income to Average Net Assets |
|
2.79 |
% |
|
|
1.90 |
% |
|
|
|
1.96 |
% |
|
|
|
2.44 |
% |
|
|
2.18 |
% |
| |||||||||||||
|
| |||||||||||||||||||||||||||||||||||
|
@ The Ratio of Expenses to Average Net Assets is inclusive of acquired fund fees and expenses incurred by the Portfolio indirectly as a result of Portfolio’s investment in Underlying Funds as follows: |
|
0.12 |
% |
|
|
0.12 |
% |
|
|
|
0.12 |
% |
|
|
|
0.12 |
% |
|
|
0.12 |
% |
| |||||||||||||
|
| |||||||||||||||||||||||||||||||||||
|
# |
Computed using average shares outstanding. | ||
|
* |
Represents the combined ratios for the respective portfolio and its respective pro-rata share of its Master Funds. |
212
DFA Investment Dimensions Group Inc.
Financial
Highlights
(For a share
outstanding throughout each period)
|
|
|
|
|
|
|
|
|
|
|
| |||||||||||||||||||||||||
|
Japanese
Small Company Portfolio | |||||||||||||||||||||||||||||||||||
|
Year |
Year |
Year |
Year |
Year | |||||||||||||||||||||||||||||||
|
Net Asset Value, Beginning of Year |
|
$ |
|
25.80 |
|
$ |
|
23.39 |
|
|
$ |
|
24.89 |
|
|
$ |
|
25.70 |
|
$ |
|
28.56 |
|||||||||||||
|
| |||||||||||||||||||||||||||||||||||
|
Income From Investment Operations# |
|
|
|
|
|
|
|
|
|
| |||||||||||||||||||||||||
|
Net Investment Income (Loss) |
|
0.48 |
|
0.44 |
|
|
0.40 |
|
|
0.45 |
|
0.43 |
|||||||||||||||||||||||
|
Net Gains (Losses) on Securities (Realized and Unrealized) |
|
(6.33 |
) |
|
|
2.51 |
|
|
(0.91 |
) |
|
|
|
0.37 |
|
(2.59 |
) |
| |||||||||||||||||
|
| |||||||||||||||||||||||||||||||||||
|
Total From Investment Operations |
|
(5.85 |
) |
|
|
2.95 |
|
|
(0.51 |
) |
|
|
|
0.82 |
|
(2.16 |
) |
| |||||||||||||||||
|
| |||||||||||||||||||||||||||||||||||
|
Less Distributions |
|
|
|
|
|
|
|
|
|
| |||||||||||||||||||||||||
|
Net Investment Income |
|
(0.53 |
) |
|
|
(0.54 |
) |
|
|
|
(0.61 |
) |
|
|
|
(0.28 |
) |
|
|
(0.70 |
) |
| |||||||||||||
|
Net Realized Gains |
|
(0.73 |
) |
|
|
— |
|
|
(0.38 |
) |
|
|
|
(1.35 |
) |
|
|
— |
|||||||||||||||||
|
| |||||||||||||||||||||||||||||||||||
|
Total Distributions |
|
(1.26 |
) |
|
|
(0.54 |
) |
|
|
|
(0.99 |
) |
|
|
|
(1.63 |
) |
|
|
(0.70 |
) |
| |||||||||||||
|
| |||||||||||||||||||||||||||||||||||
|
Net Asset Value, End of Year |
|
$ |
|
18.69 |
|
$ |
|
25.80 |
|
|
$ |
|
23.39 |
|
|
$ |
|
24.89 |
|
$ |
|
25.70 |
|||||||||||||
|
| |||||||||||||||||||||||||||||||||||
|
Total Return |
|
(23.79 |
)% |
|
|
12.66 |
% |
|
|
|
(2.32 |
)% |
|
|
|
4.01 |
% |
|
|
(7.82 |
)% |
| |||||||||||||
|
| |||||||||||||||||||||||||||||||||||
|
Net Assets, End of Year (thousands) |
|
$ |
|
267,551 |
|
$ |
|
379,837 |
|
|
$ |
|
466,696 |
|
|
$ |
|
640,068 |
|
$ |
|
622,650 |
|||||||||||||
|
Ratio of Expenses to Average Net Assets* |
|
0.42 |
% |
|
|
0.47 |
% |
|
|
|
0.54 |
% |
|
|
|
0.55 |
% |
|
|
0.53 |
% |
| |||||||||||||
|
Ratio of Expenses to Average Net Assets (Excluding Fees Waived, Expenses Reimbursed by Advisor)* |
|
0.52 |
% |
|
|
0.57 |
% |
|
|
|
0.64 |
% |
|
|
|
0.65 |
% |
|
|
0.63 |
% |
| |||||||||||||
|
Ratio of Net Investment Income to Average Net Assets |
|
2.24 |
% |
|
|
1.69 |
% |
|
|
|
1.74 |
% |
|
|
|
1.91 |
% |
|
|
1.49 |
% |
| |||||||||||||
|
| |||||||||||||||||||||||||||||||||||
|
# |
Computed using average shares outstanding. | ||
|
* |
Represents the combined ratios for the respective portfolio and its respective pro-rata share of its Master Fund. |
213
DFA Investment Dimensions Group Inc.
Financial
Highlights
(For a share
outstanding throughout each period)
|
|
|
|
|
|
|
|
|
|
|
| |||||||||||||||||||||||||
|
Asia
Pacific Small Company Portfolio | |||||||||||||||||||||||||||||||||||
|
Year |
Year |
Year |
Year |
Year | |||||||||||||||||||||||||||||||
|
Net Asset Value, Beginning of Year |
|
$ |
|
26.94 |
|
$ |
|
20.13 |
|
|
$ |
|
21.11 |
|
|
$ |
|
20.83 |
|
$ |
|
23.71 |
|||||||||||||
|
| |||||||||||||||||||||||||||||||||||
|
Income From Investment Operations# |
|
|
|
|
|
|
|
|
|
| |||||||||||||||||||||||||
|
Net Investment Income (Loss) |
|
0.84 |
|
0.75 |
|
|
0.75 |
|
|
0.77 |
|
0.84 |
|||||||||||||||||||||||
|
Net Gains (Losses) on Securities (Realized and Unrealized) |
|
(7.40 |
) |
|
|
6.74 |
|
|
(0.77 |
) |
|
|
|
0.19 |
|
(2.76 |
) |
| |||||||||||||||||
|
| |||||||||||||||||||||||||||||||||||
|
Total From Investment Operations |
|
(6.56 |
) |
|
|
7.49 |
|
|
(0.02 |
) |
|
|
|
0.96 |
|
(1.92 |
) |
| |||||||||||||||||
|
| |||||||||||||||||||||||||||||||||||
|
Less Distributions |
|
|
|
|
|
|
|
|
|
| |||||||||||||||||||||||||
|
Net Investment Income |
|
(1.07 |
) |
|
|
(0.68 |
) |
|
|
|
(0.96 |
) |
|
|
|
(0.68 |
) |
|
|
(0.96 |
) |
| |||||||||||||
|
Net Realized Gains |
|
(1.92 |
) |
|
|
— |
|
— |
|
— |
|
— |
|||||||||||||||||||||||
|
| |||||||||||||||||||||||||||||||||||
|
Total Distributions |
|
(2.99 |
) |
|
|
(0.68 |
) |
|
|
|
(0.96 |
) |
|
|
|
(0.68 |
) |
|
|
(0.96 |
) |
| |||||||||||||
|
| |||||||||||||||||||||||||||||||||||
|
Net Asset Value, End of Year |
|
$ |
|
17.39 |
|
$ |
|
26.94 |
|
|
$ |
|
20.13 |
|
|
$ |
|
21.11 |
|
$ |
|
20.83 |
|||||||||||||
|
| |||||||||||||||||||||||||||||||||||
|
Total Return |
|
(26.90 |
)% |
|
|
37.81 |
% |
|
|
|
(0.23 |
)% |
|
|
|
4.81 |
% |
|
|
(8.51 |
)% |
| |||||||||||||
|
| |||||||||||||||||||||||||||||||||||
|
Net Assets, End of Year (thousands) |
|
$ |
|
230,202 |
|
$ |
|
381,490 |
|
|
$ |
|
378,682 |
|
|
$ |
|
340,649 |
|
$ |
|
346,335 |
|||||||||||||
|
Ratio of Expenses to Average Net Assets* |
|
0.42 |
% |
|
|
0.48 |
% |
|
|
|
0.54 |
% |
|
|
|
0.57 |
% |
|
|
0.54 |
% |
| |||||||||||||
|
Ratio of Expenses to Average Net Assets (Excluding Fees Waived, Expenses Reimbursed by Advisor)* |
|
0.52 |
% |
|
|
0.58 |
% |
|
|
|
0.64 |
% |
|
|
|
0.67 |
% |
|
|
0.64 |
% |
| |||||||||||||
|
Ratio of Net Investment Income to Average Net Assets |
|
3.95 |
% |
|
|
3.01 |
% |
|
|
|
3.92 |
% |
|
|
|
3.65 |
% |
|
|
3.57 |
% |
| |||||||||||||
|
| |||||||||||||||||||||||||||||||||||
|
# |
Computed using average shares outstanding. | ||
|
* |
Represents the combined ratios for the respective portfolio and its respective pro-rata share of its Master Fund. |
214
DFA Investment Dimensions Group Inc.
Financial
Highlights
(For a share
outstanding throughout each period)
|
|
|
|
|
|
|
|
|
|
|
| |||||||||||||||||||||||||
|
United
Kingdom Small Company Portfolio | |||||||||||||||||||||||||||||||||||
|
Year |
Year |
Year |
Year |
Year | |||||||||||||||||||||||||||||||
|
Net Asset Value, Beginning of Year |
|
$ |
|
31.72 |
|
$ |
|
21.35 |
|
|
$ |
|
27.85 |
|
|
$ |
|
26.95 |
|
$ |
|
32.67 |
|||||||||||||
|
| |||||||||||||||||||||||||||||||||||
|
Income From Investment Operations# |
|
|
|
|
|
|
|
|
|
| |||||||||||||||||||||||||
|
Net Investment Income (Loss) |
|
0.94 |
|
0.58 |
|
|
0.43 |
|
|
0.76 |
|
0.85 |
|||||||||||||||||||||||
|
Net Gains (Losses) on Securities (Realized and Unrealized) |
|
(11.25 |
) |
|
|
10.31 |
|
|
(4.00 |
) |
|
|
|
1.68 |
|
(3.65 |
) |
| |||||||||||||||||
|
| |||||||||||||||||||||||||||||||||||
|
Total From Investment Operations |
|
(10.31 |
) |
|
|
10.89 |
|
|
(3.57 |
) |
|
|
|
2.44 |
|
(2.80 |
) |
| |||||||||||||||||
|
| |||||||||||||||||||||||||||||||||||
|
Less Distributions |
|
|
|
|
|
|
|
|
|
| |||||||||||||||||||||||||
|
Net Investment Income |
|
(0.97 |
) |
|
|
(0.52 |
) |
|
|
|
(0.68 |
) |
|
|
|
(0.47 |
) |
|
|
(0.79 |
) |
| |||||||||||||
|
Net Realized Gains |
|
(0.55 |
) |
|
|
— |
|
|
(2.25 |
) |
|
|
|
(1.07 |
) |
|
|
(2.13 |
) |
| |||||||||||||||
|
| |||||||||||||||||||||||||||||||||||
|
Total Distributions |
|
(1.52 |
) |
|
|
(0.52 |
) |
|
|
|
(2.93 |
) |
|
|
|
(1.54 |
) |
|
|
(2.92 |
) |
| |||||||||||||
|
| |||||||||||||||||||||||||||||||||||
|
Net Asset Value, End of Year |
|
$ |
|
19.89 |
|
$ |
|
31.72 |
|
|
$ |
|
21.35 |
|
|
$ |
|
27.85 |
|
$ |
|
26.95 |
|||||||||||||
|
| |||||||||||||||||||||||||||||||||||
|
Total Return |
|
(33.62 |
)% |
|
|
51.31 |
% |
|
|
|
(15.27 |
)% |
|
|
|
10.14 |
% |
|
|
(9.34 |
)% |
| |||||||||||||
|
| |||||||||||||||||||||||||||||||||||
|
Net Assets, End of Year (thousands) |
|
$ |
|
18,398 |
|
$ |
|
44,133 |
|
|
$ |
|
16,867 |
|
|
$ |
|
26,540 |
|
$ |
|
36,351 |
|||||||||||||
|
Ratio of Expenses to Average Net Assets* |
|
0.56 |
% |
|
|
0.59 |
% |
|
|
|
0.59 |
% |
|
|
|
0.59 |
% |
|
|
0.58 |
% |
| |||||||||||||
|
Ratio of Expenses to Average Net Assets (Excluding Fees Waived, Expenses Reimbursed by Advisor)* |
|
0.66 |
% |
|
|
0.74 |
% |
|
|
|
0.86 |
% |
|
|
|
0.82 |
% |
|
|
0.68 |
% |
| |||||||||||||
|
Ratio of Net Investment Income to Average Net Assets |
|
3.62 |
% |
|
|
1.88 |
% |
|
|
|
1.89 |
% |
|
|
|
2.92 |
% |
|
|
2.75 |
% |
| |||||||||||||
|
| |||||||||||||||||||||||||||||||||||
|
# |
Computed using average shares outstanding. | ||
|
* |
Represents the combined ratios for the respective portfolio and its respective pro-rata share of its Master Fund. |
215
DFA Investment Dimensions Group Inc.
Financial
Highlights
(For a share
outstanding throughout each period)
|
|
|
|
|
|
|
|
|
|
|
| |||||||||||||||||||||||||
|
Continental
Small Company Portfolio | |||||||||||||||||||||||||||||||||||
|
Year |
Year |
Year |
Year |
Year | |||||||||||||||||||||||||||||||
|
Net Asset Value, Beginning of Year |
|
$ |
|
35.27 |
|
$ |
|
23.82 |
|
|
$ |
|
24.84 |
|
|
$ |
|
24.37 |
|
$ |
|
28.24 |
|||||||||||||
|
| |||||||||||||||||||||||||||||||||||
|
Income From Investment Operations# |
|
|
|
|
|
|
|
|
|
| |||||||||||||||||||||||||
|
Net Investment Income (Loss) |
|
0.76 |
|
0.57 |
|
|
0.40 |
|
|
0.55 |
|
0.61 |
|||||||||||||||||||||||
|
Net Gains (Losses) on Securities (Realized and Unrealized) |
|
(10.80 |
) |
|
|
11.45 |
|
|
(1.04 |
) |
|
|
|
1.23 |
|
(3.68 |
) |
| |||||||||||||||||
|
| |||||||||||||||||||||||||||||||||||
|
Total From Investment Operations |
|
(10.04 |
) |
|
|
12.02 |
|
|
(0.64 |
) |
|
|
|
1.78 |
|
(3.07 |
) |
| |||||||||||||||||
|
| |||||||||||||||||||||||||||||||||||
|
Less Distributions |
|
|
|
|
|
|
|
|
|
| |||||||||||||||||||||||||
|
Net Investment Income |
|
(0.80 |
) |
|
|
(0.57 |
) |
|
|
|
(0.38 |
) |
|
|
|
(0.51 |
) |
|
|
(0.59 |
) |
| |||||||||||||
|
Net Realized Gains |
|
(0.68 |
) |
|
|
— |
|
|
— |
|
|
(0.80 |
) |
|
|
(0.21 |
) |
| |||||||||||||||||
|
| |||||||||||||||||||||||||||||||||||
|
Total Distributions |
|
(1.48 |
) |
|
|
(0.57 |
) |
|
|
|
(0.38 |
) |
|
|
|
(1.31 |
) |
|
|
(0.80 |
) |
| |||||||||||||
|
| |||||||||||||||||||||||||||||||||||
|
Net Asset Value, End of Year |
|
$ |
|
23.75 |
|
$ |
|
35.27 |
|
|
$ |
|
23.82 |
|
|
$ |
|
24.84 |
|
$ |
|
24.37 |
|||||||||||||
|
| |||||||||||||||||||||||||||||||||||
|
Total Return |
|
(29.26 |
)% |
|
|
50.70 |
% |
|
|
|
(2.63 |
)% |
|
|
|
7.94 |
% |
|
|
(11.14 |
)% |
| |||||||||||||
|
| |||||||||||||||||||||||||||||||||||
|
Net Assets, End of Year (thousands) |
|
$ |
|
616,323 |
|
$ |
|
867,759 |
|
|
$ |
|
537,744 |
|
|
$ |
|
657,105 |
|
$ |
|
645,651 |
|||||||||||||
|
Ratio of Expenses to Average Net Assets* |
|
0.42 |
% |
|
|
0.47 |
% |
|
|
|
0.54 |
% |
|
|
|
0.56 |
% |
|
|
0.54 |
% |
| |||||||||||||
|
Ratio of Expenses to Average Net Assets (Excluding Fees Waived, Expenses Reimbursed by Advisor)* |
|
0.52 |
% |
|
|
0.57 |
% |
|
|
|
0.64 |
% |
|
|
|
0.66 |
% |
|
|
0.64 |
% |
| |||||||||||||
|
Ratio of Net Investment Income to Average Net Assets |
|
2.61 |
% |
|
|
1.76 |
% |
|
|
|
1.68 |
% |
|
|
|
2.30 |
% |
|
|
2.16 |
% |
| |||||||||||||
|
| |||||||||||||||||||||||||||||||||||
|
# |
Computed using average shares outstanding. | ||
|
* |
Represents the combined ratios for the respective portfolio and its respective pro-rata share of its Master Fund. |
216
DFA Investment Dimensions Group Inc.
Financial
Highlights
(For a share
outstanding throughout each period)
|
|
|
|
|
|
|
|
|
|
|
| |||||||||||||||||||||||||
|
DFA
International Real Estate Securities Portfolio | |||||||||||||||||||||||||||||||||||
|
Year |
Year |
Year |
Year |
Year | |||||||||||||||||||||||||||||||
|
Net Asset Value, Beginning of Year |
|
$ |
|
5.04 |
|
$ |
|
3.77 |
|
|
$ |
|
5.61 |
|
|
$ |
|
4.85 |
|
$ |
|
5.07 |
|||||||||||||
|
| |||||||||||||||||||||||||||||||||||
|
Income From Investment Operations# |
|
|
|
|
|
|
|
|
|
| |||||||||||||||||||||||||
|
Net Investment Income (Loss) |
|
0.15 |
|
0.16 |
|
|
0.15 |
|
|
0.20 |
|
0.22 |
|||||||||||||||||||||||
|
Net Gains (Losses) on Securities (Realized and Unrealized) |
|
(1.44 |
) |
|
|
1.11 |
|
|
(1.35 |
) |
|
|
|
0.83 |
|
(0.22 |
) |
| |||||||||||||||||
|
| |||||||||||||||||||||||||||||||||||
|
Total From Investment Operations |
|
(1.29 |
) |
|
|
1.27 |
|
|
(1.20 |
) |
|
|
|
1.03 |
|
— |
|||||||||||||||||||
|
| |||||||||||||||||||||||||||||||||||
|
Less Distributions |
|
|
|
|
|
|
|
|
|
| |||||||||||||||||||||||||
|
Net Investment Income |
|
(0.37 |
) |
|
|
— |
|
|
(0.64 |
) |
|
|
|
(0.27 |
) |
|
|
(0.22 |
) |
| |||||||||||||||
|
| |||||||||||||||||||||||||||||||||||
|
Total Distributions |
|
(0.37 |
) |
|
|
— |
|
|
(0.64 |
) |
|
|
|
(0.27 |
) |
|
|
(0.22 |
) |
| |||||||||||||||
|
| |||||||||||||||||||||||||||||||||||
|
Net Asset Value, End of Year |
|
$ |
|
3.38 |
|
$ |
|
5.04 |
|
|
$ |
|
3.77 |
|
|
$ |
|
5.61 |
|
$ |
|
4.85 |
|||||||||||||
|
| |||||||||||||||||||||||||||||||||||
|
Total Return |
|
(27.50 |
)% |
|
|
33.69 |
% |
|
|
|
(23.98 |
)% |
|
|
|
22.54 |
% |
|
|
(0.24 |
)% |
| |||||||||||||
|
| |||||||||||||||||||||||||||||||||||
|
Net Assets, End of Year (thousands) |
|
$ |
|
4,452,148 |
|
$ |
|
5,987,464 |
|
|
$ |
|
4,646,848 |
|
|
$ |
|
6,297,963 |
|
$ |
|
5,442,507 |
|||||||||||||
|
Ratio of Expenses to Average Net Assets |
|
0.27 |
% |
|
|
0.27 |
% |
|
|
|
0.26 |
% |
|
|
|
0.27 |
% |
|
|
0.28 |
% |
| |||||||||||||
|
Ratio of Expenses to Average Net Assets (Excluding Fees Waived, Expenses Reimbursed by Advisor and Fees Paid Indirectly) |
|
0.27 |
% |
|
|
0.27 |
% |
|
|
|
0.27 |
% |
|
|
|
0.28 |
% |
|
|
0.28 |
% |
| |||||||||||||
|
Ratio of Net Investment Income to Average Net Assets |
|
3.67 |
% |
|
|
3.29 |
% |
|
|
|
3.61 |
% |
|
|
|
4.01 |
% |
|
|
4.27 |
% |
| |||||||||||||
|
Portfolio Turnover Rate |
|
6 |
% |
|
|
8 |
% |
|
|
|
12 |
% |
|
|
|
8 |
% |
|
|
5 |
% |
| |||||||||||||
|
| |||||||||||||||||||||||||||||||||||
|
# |
Computed using average shares outstanding. |
217
DFA Investment Dimensions Group Inc.
Financial
Highlights
(For a share
outstanding throughout each period)
|
|
|
|
|
|
|
|
|
|
| ||||||||||||||||||||||||||
|
DFA
Global Real Estate Securities Portfolio | |||||||||||||||||||||||||||||||||||
|
Year |
Year |
Year |
Year |
Year | |||||||||||||||||||||||||||||||
|
Net Asset Value, Beginning of Year |
|
$ |
|
13.29 |
|
$ |
|
9.57 |
|
|
$ |
|
12.71 |
|
|
$ |
|
10.71 |
|
$ |
|
10.90 |
|||||||||||||
|
| |||||||||||||||||||||||||||||||||||
|
Income From Investment Operations# |
|
|
|
|
|
|
|
|
|
| |||||||||||||||||||||||||
|
Net Investment Income (Loss) |
|
0.49 |
|
0.16 |
|
|
0.68 |
|
|
0.34 |
** |
|
|
0.48 |
|||||||||||||||||||||
|
Net Gains (Losses) on Securities (Realized and Unrealized) |
|
(3.32 |
) |
|
|
3.80 |
|
|
(3.00 |
) |
|
|
|
2.16 |
** |
|
|
(0.26 |
) |
| |||||||||||||||
|
| |||||||||||||||||||||||||||||||||||
|
Total From Investment Operations |
|
(2.83 |
) |
|
|
3.96 |
|
|
(2.32 |
) |
|
|
|
2.50 |
|
0.22 |
|||||||||||||||||||
|
| |||||||||||||||||||||||||||||||||||
|
Less Distributions |
|
|
|
|
|
|
|
|
|
| |||||||||||||||||||||||||
|
Net Investment Income |
|
(0.48 |
) |
|
|
(0.20 |
) |
|
|
|
(0.70 |
) |
|
|
|
(0.50 |
) |
|
|
(0.34 |
) |
| |||||||||||||
|
Net Realized Gains |
|
(0.12 |
) |
|
|
(0.04 |
) |
|
|
|
(0.12 |
) |
|
|
|
(— |
) |
|
|
(0.07 |
) |
| |||||||||||||
|
| |||||||||||||||||||||||||||||||||||
|
Total Distributions |
|
(0.60 |
) |
|
|
(0.24 |
) |
|
|
|
(0.82 |
) |
|
|
|
(0.50 |
) |
|
|
(0.41 |
) |
| |||||||||||||
|
| |||||||||||||||||||||||||||||||||||
|
Net Asset Value, End of Year |
|
$ |
|
9.86 |
|
$ |
|
13.29 |
|
|
$ |
|
9.57 |
|
|
$ |
|
12.71 |
|
$ |
|
10.71 |
|||||||||||||
|
| |||||||||||||||||||||||||||||||||||
|
Total Return |
|
(22.34 |
)% |
|
|
42.08 |
% |
|
|
|
(19.28 |
)% |
|
|
|
24.55 |
% |
|
|
1.91 |
% |
| |||||||||||||
|
| |||||||||||||||||||||||||||||||||||
|
Net Assets, End of Year (thousands) |
|
$ |
|
7,871,073 |
|
$ |
|
10,537,586 |
|
|
$ |
|
7,225,825 |
|
|
$ |
|
9,269,011 |
|
$ |
|
7,475,924 |
|||||||||||||
|
Ratio of Expenses to Average Net Assets*,@ |
|
0.24 |
% |
|
|
|
0.24 |
% |
|
|
0.24 |
% |
|
|
|
0.24 |
% |
|
|
0.24 |
% |
| |||||||||||||
|
Ratio of Expenses to Average Net Assets (Excluding Fees Waived, Expenses Reimbursed by Advisor and Fees Paid Indirectly)*,@ |
|
0.33 |
% |
|
|
|
0.34 |
% |
|
|
0.34 |
% |
|
|
|
0.35 |
% |
|
|
0.35 |
% |
| |||||||||||||
|
Ratio of Net Investment Income to Average Net Assets |
|
4.14 |
% |
|
|
1.33 |
% |
|
|
|
6.44 |
% |
|
|
|
2.95 |
%** |
|
|
4.42 |
% |
| |||||||||||||
|
Portfolio Turnover Rate |
|
1 |
% |
|
|
1 |
% |
|
|
|
0 |
% |
|
|
|
0 |
% |
|
|
3 |
% |
| |||||||||||||
|
| |||||||||||||||||||||||||||||||||||
|
@ The Ratio of Expenses to Average Net Assets is inclusive of acquired fund fees and expenses incurred by the Portfolio indirectly as a result of Portfolio’s investment in Underlying Funds as follows: |
|
0.10 |
% |
|
|
0.11 |
% |
|
|
|
0.12 |
% |
|
|
|
0.13 |
% |
|
|
0.13 |
% |
| |||||||||||||
|
| |||||||||||||||||||||||||||||||||||
|
# |
Computed using average shares outstanding. | ||
|
* |
Represents the combined ratios for the respective portfolio and its respective pro-rata share of its Underlying Funds. | ||
|
** |
The Net Investment Income (Loss) per share and the ratio of Net Investment Income to Average Net Assets includes the current year effect of an estimation related to a one time distribution from a real estate investment trust. Net Investment Income (Loss) per share, Net Gain (Loss) per share and the ratio of Net Investment Income to Average Net Assets would have been $0.39, $2.11 and 3.39%, respectively had the current year effect of this estimation not been considered. |
218
DFA Investment Dimensions Group Inc.
Financial
Highlights
(For a share
outstanding throughout each period)
|
|
|
|
|
|
|
|
|
|
|
| |||||||||||||||||||||||||
|
DFA
International Small Cap Value Portfolio | |||||||||||||||||||||||||||||||||||
|
Year |
Year |
Year |
Year |
Year | |||||||||||||||||||||||||||||||
|
Net Asset Value, Beginning of Year |
|
$ |
|
22.14 |
|
$ |
|
15.65 |
|
|
$ |
|
18.58 |
|
|
$ |
|
19.24 |
|
$ |
|
23.51 |
|||||||||||||
|
| |||||||||||||||||||||||||||||||||||
|
Income From Investment Operations# |
|
|
|
|
|
|
|
|
|
| |||||||||||||||||||||||||
|
Net Investment Income (Loss) |
|
0.61 |
|
0.44 |
|
|
0.33 |
|
|
0.45 |
|
0.47 |
|||||||||||||||||||||||
|
Net Gains (Losses) on Securities (Realized and Unrealized) |
|
(5.05 |
) |
|
|
6.48 |
|
|
(2.65 |
) |
|
|
|
(0.01 |
) |
|
|
(3.44 |
) |
| |||||||||||||||
|
| |||||||||||||||||||||||||||||||||||
|
Total From Investment Operations |
|
(4.44 |
) |
|
|
6.92 |
|
|
(2.32 |
) |
|
|
|
0.44 |
|
(2.97 |
) |
| |||||||||||||||||
|
| |||||||||||||||||||||||||||||||||||
|
Less Distributions |
|
|
|
|
|
|
|
|
|
| |||||||||||||||||||||||||
|
Net Investment Income |
|
(0.73 |
) |
|
|
(0.43 |
) |
|
|
|
(0.32 |
) |
|
|
|
(0.48 |
) |
|
|
(0.56 |
) |
| |||||||||||||
|
Net Realized Gains |
|
(0.16 |
) |
|
|
— |
|
|
(0.29 |
) |
|
|
|
(0.62 |
) |
|
|
(0.74 |
) |
| |||||||||||||||
|
| |||||||||||||||||||||||||||||||||||
|
Total Distributions |
|
(0.89 |
) |
|
|
(0.43 |
) |
|
|
|
(0.61 |
) |
|
|
|
(1.10 |
) |
|
|
(1.30 |
) |
| |||||||||||||
|
| |||||||||||||||||||||||||||||||||||
|
Net Asset Value, End of Year |
|
$ |
|
16.81 |
|
$ |
|
22.14 |
|
|
$ |
|
15.65 |
|
|
$ |
|
18.58 |
|
$ |
|
19.24 |
|||||||||||||
|
| |||||||||||||||||||||||||||||||||||
|
Total Return |
|
(20.53 |
)% |
|
|
44.61 |
% |
|
|
|
(13.03 |
)% |
|
|
|
2.94 |
% |
|
|
(13.37 |
)% |
| |||||||||||||
|
| |||||||||||||||||||||||||||||||||||
|
Net Assets, End of Year (thousands) |
|
$ |
|
9,664,700 |
|
$ |
|
12,784,711 |
|
|
$ |
|
9,887,928 |
|
|
$ |
|
13,428,084 |
|
$ |
|
13,787,695 |
|||||||||||||
|
Ratio of Expenses to Average Net Assets |
|
0.46 |
% |
|
|
0.53 |
% |
|
|
|
0.65 |
% |
|
|
|
0.68 |
% |
|
|
0.68 |
% |
| |||||||||||||
|
Ratio of Expenses to Average Net Assets (Excluding Fees Paid Indirectly) |
|
0.46 |
% |
|
|
0.53 |
% |
|
|
|
0.66 |
% |
|
|
|
0.69 |
% |
|
|
0.68 |
% |
| |||||||||||||
|
Ratio of Net Investment Income to Average Net Assets |
|
3.13 |
% |
|
|
2.13 |
% |
|
|
|
2.02 |
% |
|
|
|
2.48 |
% |
|
|
2.10 |
% |
| |||||||||||||
|
Portfolio Turnover Rate |
|
24 |
% |
|
|
15 |
% |
|
|
|
14 |
% |
|
|
|
18 |
% |
|
|
23 |
% |
| |||||||||||||
|
| |||||||||||||||||||||||||||||||||||
|
# |
Computed using average shares outstanding. |
219
DFA Investment Dimensions Group Inc.
Financial
Highlights
(For a share
outstanding throughout each period)
|
|
|
|
|
|
|
|
|
|
| ||||||||||||||||||||||||||
|
International
Vector Equity Portfolio | |||||||||||||||||||||||||||||||||||
|
Year |
Year |
Year |
Year |
Year | |||||||||||||||||||||||||||||||
|
Net Asset Value, Beginning of Year |
|
$ |
|
14.51 |
|
$ |
|
10.42 |
|
|
$ |
|
11.62 |
|
|
$ |
|
11.74 |
|
$ |
|
13.33 |
|||||||||||||
|
| |||||||||||||||||||||||||||||||||||
|
Income From Investment Operations# |
|
|
|
|
|
|
|
|
|
| |||||||||||||||||||||||||
|
Net Investment Income (Loss) |
|
0.40 |
|
0.32 |
|
|
0.23 |
|
|
0.33 |
|
0.32 |
|||||||||||||||||||||||
|
Net Gains (Losses) on Securities (Realized and Unrealized) |
|
(3.52 |
) |
|
|
4.06 |
|
|
(1.20 |
) |
|
|
|
0.24 |
|
(1.56 |
) |
| |||||||||||||||||
|
| |||||||||||||||||||||||||||||||||||
|
Total From Investment Operations |
|
(3.12 |
) |
|
|
4.38 |
|
|
(0.97 |
) |
|
|
|
0.57 |
|
(1.24 |
) |
| |||||||||||||||||
|
| |||||||||||||||||||||||||||||||||||
|
Less Distributions |
|
|
|
|
|
|
|
|
|
| |||||||||||||||||||||||||
|
Net Investment Income |
|
(0.45 |
) |
|
|
(0.29 |
) |
|
|
|
(0.23 |
) |
|
|
|
(0.34 |
) |
|
|
(0.30 |
) |
| |||||||||||||
|
Net Realized Gains |
|
(0.27 |
) |
|
|
— |
|
|
— |
|
|
(0.35 |
) |
|
|
(0.05 |
) |
| |||||||||||||||||
|
| |||||||||||||||||||||||||||||||||||
|
Total Distributions |
|
(0.72 |
) |
|
|
(0.29 |
) |
|
|
|
(0.23 |
) |
|
|
|
(0.69 |
) |
|
|
(0.35 |
) |
| |||||||||||||
|
| |||||||||||||||||||||||||||||||||||
|
Net Asset Value, End of Year |
|
$ |
|
10.67 |
|
$ |
|
14.51 |
|
|
$ |
|
10.42 |
|
|
$ |
|
11.62 |
|
$ |
|
11.74 |
|||||||||||||
|
| |||||||||||||||||||||||||||||||||||
|
Total Return |
|
(22.16 |
)% |
|
|
42.24 |
% |
|
|
|
(8.41 |
)% |
|
|
|
5.49 |
% |
|
|
(9.52 |
)% |
| |||||||||||||
|
| |||||||||||||||||||||||||||||||||||
|
Net Assets, End of Year (thousands) |
|
$ |
|
2,882,931 |
|
$ |
|
3,716,790 |
|
|
$ |
|
2,722,859 |
|
|
$ |
|
2,578,134 |
|
$ |
|
2,441,217 |
|||||||||||||
|
Ratio of Expenses to Average Net Assets |
|
0.36 |
% |
|
|
0.42 |
% |
|
|
|
0.47 |
% |
|
|
|
0.50 |
% |
|
|
0.48 |
% |
| |||||||||||||
|
Ratio of Expenses to Average Net Assets (Excluding Fees Paid Indirectly) |
|
0.36 |
% |
|
|
0.42 |
% |
|
|
|
0.48 |
% |
|
|
|
0.50 |
% |
|
|
0.48 |
% |
| |||||||||||||
|
Ratio of Net Investment Income to Average Net Assets |
|
3.16 |
% |
|
|
2.35 |
% |
|
|
|
2.20 |
% |
|
|
|
2.94 |
% |
|
|
2.40 |
% |
| |||||||||||||
|
Portfolio Turnover Rate |
|
17 |
% |
|
|
15 |
% |
|
|
|
18 |
% |
|
|
|
17 |
% |
|
|
12 |
% |
| |||||||||||||
|
| |||||||||||||||||||||||||||||||||||
|
# |
Computed using average shares outstanding. |
220
DFA Investment Dimensions Group Inc.
Financial
Highlights
(For a share
outstanding throughout each period)
|
|
|
|
|
|
|
|
|
|
| ||||||||||||||||||||||||||
|
International
High Relative | |||||||||||||||||||||||||||||||||||
|
Year |
Year |
Year |
Year |
Year | |||||||||||||||||||||||||||||||
|
Net Asset Value, Beginning of Year |
|
$ |
|
13.73 |
|
$ |
|
10.64 |
|
|
$ |
|
10.74 |
|
|
$ |
|
9.71 |
|
$ |
|
10.68 |
|||||||||||||
|
| |||||||||||||||||||||||||||||||||||
|
Income From Investment Operations# |
|
|
|
|
|
|
|
|
|
| |||||||||||||||||||||||||
|
Net Investment Income (Loss) |
|
0.38 |
|
0.30 |
|
|
0.21 |
|
|
0.27 |
|
0.26 |
|||||||||||||||||||||||
|
Net Gains (Losses) on Securities (Realized and Unrealized) |
|
(3.51 |
) |
|
|
3.08 |
|
|
(0.13 |
) |
|
|
|
1.00 |
|
(1.01 |
) |
| |||||||||||||||||
|
| |||||||||||||||||||||||||||||||||||
|
Total From Investment Operations |
|
(3.13 |
) |
|
|
3.38 |
|
|
0.08 |
|
|
1.27 |
|
(0.75 |
) |
| |||||||||||||||||||
|
| |||||||||||||||||||||||||||||||||||
|
Less Distributions |
|
|
|
|
|
|
|
|
|
| |||||||||||||||||||||||||
|
Net Investment Income |
|
(0.37 |
) |
|
|
(0.29 |
) |
|
|
|
(0.18 |
) |
|
|
|
(0.24 |
) |
|
|
(0.22 |
) |
| |||||||||||||
|
Net Realized Gains |
|
(0.11 |
) |
|
|
— |
|
— |
|
— |
|
— |
|||||||||||||||||||||||
|
| |||||||||||||||||||||||||||||||||||
|
Total Distributions |
|
(0.48 |
) |
|
|
(0.29 |
) |
|
|
|
(0.18 |
) |
|
|
|
(0.24 |
) |
|
|
(0.22 |
) |
| |||||||||||||
|
| |||||||||||||||||||||||||||||||||||
|
Net Asset Value, End of Year |
|
$ |
|
10.12 |
|
$ |
|
13.73 |
|
|
$ |
|
10.64 |
|
|
$ |
|
10.74 |
|
$ |
|
9.71 |
|||||||||||||
|
| |||||||||||||||||||||||||||||||||||
|
Total Return |
|
(23.22 |
)% |
|
|
31.85 |
% |
|
|
|
0.80 |
% |
|
|
|
13.19 |
% |
|
|
(7.20 |
)% |
| |||||||||||||
|
| |||||||||||||||||||||||||||||||||||
|
Net Assets, End of Year (thousands) |
|
$ |
|
1,606,634 |
|
$ |
|
2,183,724 |
|
|
$ |
|
1,475,345 |
|
|
$ |
|
658,448 |
|
$ |
|
266,868 |
|||||||||||||
|
Ratio of Expenses to Average Net Assets |
|
0.30 |
% |
|
|
0.30 |
% |
|
|
|
0.30 |
% |
|
|
|
0.33 |
% |
|
|
0.35 |
% |
| |||||||||||||
|
Ratio of Expenses to Average Net Assets (Excluding Fees Waived, Expenses Reimbursed by Advisor and Fees Paid Indirectly) |
|
0.30 |
% |
|
|
0.30 |
% |
|
|
|
0.31 |
% |
|
|
|
0.34 |
% |
|
|
0.35 |
% |
| |||||||||||||
|
Ratio of Net Investment Income to Average Net Assets |
|
3.15 |
% |
|
|
2.30 |
% |
|
|
|
1.97 |
% |
|
|
|
2.69 |
% |
|
|
2.41 |
% |
| |||||||||||||
|
Portfolio Turnover Rate |
|
22 |
% |
|
|
15 |
% |
|
|
|
15 |
% |
|
|
|
9 |
% |
|
|
9 |
% |
| |||||||||||||
|
| |||||||||||||||||||||||||||||||||||
|
# |
Computed using average shares outstanding. | |||||||||||||||||||||||||||||||||||||||||||||||||||||||||||||||||||||||||||||||||||||||||||||||||
221
DFA Investment Dimensions Group Inc.
Financial
Highlights
(For a share
outstanding throughout each period)
|
|
|
|
|
|
|
|
|
|
| ||||||||||||||||||||||||||
|
World ex U.S. Value Portfolio | |||||||||||||||||||||||||||||||||||
|
Year |
Year |
Year |
Year |
Year | |||||||||||||||||||||||||||||||
|
Net Asset Value, Beginning of Year |
|
$ |
|
12.67 |
|
$ |
|
8.99 |
|
|
$ |
|
10.97 |
|
|
$ |
|
11.16 |
|
$ |
|
12.71 |
|||||||||||||
|
| |||||||||||||||||||||||||||||||||||
|
Income From Investment Operations# |
|
|
|
|
|
|
|
|
|
| |||||||||||||||||||||||||
|
Net Investment Income (Loss) |
|
0.47 |
|
0.38 |
|
|
0.25 |
|
|
0.35 |
|
0.34 |
|||||||||||||||||||||||
|
Net Gains (Losses) on Securities (Realized and Unrealized) |
|
(2.49 |
) |
|
|
3.66 |
|
|
(1.96 |
) |
|
|
|
0.04 |
|
(1.48 |
) |
| |||||||||||||||||
|
| |||||||||||||||||||||||||||||||||||
|
Total From Investment Operations |
|
(2.02 |
) |
|
|
4.04 |
|
|
(1.71 |
) |
|
|
|
0.39 |
|
(1.14 |
) |
| |||||||||||||||||
|
| |||||||||||||||||||||||||||||||||||
|
Less Distributions |
|
|
|
|
|
|
|
|
|
| |||||||||||||||||||||||||
|
Net Investment Income |
|
(0.51 |
) |
|
|
(0.36 |
) |
|
|
|
(0.27 |
) |
|
|
|
(0.35 |
) |
|
|
(0.41 |
) |
| |||||||||||||
|
Net Realized Gains |
— |
|
— |
|
|
— |
|
|
(0.23 |
) |
|
|
— |
||||||||||||||||||||||
|
| |||||||||||||||||||||||||||||||||||
|
Total Distributions |
|
(0.51 |
) |
|
|
(0.36 |
) |
|
|
|
(0.27 |
) |
|
|
|
(0.58 |
) |
|
|
(0.41 |
) |
| |||||||||||||
|
| |||||||||||||||||||||||||||||||||||
|
Net Asset Value, End of Year |
|
$ |
|
10.14 |
|
$ |
|
12.67 |
|
|
$ |
|
8.99 |
|
|
$ |
|
10.97 |
|
$ |
|
11.16 |
|||||||||||||
|
| |||||||||||||||||||||||||||||||||||
|
Total Return |
|
(16.23 |
)% |
|
|
45.23 |
% |
|
|
|
(15.76 |
)% |
|
|
|
3.75 |
% |
|
|
(9.22 |
)% |
| |||||||||||||
|
| |||||||||||||||||||||||||||||||||||
|
Net Assets, End of Year (thousands) |
|
$ |
|
194,259 |
|
$ |
|
308,666 |
|
|
$ |
|
206,915 |
|
|
$ |
|
302,369 |
|
$ |
|
240,668 |
|||||||||||||
|
Ratio of Expenses to Average Net Assets@,* |
|
0.40 |
% |
|
|
|
0.44 |
% |
|
|
0.50 |
% |
|
|
|
0.54 |
% |
|
|
0.52 |
% |
| |||||||||||||
|
Ratio of Expenses to Average Net Assets (Excluding Fees Waived, Expenses Reimbursed by Advisor and Fees Paid Indirectly)@,* |
|
0.59 |
% |
|
|
|
0.64 |
% |
|
|
0.71 |
% |
|
|
|
0.76 |
% |
|
|
0.74 |
% |
| |||||||||||||
|
Ratio of Net Investment Income to Average Net Assets |
|
4.02 |
% |
|
|
3.14 |
% |
|
|
|
2.56 |
% |
|
|
|
3.25 |
% |
|
|
2.72 |
% |
| |||||||||||||
|
| |||||||||||||||||||||||||||||||||||
|
@ The Ratio of Expenses to Average Net Assets is inclusive of acquired fund fees and expenses incurred by the Portfolio indirectly as a result of Portfolio’s investment in Underlying Funds as follows: |
|
0.19 |
% |
|
|
0.20 |
% |
|
|
|
0.23 |
% |
|
|
|
0.24 |
% |
|
|
0.24 |
% |
| |||||||||||||
|
| |||||||||||||||||||||||||||||||||||
|
# |
Computed using average shares outstanding. | ||
|
* |
Represents the combined ratios for the respective portfolio and its respective pro-rata share of its Master and Underlying Funds. |
222
DFA Investment Dimensions Group Inc.
Financial
Highlights
(For a share
outstanding throughout each period)
|
|
|
|
|
|
|
|
|
|
|
| |||||||||||||||||||||||||
|
World ex U.S. Core Equity Portfolio | |||||||||||||||||||||||||||||||||||
|
Year |
Year |
Year |
Year |
Year | |||||||||||||||||||||||||||||||
|
Net Asset Value, Beginning of Year |
|
$ |
|
13.84 |
|
$ |
|
10.44 |
|
|
$ |
|
11.17 |
|
|
$ |
|
10.65 |
|
$ |
|
12.15 |
|||||||||||||
|
| |||||||||||||||||||||||||||||||||||
|
Income From Investment Operations# |
|
|
|
|
|
|
|
|
|
| |||||||||||||||||||||||||
|
Net Investment Income (Loss) |
|
0.40 |
|
0.33 |
|
|
0.24 |
|
|
0.33 |
|
0.31 |
|||||||||||||||||||||||
|
Net Gains (Losses) on Securities (Realized and Unrealized) |
|
(3.48 |
) |
|
|
3.40 |
|
|
(0.74 |
) |
|
|
|
0.56 |
|
(1.52 |
) |
| |||||||||||||||||
|
| |||||||||||||||||||||||||||||||||||
|
Total From Investment Operations |
|
(3.08 |
) |
|
|
3.73 |
|
|
(0.50 |
) |
|
|
|
0.89 |
|
(1.21 |
) |
| |||||||||||||||||
|
| |||||||||||||||||||||||||||||||||||
|
Less Distributions |
|
|
|
|
|
|
|
|
|
| |||||||||||||||||||||||||
|
Net Investment Income |
|
(0.41 |
) |
|
|
(0.33 |
) |
|
|
|
(0.23 |
) |
|
|
|
(0.32 |
) |
|
|
(0.29 |
) |
| |||||||||||||
|
Net Realized Gains. |
— |
|
— |
|
|
— |
|
|
(0.05 |
) |
|
|
— |
||||||||||||||||||||||
|
| |||||||||||||||||||||||||||||||||||
|
Total Distributions |
|
(0.41 |
) |
|
|
(0.33 |
) |
|
|
|
(0.23 |
) |
|
|
|
(0.37 |
) |
|
|
(0.29 |
) |
| |||||||||||||
|
| |||||||||||||||||||||||||||||||||||
|
Net Asset Value, End of Year |
|
$ |
|
10.35 |
|
$ |
|
13.84 |
|
|
$ |
|
10.44 |
|
|
$ |
|
11.17 |
|
$ |
|
10.65 |
|||||||||||||
|
| |||||||||||||||||||||||||||||||||||
|
Total Return |
|
(22.55 |
)% |
|
|
35.87 |
% |
|
|
|
(4.42 |
)% |
|
|
|
8.64 |
% |
|
|
(10.22 |
)% |
| |||||||||||||
|
| |||||||||||||||||||||||||||||||||||
|
Net Assets, End of Year (thousands) |
|
$ |
|
3,122,060 |
|
$ |
|
4,089,166 |
|
|
$ |
|
3,210,237 |
|
|
$ |
|
3,719,313 |
|
$ |
|
3,129,791 |
|||||||||||||
|
Ratio of Expenses to Average Net Assets |
|
0.30 |
% |
|
|
0.32 |
% |
|
|
|
0.35 |
% |
|
|
|
0.37 |
% |
|
|
0.39 |
% |
| |||||||||||||
|
Ratio of Expenses to Average Net Assets (Excluding Fees Waived, Expenses Reimbursed by Advisor and Fees Paid Indirectly) |
|
0.30 |
% |
|
|
0.32 |
% |
|
|
|
0.36 |
% |
|
|
|
0.38 |
% |
|
|
0.37 |
% |
| |||||||||||||
|
Ratio of Net Investment Income to Average Net Assets |
|
3.25 |
% |
|
|
2.49 |
% |
|
|
|
2.26 |
% |
|
|
|
3.02 |
% |
|
|
2.56 |
% |
| |||||||||||||
|
Portfolio Turnover Rate |
|
12 |
% |
|
|
6 |
% |
|
|
|
13 |
% |
|
|
|
8 |
% |
|
|
4 |
% |
| |||||||||||||
|
| |||||||||||||||||||||||||||||||||||
|
# |
Computed using average shares outstanding. |
223
DFA Investment Dimensions Group Inc.
Financial
Highlights
(For a share
outstanding throughout each period)
|
|
|
|
|
|
|
|
|
|
| ||||||||||||||||||||||||||
|
World Core Equity Portfolio | |||||||||||||||||||||||||||||||||||
|
Year |
Year |
Year |
Year |
Year | |||||||||||||||||||||||||||||||
|
Net Asset Value, Beginning of Year |
|
$ |
|
22.56 |
|
$ |
|
16.29 |
|
|
$ |
|
16.42 |
|
|
$ |
|
15.40 |
|
$ |
|
16.06 |
|||||||||||||
|
| |||||||||||||||||||||||||||||||||||
|
Income From Investment Operations# |
|
|
|
|
|
|
|
|
|
| |||||||||||||||||||||||||
|
Net Investment Income (Loss) |
|
0.45 |
|
0.34 |
|
|
0.29 |
|
|
0.35 |
|
0.31 |
|||||||||||||||||||||||
|
Net Gains (Losses) on Securities (Realized and Unrealized) |
|
(4.15 |
) |
|
|
6.27 |
|
|
(0.10 |
) |
|
|
|
1.13 |
|
(0.64 |
) |
| |||||||||||||||||
|
| |||||||||||||||||||||||||||||||||||
|
Total From Investment Operations |
|
(3.70 |
) |
|
|
6.61 |
|
|
0.19 |
|
|
1.48 |
|
(0.33 |
) |
| |||||||||||||||||||
|
| |||||||||||||||||||||||||||||||||||
|
Less Distributions |
|
|
|
|
|
|
|
|
|
| |||||||||||||||||||||||||
|
Net Investment Income |
|
(0.45 |
) |
|
|
(0.34 |
) |
|
|
|
(0.29 |
) |
|
|
|
(0.35 |
) |
|
|
(0.30 |
) |
| |||||||||||||
|
Net Realized Gains |
|
(0.17 |
) |
|
|
— |
|
|
(0.03 |
) |
|
|
|
(0.11 |
) |
|
|
(0.03 |
) |
| |||||||||||||||
|
| |||||||||||||||||||||||||||||||||||
|
Total Distributions |
|
(0.62 |
) |
|
|
(0.34 |
) |
|
|
|
(0.32 |
) |
|
|
|
(0.46 |
) |
|
|
(0.33 |
) |
| |||||||||||||
|
| |||||||||||||||||||||||||||||||||||
|
Net Asset Value, End of Year |
|
$ |
|
18.24 |
|
$ |
|
22.56 |
|
|
$ |
|
16.29 |
|
|
$ |
|
16.42 |
|
$ |
|
15.40 |
|||||||||||||
|
| |||||||||||||||||||||||||||||||||||
|
Total Return |
|
(16.62 |
)% |
|
|
40.75 |
% |
|
|
|
1.25 |
% |
|
|
|
9.94 |
% |
|
|
(2.16 |
)% |
| |||||||||||||
|
| |||||||||||||||||||||||||||||||||||
|
Net Assets, End of Year (thousands) |
|
$ |
|
949,017 |
|
$ |
|
1,088,714 |
|
|
$ |
|
769,602 |
|
|
$ |
|
879,553 |
|
$ |
|
741,512 |
|||||||||||||
|
Ratio of Expenses to Average Net Assets*,@ |
|
0.27 |
% |
|
|
0.28 |
% |
|
|
|
0.32 |
% |
|
|
|
0.33 |
% |
|
|
0.35 |
% |
| |||||||||||||
|
Ratio of Expenses to Average Net Assets (Excluding Fees Waived, Expenses Reimbursed by Advisor)*,@ |
|
0.45 |
% |
|
|
0.46 |
% |
|
|
|
0.56 |
% |
|
|
|
0.60 |
% |
|
|
0.59 |
% |
| |||||||||||||
|
Ratio of Net Investment Income to Average Net Assets |
|
2.22 |
% |
|
|
1.64 |
% |
|
|
|
1.81 |
% |
|
|
|
2.23 |
% |
|
|
1.89 |
% |
| |||||||||||||
|
| |||||||||||||||||||||||||||||||||||
|
@ The Ratio of Expenses to Average Net Assets is inclusive of acquired fund fees and expenses incurred by the Portfolio indirectly as a result of Portfolio’s investment in Underlying Funds as follows: |
|
0.20 |
% |
|
|
0.22 |
% |
|
|
|
0.25 |
% |
|
|
|
0.27 |
% |
|
|
0.27 |
% |
| |||||||||||||
|
| |||||||||||||||||||||||||||||||||||
|
# |
Computed using average shares outstanding. | ||
|
* |
Represents the combined ratios for the respective portfolio and its respective pro-rata share of its Underlying Funds. |
224
DFA Investment Dimensions Group Inc.
Financial
Highlights
(For a share
outstanding throughout each period)
|
|
|
|
|
|
|
|
|
|
|
| |||||||||||||||||||||||||
|
Selectively Hedged Global Equity Portfolio | |||||||||||||||||||||||||||||||||||
|
Year |
Year |
Year |
Year |
Year | |||||||||||||||||||||||||||||||
|
Net Asset Value, Beginning of Year |
|
$ |
|
22.35 |
|
$ |
|
16.21 |
|
|
$ |
|
16.54 |
|
|
$ |
|
15.71 |
|
$ |
|
16.52 |
|||||||||||||
|
| |||||||||||||||||||||||||||||||||||
|
Income From Investment Operations# |
|
|
|
|
|
|
|
|
|
| |||||||||||||||||||||||||
|
Net Investment Income (Loss) |
|
0.44 |
|
0.33 |
|
|
0.28 |
|
|
0.35 |
|
0.31 |
|||||||||||||||||||||||
|
Net Gains (Losses) on Securities (Realized and Unrealized) |
|
(3.29 |
) |
|
|
6.21 |
|
|
(0.18 |
) |
|
|
|
1.12 |
|
(0.66 |
) |
| |||||||||||||||||
|
| |||||||||||||||||||||||||||||||||||
|
Total From Investment Operations |
|
(2.85 |
) |
|
|
6.54 |
|
|
0.10 |
|
|
1.47 |
|
(0.35 |
) |
| |||||||||||||||||||
|
| |||||||||||||||||||||||||||||||||||
|
Less Distributions |
|
|
|
|
|
|
|
|
|
| |||||||||||||||||||||||||
|
Net Investment Income |
|
(0.44 |
) |
|
|
(0.20 |
) |
|
|
|
(0.43 |
) |
|
|
|
(0.44 |
) |
|
|
(0.27 |
) |
| |||||||||||||
|
Net Realized Gains |
|
(0.97 |
) |
|
|
(0.20 |
) |
|
|
|
— |
|
|
(0.20 |
) |
|
|
(0.19 |
) |
| |||||||||||||||
|
| |||||||||||||||||||||||||||||||||||
|
Total Distributions |
|
(1.41 |
) |
|
|
(0.40 |
) |
|
|
|
(0.43 |
) |
|
|
|
(0.64 |
) |
|
|
(0.46 |
) |
| |||||||||||||
|
| |||||||||||||||||||||||||||||||||||
|
Net Asset Value, End of Year |
|
$ |
|
18.09 |
|
$ |
|
22.35 |
|
|
$ |
|
16.21 |
|
|
$ |
|
16.54 |
|
$ |
|
15.71 |
|||||||||||||
|
| |||||||||||||||||||||||||||||||||||
|
Total Return |
|
(13.65 |
)% |
|
|
40.81 |
% |
|
|
|
0.47 |
% |
|
|
|
10.10 |
% |
|
|
(2.28 |
)% |
| |||||||||||||
|
| |||||||||||||||||||||||||||||||||||
|
Net Assets, End of Year (thousands) |
|
$ |
|
270,708 |
|
$ |
|
348,707 |
|
|
$ |
|
288,509 |
|
|
$ |
|
375,832 |
|
$ |
|
403,195 |
|||||||||||||
|
Ratio of Expenses to Average Net Assets*,@ |
|
0.31 |
% |
|
|
0.32 |
% |
|
|
|
0.36 |
% |
|
|
|
0.37 |
% |
|
|
0.34 |
% |
| |||||||||||||
|
Ratio of Expenses to Average Net Assets (Excluding Fees Waived, Expenses Reimbursed by Advisor)*,@ |
|
0.51 |
% |
|
|
0.53 |
% |
|
|
|
0.61 |
% |
|
|
|
0.63 |
% |
|
|
0.60 |
% |
| |||||||||||||
|
Ratio of Net Investment Income to Average Net Assets |
|
2.25 |
% |
|
|
1.60 |
% |
|
|
|
1.78 |
% |
|
|
|
2.25 |
% |
|
|
1.87 |
% |
| |||||||||||||
|
| |||||||||||||||||||||||||||||||||||
|
@ The Ratio of Expenses to Average Net Assets is inclusive of acquired fund fees and expenses incurred by the Portfolio indirectly as a result of Portfolio’s investment in Underlying Funds as follows: |
|
0.24 |
% |
|
|
0.25 |
% |
|
|
|
0.28 |
% |
|
|
|
0.30 |
% |
|
|
0.29 |
% |
| |||||||||||||
|
| |||||||||||||||||||||||||||||||||||
|
# |
Computed using average shares outstanding. | ||
|
* |
Represents the combined ratios for the respective portfolio and its respective pro-rata share of its Underlying Funds. |
225
DFA Investment Dimensions Group Inc.
Financial
Highlights
(For a share
outstanding throughout each period)
|
|
|
|
|
|
|
|
|
|
|
| |||||||||||||||||||||||||
|
Emerging
Markets Portfolio | |||||||||||||||||||||||||||||||||||
|
Year |
Year |
Year |
Year |
Year | |||||||||||||||||||||||||||||||
|
Net Asset Value, Beginning of Year |
|
$ |
|
33.05 |
|
$ |
|
27.64 |
|
|
$ |
|
27.56 |
|
|
$ |
|
25.46 |
|
$ |
|
29.55 |
|||||||||||||
|
| |||||||||||||||||||||||||||||||||||
|
Income From Investment Operations# |
|
|
|
|
|
|
|
|
|
| |||||||||||||||||||||||||
|
Net Investment Income (Loss) |
|
0.88 |
|
0.74 |
|
|
0.55 |
|
|
0.73 |
|
0.61 |
|||||||||||||||||||||||
|
Net Gains (Losses) on Securities (Realized and Unrealized) |
|
(9.07 |
) |
|
|
5.32 |
|
|
0.07 |
|
|
2.05 |
|
(4.14 |
) |
| |||||||||||||||||||
|
| |||||||||||||||||||||||||||||||||||
|
Total From Investment Operations |
|
(8.19 |
) |
|
|
6.06 |
|
|
0.62 |
|
|
2.78 |
|
(3.53 |
) |
| |||||||||||||||||||
|
| |||||||||||||||||||||||||||||||||||
|
Less Distributions |
|
|
|
|
|
|
|
|
|
| |||||||||||||||||||||||||
|
Net Investment Income |
|
(0.91 |
) |
|
|
(0.65 |
) |
|
|
|
(0.54 |
) |
|
|
|
(0.68 |
) |
|
|
(0.56 |
) |
| |||||||||||||
|
Net Realized Gains |
|
(1.17 |
) |
|
|
— |
|
— |
|
— |
|
— |
|||||||||||||||||||||||
|
| |||||||||||||||||||||||||||||||||||
|
Total Distributions |
|
(2.08 |
) |
|
|
(0.65 |
) |
|
|
|
(0.54 |
) |
|
|
|
(0.68 |
) |
|
|
(0.56 |
) |
| |||||||||||||
|
| |||||||||||||||||||||||||||||||||||
|
Net Asset Value, End of Year |
|
$ |
|
22.78 |
|
$ |
|
33.05 |
|
|
$ |
|
27.64 |
|
|
$ |
|
27.56 |
|
$ |
|
25.46 |
|||||||||||||
|
| |||||||||||||||||||||||||||||||||||
|
Total Return |
|
(25.94 |
)% |
|
|
21.91 |
% |
|
|
|
2.36 |
% |
|
|
|
11.06 |
% |
|
|
(12.14 |
)% |
| |||||||||||||
|
| |||||||||||||||||||||||||||||||||||
|
Net Assets, End of Year (thousands) |
|
$ |
|
3,938,781 |
|
$ |
|
6,225,187 |
|
|
$ |
|
5,652,358 |
|
|
$ |
|
5,968,318 |
|
$ |
|
5,394,188 |
|||||||||||||
|
Ratio of Expenses to Average Net Assets* |
|
0.36 |
% |
|
|
0.39 |
% |
|
|
|
0.44 |
% |
|
|
|
0.48 |
% |
|
|
0.47 |
% |
| |||||||||||||
|
Ratio of Expenses to Average Net Assets (Excluding Fees Waived, Expenses Reimbursed by Advisor)* |
|
0.46 |
% |
|
|
0.49 |
% |
|
|
|
0.54 |
% |
|
|
|
0.58 |
% |
|
|
0.57 |
% |
| |||||||||||||
|
Ratio of Net Investment Income to Average Net Assets |
|
3.05 |
% |
|
|
2.19 |
% |
|
|
|
2.07 |
% |
|
|
|
2.70 |
% |
|
|
2.08 |
% |
| |||||||||||||
|
| |||||||||||||||||||||||||||||||||||
|
# |
Computed using average shares outstanding. | ||
|
* |
Represents the combined ratios for the respective portfolio and its respective pro-rata share of its Master Fund. |
226
DFA Investment Dimensions Group Inc.
Financial
Highlights
(For a share
outstanding throughout each period)
|
|
|
|
|
|
|
|
|
|
|
| |||||||||||||||||||||||||
|
Emerging
Markets Value Portfolio | |||||||||||||||||||||||||||||||||||
|
Year |
Year |
Year |
Year |
Year | |||||||||||||||||||||||||||||||
|
Net Asset Value, Beginning of Year |
|
$ |
|
31.48 |
|
$ |
|
23.93 |
|
|
$ |
|
27.34 |
|
|
$ |
|
26.81 |
|
$ |
|
30.32 |
|||||||||||||
|
| |||||||||||||||||||||||||||||||||||
|
Income From Investment Operations# |
|
|
|
|
|
|
|
|
|
| |||||||||||||||||||||||||
|
Net Investment Income (Loss) |
|
1.32 |
|
0.90 |
|
|
0.71 |
|
|
0.70 |
|
0.73 |
|||||||||||||||||||||||
|
Net Gains (Losses) on Securities (Realized and Unrealized) |
|
(7.34 |
) |
|
|
7.50 |
|
|
(3.35 |
) |
|
|
|
0.57 |
|
(3.53 |
) |
| |||||||||||||||||
|
| |||||||||||||||||||||||||||||||||||
|
Total From Investment Operations |
|
(6.02 |
) |
|
|
8.40 |
|
|
(2.64 |
) |
|
|
|
1.27 |
|
(2.80 |
) |
| |||||||||||||||||
|
| |||||||||||||||||||||||||||||||||||
|
Less Distributions |
|
|
|
|
|
|
|
|
|
| |||||||||||||||||||||||||
|
Net Investment Income |
|
(1.39 |
) |
|
|
(0.85 |
) |
|
|
|
(0.77 |
) |
|
|
|
(0.74 |
) |
|
|
(0.71 |
) |
| |||||||||||||
|
| |||||||||||||||||||||||||||||||||||
|
Total Distributions |
|
(1.39 |
) |
|
|
(0.85 |
) |
|
|
|
(0.77 |
) |
|
|
|
(0.74 |
) |
|
|
(0.71 |
) |
| |||||||||||||
|
| |||||||||||||||||||||||||||||||||||
|
Net Asset Value, End of Year |
|
$ |
|
24.08 |
|
$ |
|
31.48 |
|
|
$ |
|
23.93 |
|
|
$ |
|
27.34 |
|
$ |
|
26.81 |
|||||||||||||
|
| |||||||||||||||||||||||||||||||||||
|
Total Return |
|
(19.51 |
)% |
|
|
35.24 |
% |
|
|
|
(9.75 |
)% |
|
|
|
4.83 |
% |
|
|
(9.45 |
)% |
| |||||||||||||
|
| |||||||||||||||||||||||||||||||||||
|
Net Assets, End of Year (thousands) |
|
$ |
|
9,600,125 |
|
$ |
|
13,258,001 |
|
|
$ |
|
12,596,902 |
|
|
$ |
|
17,161,936 |
|
$ |
|
16,431,410 |
|||||||||||||
|
Ratio of Expenses to Average Net Assets* |
|
0.45 |
% |
|
|
0.49 |
% |
|
|
|
0.52 |
% |
|
|
|
0.56 |
% |
|
|
0.54 |
% |
| |||||||||||||
|
Ratio of Expenses to Average Net Assets (Excluding Fees Waived, Expenses Reimbursed by Advisor)* |
|
0.55 |
% |
|
|
0.59 |
% |
|
|
|
0.62 |
% |
|
|
|
0.66 |
% |
|
|
0.64 |
% |
| |||||||||||||
|
Ratio of Net Investment Income to Average Net Assets |
|
4.49 |
% |
|
|
2.92 |
% |
|
|
|
2.87 |
% |
|
|
|
2.54 |
% |
|
|
2.37 |
% |
| |||||||||||||
|
| |||||||||||||||||||||||||||||||||||
|
# |
Computed using average shares outstanding. | ||
|
* |
Represents the combined ratios for the respective portfolio and its respective pro-rata share of its Master Fund. |
227
DFA Investment Dimensions Group Inc.
Financial
Highlights
(For a share
outstanding throughout each period)
|
|
|
|
|
|
|
|
|
|||||||||||||||||||||
|
Emerging Markets Targeted Value Portfolio | ||||||||||||||||||||||||||||
|
Year |
Year |
Year |
Period | |||||||||||||||||||||||||
|
Net Asset Value, Beginning of Year |
|
$ |
|
13.13 |
|
$ |
|
9.71 |
|
|
$ |
|
10.43 |
|
|
$ |
|
10.00 |
||||||||||
|
| ||||||||||||||||||||||||||||
|
Income From Investment Operations# |
|
|
|
|
|
|
|
| ||||||||||||||||||||
|
Net Investment Income (Loss) |
|
0.30 |
|
0.28 |
|
|
0.21 |
|
|
0.24 |
||||||||||||||||||
|
Net Gains (Losses) on Securities (Realized and Unrealized) |
|
(2.85 |
) |
|
|
3.39 |
|
|
(0.59 |
) |
|
|
|
0.20 |
||||||||||||||
|
| ||||||||||||||||||||||||||||
|
Total from Investment Operations |
|
(2.55 |
) |
|
|
3.67 |
|
|
(0.38 |
) |
|
|
|
0.44 |
||||||||||||||
|
| ||||||||||||||||||||||||||||
|
Less Distributions: |
|
|
|
|
|
|
|
| ||||||||||||||||||||
|
Net Investment Income |
|
(0.42 |
) |
|
|
(0.23 |
) |
|
|
|
(0.23 |
) |
|
|
|
(0.01 |
) |
| ||||||||||
|
Net Realized Gains |
|
(0.87 |
) |
|
|
(0.02 |
) |
|
|
|
(0.11 |
) |
|
|
|
— |
||||||||||||
|
| ||||||||||||||||||||||||||||
|
Total Distributions |
|
(1.29 |
) |
|
|
(0.25 |
) |
|
|
|
(0.34 |
) |
|
|
|
(0.01 |
) |
| ||||||||||
|
| ||||||||||||||||||||||||||||
|
Net Asset Value, End of Year |
|
$ |
|
9.29 |
|
$ |
|
13.13 |
|
|
$ |
|
9.71 |
|
|
$ |
|
10.43 |
||||||||||
|
| ||||||||||||||||||||||||||||
|
Total Return |
|
(21.40 |
)% |
|
|
38.29 |
% |
|
|
|
(3.89 |
)% |
|
|
|
4.38 |
%† |
| ||||||||||
|
| ||||||||||||||||||||||||||||
|
Net Assets, End of Year (thousands) |
|
$ |
|
189,926 |
|
$ |
|
234,921 |
|
|
$ |
|
170,163 |
|
|
$ |
|
114,360 |
||||||||||
|
Ratio of Expenses to Average Net Assets |
|
0.66 |
% |
|
|
0.72 |
% |
|
|
|
0.84 |
% |
|
|
|
0.85 |
%@^ |
| ||||||||||
|
Ratio of Expenses to Average Net Assets (Excluding Fees Waived, Expenses Reimbursed by Advisor and Fees Paid Indirectly) |
|
0.66 |
% |
|
|
0.72 |
% |
|
|
|
0.87 |
% |
|
|
|
0.95 |
%@^ |
| ||||||||||
|
Ratio of Net Investment Income to Average Net Assets |
|
2.72 |
% |
|
|
2.19 |
% |
|
|
|
2.26 |
% |
|
|
|
2.30 |
%@^ |
| ||||||||||
|
Portfolio Turnover Rate |
|
28 |
% |
|
|
29 |
% |
|
|
|
34 |
% |
|
|
|
12 |
%† |
| ||||||||||
|
| ||||||||||||||||||||||||||||
|
# |
Computed using average shares outstanding. | ||
|
^ |
Annualized. | ||
|
† |
Non-Annualized. | ||
|
* |
Commencement of operations. | ||
|
@ |
Because of commencement of operations and related preliminary transaction costs, these ratios are not necessarily indicative of future ratios. |
228
DFA Investment Dimensions Group Inc.
Financial
Highlights
(For a share
outstanding throughout each period)
|
|
|
|
|
|
|
|
|
|
|
| |||||||||||||||||||||||||
|
Emerging
Markets Small Cap Portfolio | |||||||||||||||||||||||||||||||||||
|
Year |
Year |
Year |
Year |
Year | |||||||||||||||||||||||||||||||
|
Net Asset Value, Beginning of Year |
|
$ |
|
26.03 |
|
$ |
|
19.67 |
|
|
$ |
|
20.07 |
|
|
$ |
|
18.72 |
|
$ |
|
23.49 |
|||||||||||||
|
| |||||||||||||||||||||||||||||||||||
|
Income From Investment Operations# |
|
|
|
|
|
|
|
|
|
| |||||||||||||||||||||||||
|
Net Investment Income (Loss) |
|
0.59 |
|
0.52 |
|
|
0.41 |
|
|
0.48 |
|
0.53 |
|||||||||||||||||||||||
|
Net Gains (Losses) on Securities (Realized and Unrealized) |
|
(6.16 |
) |
|
|
6.41 |
|
|
(0.24 |
) |
|
|
|
1.87 |
|
(4.22 |
) |
| |||||||||||||||||
|
| |||||||||||||||||||||||||||||||||||
|
Total From Investment Operations |
|
(5.57 |
) |
|
|
6.93 |
|
|
0.17 |
|
|
2.35 |
|
(3.69 |
) |
| |||||||||||||||||||
|
| |||||||||||||||||||||||||||||||||||
|
Less Distributions |
|
|
|
|
|
|
|
|
|
| |||||||||||||||||||||||||
|
Net Investment Income |
|
(1.00 |
) |
|
|
(0.57 |
) |
|
|
|
(0.44 |
) |
|
|
|
(0.46 |
) |
|
|
(0.53 |
) |
| |||||||||||||
|
Net Realized Gains |
|
(0.70 |
) |
|
|
— |
|
|
(0.13 |
) |
|
|
|
(0.54 |
) |
|
|
(0.55 |
) |
| |||||||||||||||
|
| |||||||||||||||||||||||||||||||||||
|
Total Distributions |
|
(1.70 |
) |
|
|
(0.57 |
) |
|
|
|
(0.57 |
) |
|
|
|
(1.00 |
) |
|
|
(1.08 |
) |
| |||||||||||||
|
| |||||||||||||||||||||||||||||||||||
|
Net Asset Value, End of Year |
|
$ |
|
18.76 |
|
$ |
|
26.03 |
|
|
$ |
|
19.67 |
|
|
$ |
|
20.07 |
|
$ |
|
18.72 |
|||||||||||||
|
| |||||||||||||||||||||||||||||||||||
|
Total Return |
|
(22.57 |
)% |
|
|
35.51 |
% |
|
|
|
0.81 |
% |
|
|
|
12.96 |
% |
|
|
(16.45 |
)% |
| |||||||||||||
|
| |||||||||||||||||||||||||||||||||||
|
Net Assets, End of Year (thousands) |
|
$ |
|
3,511,909 |
|
$ |
|
5,115,924 |
|
|
$ |
|
4,879,733 |
|
|
$ |
|
6,423,859 |
|
$ |
|
6,304,406 |
|||||||||||||
|
Ratio of Expenses to Average Net Assets* |
|
0.59 |
% |
|
|
0.63 |
% |
|
|
|
0.69 |
% |
|
|
|
0.72 |
% |
|
|
0.70 |
% |
| |||||||||||||
|
Ratio of Expenses to Average Net Assets (Excluding Fees Waived, Expenses Reimbursed by Advisor)* |
|
0.79 |
% |
|
|
0.83 |
% |
|
|
|
0.89 |
% |
|
|
|
0.92 |
% |
|
|
0.90 |
% |
| |||||||||||||
|
Ratio of Net Investment Income to Average Net Assets |
|
2.57 |
% |
|
|
2.10 |
% |
|
|
|
2.20 |
% |
|
|
|
2.44 |
% |
|
|
2.31 |
% |
| |||||||||||||
|
| |||||||||||||||||||||||||||||||||||
|
# |
Computed using average shares outstanding. | ||
|
* |
Represents the combined ratios for the respective portfolio and its respective pro-rata share of its Master Fund. |
229
DFA Investment Dimensions Group Inc.
Financial
Highlights
(For a share
outstanding throughout each period)
|
|
|
|
|
|
|
|
|
|
|
| |||||||||||||||||||||||||
|
Emerging
Markets Core Equity Portfolio | |||||||||||||||||||||||||||||||||||
|
Year |
Year |
Year |
Year |
Year | |||||||||||||||||||||||||||||||
|
Net Asset Value, Beginning of Year |
|
$ |
|
25.16 |
|
$ |
|
20.34 |
|
|
$ |
|
20.59 |
|
|
$ |
|
18.95 |
|
$ |
|
22.38 |
|||||||||||||
|
| |||||||||||||||||||||||||||||||||||
|
Income From Investment Operations# |
|
|
|
|
|
|
|
|
|
| |||||||||||||||||||||||||
|
Net Investment Income (Loss) |
|
0.75 |
|
0.57 |
|
|
0.43 |
|
|
0.53 |
|
0.50 |
|||||||||||||||||||||||
|
Net Gains (Losses) on Securities (Realized and Unrealized) |
|
(6.97 |
) |
|
|
4.76 |
|
|
(0.22 |
) |
|
|
|
1.64 |
|
(3.47 |
) |
| |||||||||||||||||
|
| |||||||||||||||||||||||||||||||||||
|
Total From Investment Operations |
|
(6.22 |
) |
|
|
5.33 |
|
|
0.21 |
|
|
2.17 |
|
(2.97 |
) |
| |||||||||||||||||||
|
| |||||||||||||||||||||||||||||||||||
|
Less Distributions |
|
|
|
|
|
|
|
|
|
| |||||||||||||||||||||||||
|
Net Investment Income |
|
(0.81 |
) |
|
|
(0.51 |
) |
|
|
|
(0.46 |
) |
|
|
|
(0.53 |
) |
|
|
(0.46 |
) |
| |||||||||||||
|
| |||||||||||||||||||||||||||||||||||
|
Total Distributions |
|
(0.81 |
) |
|
|
(0.51 |
) |
|
|
|
(0.46 |
) |
|
|
|
(0.53 |
) |
|
|
(0.46 |
) |
| |||||||||||||
|
| |||||||||||||||||||||||||||||||||||
|
Net Asset Value, End of Year |
|
$ |
|
18.13 |
|
$ |
|
25.16 |
|
|
$ |
|
20.34 |
|
|
$ |
|
20.59 |
|
$ |
|
18.95 |
|||||||||||||
|
| |||||||||||||||||||||||||||||||||||
|
Total Return |
|
(25.06 |
)% |
|
|
26.19 |
% |
|
|
|
1.13 |
% |
|
|
|
11.61 |
% |
|
|
(13.48 |
)% |
| |||||||||||||
|
| |||||||||||||||||||||||||||||||||||
|
Net Assets, End of Year (thousands) |
|
$ |
|
20,968,575 |
|
$ |
|
29,155,369 |
|
|
$ |
|
24,780,700 |
|
|
$ |
|
28,622,610 |
|
$ |
|
25,372,759 |
|||||||||||||
|
Ratio of Expenses to Average Net Assets |
|
0.40 |
% |
|
|
0.42 |
% |
|
|
|
0.49 |
% |
|
|
|
0.52 |
% |
|
|
0.52 |
% |
| |||||||||||||
|
Ratio of Expenses to Average Net Assets (Excluding Fees Waived, Expenses Reimbursed by Advisor and Fees Paid Indirectly) |
|
0.40 |
% |
|
|
0.42 |
% |
|
|
|
0.50 |
% |
|
|
|
0.53 |
% |
|
|
0.52 |
% |
| |||||||||||||
|
Ratio of Net Investment Income to Average Net Assets |
|
3.33 |
% |
|
|
2.26 |
% |
|
|
|
2.19 |
% |
|
|
|
2.62 |
% |
|
|
2.25 |
% |
| |||||||||||||
|
Portfolio Turnover Rate |
|
14 |
% |
|
|
10 |
% |
|
|
|
15 |
% |
|
|
|
4 |
% |
|
|
4 |
% |
| |||||||||||||
|
| |||||||||||||||||||||||||||||||||||
|
# |
Computed using average shares outstanding. |
230
DFA Investment Dimensions Group Inc.
Financial
Highlights
(For a share
outstanding throughout each period)
|
|
|
|
| ||||||
|
Emerging
Markets | |||||||||
|
Period |
| ||||||||
|
Net Asset Value, Beginning of Period |
|
$ |
|
10.00 |
| ||||
|
| |||||||||
|
Income From Investment Operations# |
|
|
| ||||||
|
Net Investment Income (Loss) |
|
0.28 |
| ||||||
|
Net Gains (Losses) on Securities (Realized and Unrealized) |
|
(2.28 |
) |
|
| ||||
|
| |||||||||
|
Total From Investment Operations |
|
(2.00 |
) |
|
| ||||
|
| |||||||||
|
Less Distributions |
|
|
| ||||||
|
Net Investment Income |
|
(0.24 |
) |
|
| ||||
|
| |||||||||
|
Total Distributions |
|
(0.24 |
) |
|
| ||||
|
| |||||||||
|
Net Asset Value, End of Period |
|
$ |
|
7.76 |
| ||||
|
| |||||||||
|
Total Return |
|
(20.16 |
%)† |
|
| ||||
|
| |||||||||
|
Net Assets, End of Period (thousands) |
|
$ |
|
424,447 |
| ||||
|
Ratio of Expenses to Average Net Assets |
|
0.43 |
%^@ |
|
| ||||
|
Ratio of Expenses to Average Net Assets (Excluding Fees Waived, Expenses Reimbursed by Advisor and Fees Paid Indirectly) |
|
0.54 |
%^@ |
|
| ||||
|
Ratio of Net Investment Income to Average Net Assets |
|
3.20 |
%^@ |
|
| ||||
|
Portfolio Turnover Rate |
|
41 |
%† |
|
| ||||
|
| |||||||||
|
# |
Computed using average shares outstanding. | |||||||||||||||||||||||||||||||||||||||||||||||||||||||||||||||||||||||||||||||||||||||||||||||||
|
^ |
Annualized. | |||||||||||||||||||||||||||||||||||||||||||||||||||||||||||||||||||||||||||||||||||||||||||||||||
|
† |
Non-Annualized. | |||||||||||||||||||||||||||||||||||||||||||||||||||||||||||||||||||||||||||||||||||||||||||||||||
|
* |
Commencement of operations. | |||||||||||||||||||||||||||||||||||||||||||||||||||||||||||||||||||||||||||||||||||||||||||||||||
|
@ |
Because of commencement of operations and related preliminary transaction costs, these ratios are not necessarily indicative of future ratios. | |||||||||||||||||||||||||||||||||||||||||||||||||||||||||||||||||||||||||||||||||||||||||||||||||
231
Other Available Information
You can find more information about the Funds and their Portfolios in the Funds’ SAI and Annual and Semi-Annual Reports.
Statement of Additional Information
The SAI, incorporated herein by reference, supplements, and is technically part of, this Prospectus. It includes an expanded discussion of investment practices, risks, and fund operations.
Annual and Semi-Annual Reports to Shareholders
These reports focus on Portfolio holdings and performance.
The Annual Report also discusses the market conditions and investment strategies that significantly affected the Portfolios in their last fiscal year.
How to get these and other materials:
|
• |
Your investment advisor—you are a client of an investment advisor who has invested in the Portfolios on your behalf. | ||
|
• |
The Fund—you represent an institutional investor, registered investment advisor or other qualifying investor. Call collect at (512) 306-7400. | ||
|
• |
Access them on our Web site at http://us.dimensional.com. | ||
|
• |
Access them on the EDGAR Database on the SEC’s Internet site at http://www.sec.gov. | ||
|
• |
Obtain them, after paying a duplicating fee, by electronic request at the following e-mail address: [email protected]. |
Dimensional Investment
Group Inc. (DFA International Value Portfolio)—Registration No. 811-6067
DFA
Investment Dimensions Group Inc. (all other Portfolios)—Registration No.
811-3258
|
|
|
|
|
Dimensional Fund
Advisors LP |
|