Goldman Sachs Funds Semi-Annual Report February 29, 2024 Goldman Sachs ActiveBeta® ETFs ActiveBeta® Emerging Markets Equity ETF (GEM) ActiveBeta® Europe Equity ETF (GSEU) ActiveBeta® International Equity ETF (GSIE) ActiveBeta® Japan Equity ETF (GSJY) ActiveBeta® U.S. Large Cap Equity ETF (GSLC) ActiveBeta® U.S. Small Cap Equity ETF (GSSC) ActiveBeta® World Low Vol Plus Equity ETF (GLOV) ActiveBeta® is a registered trademark of GSAM.
Goldman Sachs ActiveBeta® Equity ETFs
| ∎ |
ACTIVEBETA® EMERGING MARKETS EQUITY ETF (GEM) | |
| ∎ |
ACTIVEBETA® EUROPE EQUITY ETF (GSEU) | |
| ∎ |
ACTIVEBETA® INTERNATIONAL EQUITY ETF (GSIE) | |
| ∎ |
ACTIVEBETA® JAPAN EQUITY ETF (GSJY) | |
| ∎ |
ACTIVEBETA® U.S. LARGE CAP EQUITY ETF (GSLC) | |
| ∎ |
ACTIVEBETA® U.S. SMALL CAP EQUITY ETF (GSSC) | |
| ∎ |
ACTIVEBETA® WORLD LOW VOL PLUS EQUITY ETF (GLOV) |
| 1 | ||||
| 6 | ||||
| 28 | ||||
| 94 | ||||
| 102 | ||||
| 102 | ||||
| 103 | ||||
| 104 | ||||
| 105 | ||||
| 106 | ||||
| 107 | ||||
| 108 | ||||
| 109 | ||||
| 137 | ||||
Effective January 24, 2023, open-end mutual funds and exchange traded funds will be required to provide shareholders with streamlined annual and semi-annual shareholder reports (“Tailored Shareholder Reports”). Funds will be required to prepare a separate Tailored Shareholder Report for each share class of a fund that highlights key information to investors. Other information, including financial statements, will no longer appear in a fund’s shareholder report, but will be available online, delivered free of charge upon request, and filed with the Securities and Exchange Commission on a semi-annual basis on Form N-CSR. The new requirements have a compliance date of July 24, 2024.
| NOT FDIC-INSURED | May Lose Value | No Bank Guarantee | ||||
MARKET REVIEW
Goldman Sachs ActiveBeta® Equity ETFs
February 29, 2024
The following are highlights both of key factors affecting U.S., international and emerging markets equity markets and of any key changes made to the Goldman Sachs ActiveBeta® Equity ETFs (the “Funds”) during the six months ended February 29, 2024 (the “Reporting Period”). A streamlined annual shareholder report covering the 12 months ended August 31, 2024 will be provided to the Funds’ shareholders, per new Securities and Exchange Commission requirements with a compliance date of July 24, 2024.
U.S. Equities
| • | Overall, U.S. equities rose during the Reporting Period. The Standard & Poor’s 500® Index (the “S&P 500 Index”) ended the Reporting Period with a return of 13.93%. The Russell 3000® Index generated a return of 13.76%. |
| • | Despite ongoing geopolitical tensions and persistent volatility, the market posted solid returns during the Reporting Period amid a backdrop of shifting consensus expectations around the Federal Reserve’s (“Fed”) policy path forward and generally broadening market leadership. |
| • | The Reporting Period began in September 2023 with a sharp pullback. |
| • | Although economic activity remained resilient, the S&P 500 Index declined mostly due to a pickup in soft landing concerns, surging energy prices and disinflationary pressures on corporate earnings. (A soft landing, in economics, is a cyclical downturn that avoids recession. It typically describes attempts by central banks to raise interest rates just enough to stop an economy from overheating and experiencing high inflation, without causing a significant increase in unemployment, or a hard landing.) |
| • | Concerns about a looming threat of a federal government shutdown, consumer impacts from student loan repayments resuming, and a strike against automakers by the United Auto Workers union that began in September further weighed on investor sentiment. |
| • | The Fed acted in line with consensus forecasts, keeping interest rates unchanged at 5.25%-5.50% in September. However, the Fed’s “higher for longer” narrative appeared to gain further recognition from investors. |
| • | During the fourth quarter of 2023, the S&P 500 Index enjoyed a double-digit gain, finishing the calendar year with the best fourth quarter since 2003. |
| • | The quarter saw a broadening of market leadership following the mega-cap dominance for most of 2023. |
| • | U.S. equity markets began the quarter with negative momentum, as investors digested a more resilient than consensus expected U.S. economy and a “higher for longer” Fed interest rate regime. |
| • | The market then shifted direction in November. |
| • | November saw the most significant easing in financial conditions of any month in more than four decades. |
| • | Market sentiment took a positive turn on the back of an overall shift in tonality from Fed officials signaling potential easing of monetary policy in 2024, a gradual cooldown in economic activity while the labor market remained resilient, and a rally across U.S. Treasuries marking one of the best monthly performances on record—all underpinning soft landing and disinflation traction themes. |
| • | The Fed held interest rates unchanged throughout the quarter, as growth of the U.S. economy slowed, the unemployment rate remained low despite abating job gains, and inflationary pressures continued to trend downwards. |
| • | Near the end of the quarter, there was a major shift in the Fed’s policy path expectations, with the Summary of Economic Projections median dot plot signaling 75 basis points of rate cuts in 2024. (A basis point is 1/100th of a percentage point. The Fed’s dot plot shows the interest rate projections of the members of the Federal Open Market Committee.) |
| • | U.S. economic data provided further evidence of disinflation momentum, with November’s annualized core Consumer Price Index dropping to its lowest level since September 2021 and core Personal Consumption Expenditure Index increasing 1.9% on a six-month annualized basis, measuring below the Fed’s inflation target of 2% for the first time in more than three years. |
| 1 |
MARKET REVIEW
| • | Market seasonality proved to be another tailwind to equities during the quarter, as November and December historically represent the strongest two-month period for U.S. stocks. |
| • | The S&P 500 Index rose in January 2024, albeit modestly. |
| • | Following an especially strong end to 2023, U.S. equity markets began the new calendar year with a more cautionary tone, driven by concerns regarding overvalued conditions and the Fed’s ability to match interest rate cut expectations from investors. |
| • | Yields across the U.S. Treasury curve, or spectrum of maturities, steepened, a headwind to equity valuations as traders repriced expectations regarding the path of monetary policy. |
| • | The trend of broadened market leadership witnessed in the last months of 2023 reversed course in January, with mega-cap stocks outperforming again. |
| • | Despite this defensive start, U.S. equities finished the month mostly higher, with the S&P 500 Index recording new record highs as economic releases and robust labor market data continued to underpin the prevailing soft landing narrative. |
| • | In February 2024, the S&P 500 Index notched a new all-time high, rallying for the fourth consecutive month as market leadership broadened from the “Magnificent Seven,” the group of high-performing and influential companies that drove U.S. equity performance for much of 2023.” |
| • | U.S. Treasury yields were notably higher on the back of resilient macroeconomic data and hawkish sentiment following the Fed’s January meeting, wherein Fed Chair Powell communicated it was not likely the Fed would cut interest rates in March 2024. (Hawkish suggests higher interest rates; opposite of dovish.) |
| • | The major headline of the month was the shift in market expectations for the timing of the first interest rate cut, which moved from March to June 2024 even as the broader disinflation theme remained intact. |
| • | Economic data remained robust, which helped ease concerns of a hard landing. |
| • | Concerns of a temporary U.S. government shutdown were subdued at the end of the month, as policymakers reached a timely temporary funding bill to keep government operations open through March 2024. |
| • | Corporate earnings were better than consensus feared, underpinned by both sales and earnings exceeding market forecasts on improved profit margins across most sectors. |
| • | During the Reporting Period overall, all capitalization segments within the U.S. equity market posted gains, with large-cap stocks, as measured by the Russell 1000® Index, performing best, followed by mid-cap stocks and then small-cap stocks, as measured by the Russell Midcap® Index and Russell 2000® Index, respectively. From a style perspective, growth-oriented stocks materially outperformed value-oriented stocks across the capitalization spectrum. (All as measured by the FTSE Russell indices.) |
| • | The best performing sectors within the S&P 500 Index during the Reporting Period were information technology, communication services and financials, while the weakest performing sectors were energy, utilities and consumer staples. |
International Equities
| • | Representing the developed international equity markets, the MSCI EAFE Index (net) returned 9.23% for the Reporting Period, lagging the U.S. equity market. |
| • | As the Reporting Period began in September 2023, international equity markets, like their U.S. counterpart, declined, marked by persistent inflation, contractionary economic concerns, particularly in Europe, and further interest rate hikes. Recession fears were renewed by a steep rise in oil prices. Further, a selloff in global bond markets put increased pressure on risk assets. |
| • | In Europe, concerns persisted around the contractionary effect of elevated interest rates on the economy as the European Central Bank (“ECB”) raised interest rates for the second time in the third calendar quarter. However, inflation in Europe fell to a two-year low, and the ECB suggested its September hike may be the last. |
| 2 |
MARKET REVIEW
| • | The U.K. equity market fared better than continental Europe, largely supported by its energy sector, which benefited from increased oil prices. The market also benefited from sterling, its currency, depreciation relative to the U.S. dollar. Additionally, U.K. markets showed signs of improving consumer confidence. The Bank of England (“BoE”) ended its run of 14 consecutive interest rate hikes in September. |
| • | The Japanese equity market fell in September, as concerns arose surrounding political tensions with China, which could impact tourism. |
| • | International equities rallied strongly in the fourth quarter of 2023, fueled by consensus expectations of interest rate cuts in 2024 amid falling inflation numbers and a fizzling out of the “higher for longer” narrative. |
| • | In Europe, equities were weak in October but then recovered to close out the year. Headline inflation in December ticked up from November; however, core inflation fell. |
| • | U.K. equities posted positive returns overall but lagged other geographies due to sterling appreciation and a large exposure to the underperforming energy sector. Although U.K. economic growth entered negative territory during the quarter, markets were buoyed by expectations of an ending rate hike cycle. As a result, domestic small-cap and mid-cap stocks performed especially well. |
| • | The Japanese equity market similarly posted positive, albeit modest, returns for the quarter. Yen appreciation was a headwind for Japanese equities. However, expectations of rate cuts and dovish U.S. Fed moves were positive news for Japanese equities. The December 2023 Bank of Japan Tankan survey signaled toward improving business sentiment. However, the Bank of Japan’s December meeting, though not featuring any policy or rate changes, slightly dampened consensus expectations of an imminent end to its negative policy rates. |
| • | The MSCI EAFE Index posted positive, though quite modest, returns in January 2024. While developed markets advanced on positive macroeconomic indicators, central banks tempered investor expectations of interest rate cuts in the first quarter of 2024. |
| • | European equities gained. The ECB kept its rates steady at its January meeting, recognizing a medium-term trend in declining inflation despite the uptick in the prior month. The ECB seemed to have little aversion towards maintaining elevated rates for as long as necessary, reiterating its commitment to a data-driven approach over the next few months. |
| • | U.K. equities posted a negative return overall in January. Signs of economic growth as well as a higher than anticipated December 2023 inflation reading pushed out consensus expectations of rate cuts from the BoE. |
| • | Despite beginning the calendar year with an earthquake and an accident at Tokyo Haneda airport, Japan was the best performing major region in January amidst foreign inflows, as investors rotated out of an underperforming Chinese equity market. Japanese equity markets were propelled by investor optimism around structural developments, such as corporate governance reforms requesting management plans around cost of capital and stock prices, as well as by the launch of the Nippon Individual Savings Account, which was widely expected to increase retail investor participation. The market was also boosted by yen depreciation, as the Bank of Japan elected not to change its negative rate policy at its January meeting. |
| • | The MSCI EAFE Index performed better in February 2024, as corporate earnings reports and positive economic data supported a solid monthly return. |
| • | European equities gained. Despite inflation in the region declining, the ECB reiterated its cautionary guidance regarding rate cuts. After reaching its highest level since July 2023 in January 2024, Europe’s Purchasing Managers’ Index (“PMI”) rose further in February, underscoring signs of improving economic activity in the region. |
| • | The U.K. equity market underperformed other international equity markets in February but still eked out a modestly positive return. Similar to the ECB, the BoE tempered interest rate cut expectations despite inflation coming in slightly below expectations. The U.K. equity market was further challenged by underwhelming corporate earnings and poor economic data that signaled the U.K. had entered a technical recession in the fourth quarter of 2023. |
| • | The Japanese equity market reached an all-time high in February, surpassing its previous high set 34 years earlier. Despite disappointing fourth quarter 2023 economic growth data, markets were enthused by the return of inflation in Japan, corporate governance reforms and stronger than consensus expected corporate earnings results, led mainly by large-cap stocks. |
| 3 |
MARKET REVIEW
| • | For the Reporting Period overall, eight of the eleven sectors in the MSCI EAFE Index posted positive total returns. The best performing sectors within the MSCI EAFE Index during the Reporting Period were information technology, industrials and financials, each posting a double-digit positive total return. The weakest performing sectors were consumer staples, utilities and energy. |
| • | The best performing countries within the MSCI EAFE Index were the Netherlands, Sweden and Israel. The weakest performing countries during the Reporting Period were Portugal, Hong Kong and Finland. |
Emerging Markets Equities
| • | Representing the emerging markets equity markets, the MSCI Emerging Markets Index (net) returned 4.93% during the Reporting Period, underperforming both the U.S. equity market and the developed international equity markets overall. |
| • | As the Reporting Period began in September 2023, emerging markets equities as a whole posted negative returns, as heightened expectations amid strong U.S. economic data that U.S. interest rates would remain higher for longer put pressure on emerging markets equities. |
| • | China remained top of mind for many investors with property market and local government debt issues reducing confidence in its equity market, which posted negative returns. |
| • | Elsewhere in Asia, India’s equity market rose, as the country’s long-term structural drivers remained strong and its near-term cyclical backdrop improved, with economic momentum advancing, corporate earnings growth broadening and corporate capital expenditures picking up. |
| • | In Latin America, the Brazilian equity market rose modestly, reporting economic growth that beat consensus expectations though high inflation kept investors alert to potential changes in economic policy. |
| • | In the EMEA (Europe, Middle East and Africa) region, Turkey’s equity market was the top performer, as domestic retail investor flows followed a signaled return to economic orthodoxy from the Turkish government. However, the equity markets of Poland, Greece and Saudi Arabia fell. |
| • | Emerging markets equities rallied in the fourth quarter of 2023 overall. |
| • | In October 2023, emerging markets equities as a whole fell as did most equity markets globally, as expectations for higher for longer interest rates, particularly in the U.S., and the outbreak of war in the Middle East reduced risk appetite, especially within emerging markets regions. |
| • | November 2023 was a strong month for emerging markets equities, as the view that developed markets interest rates had reached their peak supported equity market performance. All individual country constituents within the MSCI Emerging Markets Index posted positive returns, although China continued to struggle as consumer confidence remained weak amid ongoing property market troubles. |
| • | The MSCI Emerging Markets Index rose solidly in December 2023, as emerging markets proved beneficiaries of the widening view that U.S. interest rates were likely to fall more quickly than previously anticipated. A series of lower than consensus expected inflation reports in Europe and the U.S. were key drivers of such rate expectations. Adding to positive sentiment for emerging markets equities were high consensus earnings growth forecasts for emerging markets for 2024 and 2025. |
| • | The MSCI Emerging Markets Index fell in January 2024, suffering as strong U.S. economic data and hawkish messaging from the U.S. Fed altered interest rate cut altered consensus interest rate expectations. Despite China’s positive reported economic growth, its equity market was weakest, as the country continued to deal with issues of weak consumer confidence and property market concerns, with Evergrande, one of its largest real estate companies, going into liquidation during the month. Additionally, disappointment in the level of government support affected sentiment. Countries with strong trade links to China, including South Korea and Thailand, also suffered, as consensus expected export demand fell. On the other hand, India maintained its strong momentum from 2023, buoyed by corporate fundamentals and its government announcing a budget that reiterated a commitment to fiscal consolidation and introducing measures to encourage private capital expenditure. In Latin America, the rate differential between the U.S. and regional central banks was a drag, driving the equity markets of Chile, Peru and Brazil to negative monthly returns. |
| 4 |
MARKET REVIEW
| • | The MSCI Emerging Markets Index rose in February 2024, supported largely by a rebound in China’s equity market, which had recently hit five-year lows. China’s equity market was boosted by government intervention, including stock purchases by state-owned investment firms, and by data indicating better tourist activity during the lunar new year. |
| • | During the Reporting Period overall, the best performing sectors within the MSCI Emerging Markets Index were utilities, energy and information technology. The weakest performing sectors were communication services, real estate and materials. |
| • | The best performing countries within the MSCI Emerging Markets Index during the Reporting Period were Egypt, Poland, Colombia, Peru and India. The weakest performing countries were Hong Kong, Thailand, China, Czech Republic and Chile. |
Fund Changes and Highlights
No material changes were made to the Funds during the Reporting Period.
| 5 |
Index Definitions and Industry Terms
S&P 500 Index is a U.S. stock market index based on the market capitalizations of 500 large companies having common stock listed on the New York Stock Exchange or NASDAQ. The S&P 500® Index components and their weightings are determined by S&P Dow Jones Indices.
Russell 1000® Index measures the performance of the large-cap segment of the U.S. equity universe. The Russell 1000® Index is a subset of the Russell 3000® Index and includes approximately 1000 of the largest securities based on a combination of their market cap and current index membership. The Russell 1000® Index represents approximately 92% of the U.S. market. The Russell 1000® Index is constructed to provide a comprehensive and unbiased barometer for the large-cap segment and is completely reconstituted annually to ensure new and growing equities are reflected.
Russell 2000® Index measures the performance of the small-cap segment of the U.S. equity universe. The Russell 2000® Index is a subset of the Russell 3000® Index representing approximately 10% of the total market capitalization of that index. The Russell 2000® Index includes approximately 2000 of the smallest securities based on a combination of their market cap and current index membership. The Russell 2000® Index is constructed to provide a comprehensive and unbiased small-cap barometer and is completely reconstituted annually to ensure larger stocks do not distort the performance and characteristics of the true small-cap opportunity set.
Russell 3000® Index is a market capitalization weighted equity index maintained by the FTSE Russell that provides exposure to the entire U.S. stock market. The index tracks the performance of the 3,000 largest U.S.-traded stocks which represent about 98% of all U.S incorporated equity securities. It is not possible to invest directly in an index.
Russell MidCap® Index measures the performance of the mid-cap segment of the U.S. equity universe. The Russell Midcap® Index is a subset of the Russell 1000® Index. The Russell Midcap® Index includes approximately 800 of the smallest securities based on a combination of their market cap and current index membership. The Russell Midcap® Index represents approximately 31% of the total market capitalization of the Russell 1000® Index companies. The Russell Midcap® Index is constructed to provide a comprehensive and unbiased barometer for the mid-cap segment. The Russell Midcap® Index is completely reconstituted annually to ensure larger stocks do not distort the performance and characteristics of the true mid-cap opportunity set.
MSCI EAFE® Index is a market capitalization-weighted composite of securities in 21 developed markets. The MSCI EAFE® Index approximates the minimum possible dividend reinvestment. The dividend is reinvested after deduction for withholding tax, applying the rate to non-resident individuals who do not benefit from double taxation treaties. MSCI® Inc. uses withholding tax rates applicable to Luxembourg holding companies, as Luxembourg applies the highest rates. The MSCI EAFE® Index is unmanaged and the figures for the MSCI EAFE® Index do not include any deduction for fees or expenses.
MSCI Emerging Markets Index captures large and mid cap representation across 27 Emerging Markets countries. It is not possible to invest directly in an unmanaged index.
| 6 |
FUND BASICS
ActiveBeta® Emerging Markets Equity ETF
as of February 29, 2024
|
FUND SNAPSHOT |
|
As of February 29, 2024 |
||||
|
Market Price1 |
$30.70 | |||
|
Net Asset Value (NAV)1 |
$30.97 | |||
| 1 |
The Market Price is the price at which the Fund’s shares are trading on the NYSE Arca, Inc. The Market Price of the Fund’s shares will fluctuate and, at the time of sale, shares may be worth more or less than the original investment or the Fund’s then current net asset value (“NAV”). The NAV is the market value of one share of the Fund. This amount is derived by dividing the total value of all the securities in the Fund’s portfolio, plus other assets, less any liabilities, by the number of Fund shares outstanding. Fund shares are not individually redeemable and are issued and redeemed by the Fund at their NAV only in large, specified blocks of shares called creation units. Shares otherwise can be bought and sold only through exchange trading at market price (not NAV). Shares may trade at a premium or discount to their NAV in the secondary market. Information regarding how often shares of the Fund traded on NYSE Arca at a price above (i.e., at a premium) or below (i.e., at a discount) the NAV of the Fund can be found at www.GSAMFUNDS.com/ETFs. |
|
PERFORMANCE REVIEW |
| September 1, 2023-February 29, 2024 | Fund Total Return (based on NAV)2 |
Fund Total Return (based on Market Price)2 |
GS ActiveBeta® Emerging Markets Equity Index3 |
MSCI Emerging Market Index4 | ||||
| Shares | 5.95% | 5.49% | 6.93% | 4.93% | ||||
| 2 |
Total returns are calculated assuming purchase of a share at the market price or NAV on the first day and sale of a share at the market price or NAV on the last day of each period reported. The Total Returns based on NAV and Market Price assume the reinvestment of dividends and do not reflect brokerage commissions in connection with the purchase or sale of Fund shares, which if included would lower the performance shown above. The NAV used in the Total Return calculation assumes all management fees incurred by the Fund. Market Price returns are based upon the last trade as of 4:00pm EST and do not reflect the returns you would receive if you traded shares at other times. Total returns for periods less than one full year are not annualized. |
| 3 |
The Goldman Sachs ActiveBeta® Emerging Markets Equity Index (the “Index”) is designed to deliver exposure to equity securities of emerging market issuers. The Index seeks to capture common sources of active equity returns, including value (i.e., how attractively a stock is priced relative to its “fundamentals”, such as book value or free cash flow), momentum (i.e., whether a company’s share price is trending up or down), quality (i.e., profitability) and low volatility (i.e., a relatively low degree of fluctuation in a company’s share price over time). The index provider for the reference index on which the Index is based may delay or change a scheduled rebalancing or reconstitution of such reference index or the implementation of certain rules at its sole discretion. In such circumstances, the scheduled rebalancing or reconstitution of the Index may likewise be delayed or changed. It is not possible to invest directly in an unmanaged index. |
| 4 |
The MSCI Emerging Markets Index captures large and mid cap representation across 27 Emerging Markets countries. It is not possible to invest directly in an unmanaged index. |
|
|
|
The returns set forth in the tables above represent past performance. Past performance does not guarantee future results. The Fund’s investment returns and principal value will fluctuate so that an investor’s shares, when sold or redeemed, may be worth more or less than their original cost. Current performance may be lower or higher than the performance quoted above. Please visit our web site at www.GSAMFUNDS.com/ETFs. to obtain the most recent month-end returns. Performance reflects applicable fee waivers and/or expense limitations in effect during the periods shown. In their absence, performance would be reduced. Returns do not reflect the deduction of taxes that a shareholder would pay on Fund distributions or the sale of Fund shares. |
| 7 |
FUND BASICS
|
TOP TEN HOLDINGS AS OF 2/29/24 5 |
| Holding | % of Net Assets | Line of Business | Country | |||
|
Taiwan Semiconductor Manufacturing Co. Ltd. |
6.8% | Information Technology | Taiwan | |||
|
Samsung Electronics Co. Ltd. |
3.4 | Information Technology | South Korea | |||
|
Tencent Holdings Ltd. |
2.8 | Communication Services | China | |||
|
Alibaba Group Holding Ltd. |
1.7 | Consumer Discretionary | China | |||
|
Reliance Industries Ltd. |
1.0 | Energy | India | |||
|
Infosys Ltd. |
0.9 | Information Technology | India | |||
|
MediaTek, Inc. |
0.8 | Information Technology | Taiwan | |||
|
Tata Consultancy Services Ltd. |
0.7 | Information Technology | India | |||
|
China Construction Bank Corp., Class H |
0.7 | Financials | China | |||
|
PDD Holdings, Inc. ADR |
0.7 | Consumer Discretionary | China | |||
| 5 |
The top 10 holdings may not be representative of the Fund’s future investments. |
|
FUND VS BENCHMARK 6 |

| 6 |
Country and sector classifications for securities may differ between the above listing and the Schedule of Investments due to differing classification methodologies. The classification methodology used for the above listing is as set forth by MSCI. The Fund’s composition may differ over time. Consequently, the Fund’s overall sector allocations may differ from percentages contained in the chart above. The percentage shown for each investment category reflects the value of investments in that category as a percentage of market value (excluding investment in the securities lending reinvestment vehicle, if any). Underlying sector allocation of exchange-traded funds held by the Fund are not reflected in the chart above. Investments in the securities lending vehicle represented 1.3% of the Fund’s net assets as of February 29, 2024. Figures above may not sum to 100% due to rounding. |
| 7 |
The Fund seeks to provide investment results that closely correspond, before fees and expenses, to the performance of the Goldman Sachs ActiveBeta® Emerging Markets Equity Index. |
| 8 |
FUND BASICS
|
For more information about the Fund, please refer to www.GSAMFUNDS.com/ETFs. There, you can learn more about the Fund’s investment strategies, holdings, and performance. |
| 9 |
FUND BASICS
ActiveBeta® Europe Equity ETF
as of February 29, 2024
|
FUND SNAPSHOT |
|
As of February 29, 2024 |
||||
|
Market Price1 |
$35.17 | |||
|
Net Asset Value (NAV)1 |
$35.18 | |||
| 1 |
The Market Price is the price at which the Fund’s shares are trading on the NYSE Arca, Inc. The Market Price of the Fund’s shares will fluctuate and, at the time of sale, shares may be worth more or less than the original investment or the Fund’s then current net asset value (“NAV”). The NAV is the market value of one share of the Fund. This amount is derived by dividing the total value of all the securities in the Fund’s portfolio, plus other assets, less any liabilities, by the number of Fund shares outstanding. Fund shares are not individually redeemable and are issued and redeemed by the Fund at their NAV only in large, specified blocks of shares called creation units. Shares otherwise can be bought and sold only through exchange trading at market price (not NAV). Shares may trade at a premium or discount to their NAV in the secondary market. Information regarding how often shares of the Fund traded on NYSE Arca at a price above (i.e., at a premium) or below (i.e., at a discount) the NAV of the Fund can be found at www.GSAMFUNDS.com/ETFs. |
|
PERFORMANCE REVIEW |
| September 1, 2023-February 29, 2024 | Fund Total Return (based on NAV)2 |
Fund Total Return (based on Market Price)2 |
ActiveBeta® Europe Equity Index3 |
MSCI Europe Index4 |
||||||
| Shares | 7.09% | 7.24% | 7.15% | 8.17% | ||||||
| 2 |
Total returns are calculated assuming purchase of a share at the market price or NAV on the first day and sale of a share at the market price or NAV on the last day of each period reported. The Total Returns based on NAV and Market Price assume the reinvestment of dividends and do not reflect brokerage commissions in connection with the purchase or sale of Fund shares, which if included would lower the performance shown above. The NAV used in the Total Return calculation assumes all management fees incurred by the Fund. Market Price returns are based upon the last trade as of 4:00pm EST and do not reflect the returns you would receive if you traded shares at other times. Total returns for periods less than one full year are not annualized. |
| 3 |
The Goldman Sachs ActiveBeta® Europe Equity Index (the “Index”) is designed to deliver exposure to equity securities of developed market issuers in Europe. The Index seeks to capture common sources of active equity returns, including value (i.e., how attractively a stock is priced relative to its “fundamentals”, such as book value or free cash flow), momentum (i.e., whether a company’s share price is trending up or down), quality (i.e., profitability) and low volatility (i.e., a relatively low degree of fluctuation in a company’s share price over time). The index provider for the reference index on which the Index is based may delay or change a scheduled rebalancing or reconstitution of such reference index or the implementation of certain rules at its sole discretion. In such circumstances, the scheduled rebalancing or reconstitution of the Index may likewise be delayed or changed. It is not possible to invest directly in an unmanaged index. |
| 4 |
The MSCI Europe Index captures large and mid-cap representation across 15 Developed Markets countries. It is not possible to invest directly in an unmanaged index. |
|
The returns set forth in the tables above represent past performance. Past performance does not guarantee future results. The Fund’s investment returns and principal value will fluctuate so that an investor’s shares, when sold or redeemed, may be worth more or less than their original cost. Current performance may be lower or higher than the performance quoted above. Please visit our web site at www.GSAMFUNDS.com/ETFs. to obtain the most recent month-end returns. Returns do not reflect the deduction of taxes that a shareholder would pay on Fund distributions or the sale of Fund shares. |
| 10 |
FUND BASICS
|
TOP TEN HOLDINGS AS OF 2/29/24 5 |
| Holding | % of Net Assets | Line of Business | Country | |||
|
Novo Nordisk A/S, Class B |
3.5% | Health Care | Denmark | |||
|
ASML Holding NV |
3.0 | Information Technology | Netherlands | |||
|
Nestle SA |
2.1 | Consumer Staples | United States | |||
|
LVMH Moet Hennessy Louis Vuitton SE |
2.1 | Consumer Discretionary | France | |||
|
Novartis AG |
1.8 | Health Care | Switzerland | |||
|
Roche Holding AG |
1.6 | Health Care | United States | |||
|
AstraZeneca PLC |
1.5 | Health Care | United Kingdom | |||
|
SAP SE |
1.5 | Information Technology | Germany | |||
|
Shell PLC |
1.5 | Energy | Netherlands | |||
|
TotalEnergies SE |
1.2 | Energy | France | |||
| 5 |
The top 10 holdings may not be representative of the Fund’s future investments. |
|
FUND VS BENCHMARK 6 |
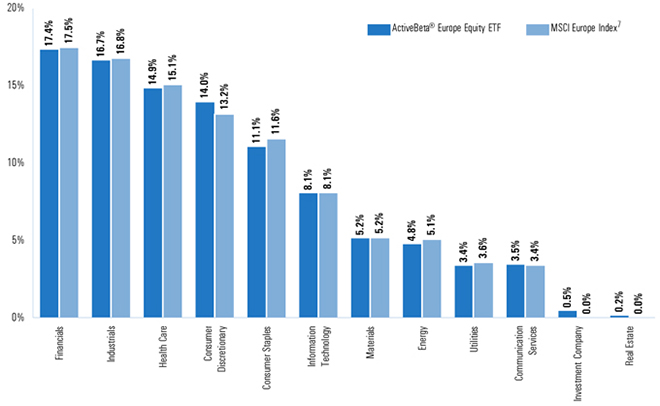
| 6 |
Country and sector classifications for securities may differ between the above listing and the Schedule of Investments due to differing classification methodologies. The classification methodology used for the above listing is as set forth by MSCI. The Fund’s composition may differ over time. Consequently, the Fund’s overall sector allocations may differ from percentages contained in the chart above. The percentage shown for each investment category reflects the value of investments in that category as a percentage of market value (excluding investment in the securities lending reinvestment vehicle, if any). Underlying sector allocation of exchange-traded funds held by the Fund are not reflected in the chart above. Investments in the securities lending vehicle represented 0.5% of the Fund’s net assets as of February 29, 2024. Figures above may not sum to 100% due to rounding. |
| 7 |
The Fund seeks to provide investment results that closely correspond, before fees and expenses, to the performance of the Goldman Sachs ActiveBeta® Europe Equity Index. |
| 11 |
FUND BASICS
|
For more information about the Fund, please refer to www.GSAMFUNDS.com/ETFs. There, you can learn more about the Fund’s investment strategies, holdings, and performance. |
| 12 |
FUND BASICS
ActiveBeta® International Equity ETF
as of February 29, 2024
|
FUND SNAPSHOT |
|
As of February 29, 2024 |
||||
|
Market Price1 |
$33.38 | |||
|
Net Asset Value (NAV)1 |
$33.34 | |||
| 1 |
The Market Price is the price at which the Fund’s shares are trading on the NYSE Arca, Inc. The Market Price of the Fund’s shares will fluctuate and, at the time of sale, shares may be worth more or less than the original investment or the Fund’s then current net asset value (“NAV”). The NAV is the market value of one share of the Fund. This amount is derived by dividing the total value of all the securities in the Fund’s portfolio, plus other assets, less any liabilities, by the number of Fund shares outstanding. Fund shares are not individually redeemable and are issued and redeemed by the Fund at their NAV only in large, specified blocks of shares called creation units. Shares otherwise can be bought and sold only through exchange trading at market price (not NAV). Shares may trade at a premium or discount to their NAV in the secondary market. Information regarding how often shares of the Fund traded on NYSE Arca at a price above (i.e., at a premium) or below (i.e., at a discount) the NAV of the Fund can be found at www.GSAMFUNDS.com/ETFs. |
|
PERFORMANCE REVIEW |
| September 1, 2023-February 29, 2024 | Fund Total Return (based on NAV)2 |
Fund Total Return (based on Market Price)2 |
GS ActiveBeta® Intl Equity Index3 |
MSCI World ex USA Index4 |
||||||
| Shares | 7.84% | 7.94% | 7.85% | 9.07% | ||||||
| 2 |
Total returns are calculated assuming purchase of a share at the market price or NAV on the first day and sale of a share at the market price or NAV on the last day of each period reported. The Total Returns based on NAV and Market Price assume the reinvestment of dividends and do not reflect brokerage commissions in connection with the purchase or sale of Fund shares, which if included would lower the performance shown above. The NAV used in the Total Return calculation assumes all management fees incurred by the Fund. Market Price returns are based upon the last trade as of 4:00pm EST and do not reflect the returns you would receive if you traded shares at other times. Total returns for periods less than one full year are not annualized. |
| 3 |
The Goldman Sachs ActiveBeta® International Equity Index (the “Index”) is designed to deliver exposure to equity securities of developed market issuers outside of the United States. The Index seeks to capture common sources of active equity returns, including value (i.e., how attractively a stock is priced relative to its “fundamentals”, such as book value or free cash flow), momentum (i.e., whether a company’s share price is trending up or down), quality (i.e., profitability) and low volatility (i.e., a relatively low degree of fluctuation in a company’s share price over time). The index provider for the reference index on which the Index is based may delay or change a scheduled rebalancing or reconstitution of such reference index or the implementation of certain rules at its sole discretion. In such circumstances, the scheduled rebalancing or reconstitution of the Index may likewise be delayed or changed. It is not possible to invest directly in an unmanaged index. |
| 4 |
The MSCI World ex USA Index captures large and mid cap representation across 22 of 23 Developed Markets countries. It is not possible to invest directly in an unmanaged index. |
|
The returns set forth in the tables above represent past performance. Past performance does not guarantee future results. The Fund’s investment returns and principal value will fluctuate so that an investor’s shares, when sold or redeemed, may be worth more or less than their original cost. Current performance may be lower or higher than the performance quoted above. Please visit our web site at www.GSAMFUNDS.com/ETFs. to obtain the most recent month-end returns. Returns do not reflect the deduction of taxes that a shareholder would pay on Fund distributions or the sale of Fund shares. |
| 13 |
FUND BASICS
|
TOP TEN HOLDINGS AS OF 2/29/24 5 |
| Holding | % of Net Assets | Line of Business | Country | |||
|
Novo Nordisk A/S, Class B |
2.0% | Health Care | Denmark | |||
|
ASML Holding NV |
1.5 | Information Technology | Netherlands | |||
|
LVMH Moet Hennessy Louis Vuitton SE |
1.2 | Consumer Discretionary | France | |||
|
Nestle SA |
1.2 | Consumer Staples | United States | |||
|
Novartis AG |
1.0 | Health Care | Switzerland | |||
|
Roche Holding AG |
0.9 | Health Care | United States | |||
|
AstraZeneca PLC |
0.8 | Health Care | United Kingdom | |||
|
SAP SE |
0.8 | Information Technology | Germany | |||
|
Shell PLC |
0.8 | Energy | Netherlands | |||
|
Constellation Software, Inc. |
0.7 | Information Technology | Canada | |||
| 5 |
The top 10 holdings may not be representative of the Fund’s future investments. |
|
FUND VS BENCHMARK 6 |

| 6 |
Country and sector classifications for securities may differ between the above listing and the Schedule of Investments due to differing classification methodologies. The classification methodology used for the above listing is as set forth by MSCI. The Fund’s composition may differ over time. Consequently, the Fund’s overall sector allocations may differ from percentages contained in the chart above. The percentage shown for each investment category reflects the value of investments in that category as a percentage of market value (excluding investment in the securities lending reinvestment vehicle, if any). Underlying sector allocation of exchange-traded funds held by the Fund are not reflected in the chart above. Investments in the securities lending vehicle represented 0.2% of the Fund’s net assets as of February 29, 2024. Figures above may not sum to 100% due to rounding. |
| 7 |
The Fund seeks to provide investment results that closely correspond, before fees and expenses, to the performance of the Goldman Sachs ActiveBeta® International Equity Index. |
| 14 |
FUND BASICS
|
For more information about the Fund, please refer to www.GSAMFUNDS.com/ETFs. There, you can learn more about the Fund’s investment strategies, holdings, and performance. |
| 15 |
FUND BASICS
ActiveBeta® Japan Equity ETF
as of February 29, 2024
|
FUND SNAPSHOT |
|
As of February 29, 2024 |
||||
|
Market Price1 |
$37.90 | |||
|
Net Asset Value (NAV)1 |
$37.93 | |||
| 1 |
The Market Price is the price at which the Fund’s shares are trading on the NYSE Arca, Inc. The Market Price of the Fund’s shares will fluctuate and, at the time of sale, shares may be worth more or less than the original investment or the Fund’s then current net asset value (“NAV”). The NAV is the market value of one share of the Fund. This amount is derived by dividing the total value of all the securities in the Fund’s portfolio, plus other assets, less any liabilities, by the number of Fund shares outstanding. Fund shares are not individually redeemable and are issued and redeemed by the Fund at their NAV only in large, specified blocks of shares called creation units. Shares otherwise can be bought and sold only through exchange trading at market price (not NAV). Shares may trade at a premium or discount to their NAV in the secondary market. Information regarding how often shares of the Fund traded on NYSE Arca at a price above (i.e., at a premium) or below (i.e., at a discount) the NAV of the Fund can be found at www.GSAMFUNDS.com/ETFs. |
|
PERFORMANCE REVIEW |
| September 1, 2023-February 29, 2024 | Fund Total Return (based on NAV)2 |
Fund Total Return (based on Market Price)2 |
GS ActiveBeta® Japan Equity Index3 |
MSCI Japan Index4 |
||||||
| Shares | 12.39% | 12.28% | 12.40% | 14.13% | ||||||
| 2 |
Total returns are calculated assuming purchase of a share at the market price or NAV on the first day and sale of a share at the market price or NAV on the last day of each period reported. The Total Returns based on NAV and Market Price assume the reinvestment of dividends and do not reflect brokerage commissions in connection with the purchase or sale of Fund shares, which if included would lower the performance shown above. The NAV used in the Total Return calculation assumes all management fees incurred by the Fund. Market Price returns are based upon the last trade as of 4:00pm EST and do not reflect the returns you would receive if you traded shares at other times. Total returns for periods less than one full year are not annualized. |
| 3 |
The Goldman Sachs ActiveBeta® Japan Equity Index (the “Index”) is designed to deliver exposure to equity securities of Japan issuers. The Index seeks to capture common sources of active equity returns, including value (i.e., how attractively a stock is priced relative to its “fundamentals”, such as book value or free cash flow), momentum (i.e., whether a company’s share price is trending up or down), quality (i.e., profitability) and low volatility (i.e., a relatively low degree of fluctuation in a company’s share price over time). The index provider for the reference index on which the Index is based may delay or change a scheduled rebalancing or reconstitution of such reference index or the implementation of certain rules at its sole discretion. In such circumstances, the scheduled rebalancing or reconstitution of the Index may likewise be delayed or changed. It is not possible to invest directly in an unmanaged index. |
| 4 |
The MSCI Japan Index is designed to measure the performance of the large and mid cap segments of the Japanese market. It is not possible to invest directly in an unmanaged index. |
|
The returns set forth in the tables above represent past performance. Past performance does not guarantee future results. The Fund’s investment returns and principal value will fluctuate so that an investor’s shares, when sold or redeemed, may be worth more or less than their original cost. Current performance may be lower or higher than the performance quoted above. Please visit our web site at www.GSAMFUNDS.com/ETFs. to obtain the most recent month-end returns. Returns do not reflect the deduction of taxes that a shareholder would pay on Fund distributions or the sale of Fund shares. |
| 16 |
FUND BASICS
|
TOP TEN HOLDINGS AS OF 2/29/24 5 |
| Holding | % of Net Assets | Line of Business | ||
|
Toyota Motor Corp. |
5.2% | Automobiles | ||
|
Mitsubishi UFJ Financial Group, Inc. |
2.7 | Banks | ||
|
Tokyo Electron Ltd. |
2.6 | Semiconductors & Semiconductor Equipment | ||
|
Sony Group Corp. |
2.0 | Household Durables | ||
|
Mitsubishi Corp. |
2.0 | Trading Companies & Distributors | ||
|
Hitachi Ltd. |
1.8 | Industrial Conglomerates | ||
|
Keyence Corp. |
1.8 | Electronic Equipment, Instruments & Components | ||
|
Sumitomo Mitsui Financial Group, Inc. |
1.7 | Banks | ||
|
Mitsui & Co. Ltd. |
1.4 | Trading Companies & Distributors | ||
|
Shin-Etsu Chemical Co. Ltd. |
1.4 | Chemicals | ||
5 The top 10 holdings may not be representative of the Fund’s future investments.
|
FUND VS BENCHMARK 6 |

| 6 |
Country and sector classifications for securities may differ between the above listing and the Schedule of Investments due to differing classification methodologies. The classification methodology used for the above listing is as set forth by MSCI. The Fund’s composition may differ over time. Consequently, the Fund’s overall sector allocations may differ from percentages contained in the chart above. The percentage shown for each investment category reflects the value of investments in that category as a percentage of market value (excluding investment in the securities lending reinvestment vehicle, if any). Underlying sector allocation of exchange-traded funds held by the Fund are not reflected in the chart above. Investments in the securities lending vehicle represented 0.2% of the Fund’s net assets as of February 29, 2024. Figures above may not sum to 100% due to rounding. |
| 7 |
The Fund seeks to provide investment results that closely correspond, before fees and expenses, to the performance of the Goldman Sachs ActiveBeta® Japan Equity Index. |
| 17 |
FUND BASICS
|
For more information about the Fund, please refer to www.GSAMFUNDS.com/ETFs. There, you can learn more about the Fund’s investment strategies, holdings, and performance. |
| 18 |
FUND BASICS
ActiveBeta® U.S. Large Cap Equity ETF
as of February 29, 2024
|
FUND SNAPSHOT |
|
As of February 29, 2024 |
||||
|
Market Price1 |
$100.75 | |||
|
Net Asset Value (NAV)1 |
$100.79 | |||
| 1 |
The Market Price is the price at which the Fund’s shares are trading on the NYSE Arca, Inc. The Market Price of the Fund’s shares will fluctuate and, at the time of sale, shares may be worth more or less than the original investment or the Fund’s then current net asset value (“NAV”). The NAV is the market value of one share of the Fund. This amount is derived by dividing the total value of all the securities in the Fund’s portfolio, plus other assets, less any liabilities, by the number of Fund shares outstanding. Fund shares are not individually redeemable and are issued and redeemed by the Fund at their NAV only in large, specified blocks of shares called creation units. Shares otherwise can be bought and sold only through exchange trading at market price (not NAV). Shares may trade at a premium or discount to their NAV in the secondary market. Information regarding how often shares of the Fund traded on NYSE Arca at a price above (i.e., at a premium) or below (i.e., at a discount) the NAV of the Fund can be found at www.GSAMFUNDS.com/ETFs. |
|
PERFORMANCE REVIEW |
| September 1, 2023-February 29, 2024 | Fund Total Return (based on NAV)2 |
Fund Total Return (based on Market Price)2 |
GS ActiveBeta® U.S. Large Cap Equity Index3 |
S&P 500 Index4 |
||||||
| Shares | 14.68% | 14.61% | 14.72% | 13.93% |
| 2 |
Total returns are calculated assuming purchase of a share at the market price or NAV on the first day and sale of a share at the market price or NAV on the last day of each period reported. The Total Returns based on NAV and Market Price assume the reinvestment of dividends and do not reflect brokerage commissions in connection with the purchase or sale of Fund shares, which if included would lower the performance shown above. The NAV used in the Total Return calculation assumes all management fees incurred by the Fund. Market Price returns are based upon the last trade as of 4:00pm EST and do not reflect the returns you would receive if you traded shares at other times. Total returns for periods less than one full year are not annualized. |
| 3 |
The Goldman Sachs ActiveBeta® U.S. Large Cap Equity Index (the “Index”) is designed to deliver exposure to equity securities of large capitalization U.S. issuers. The Index seeks to capture common sources of active equity returns, including value (i.e., how attractively a stock is priced relative to its “fundamentals”, such as book value or free cash flow), momentum (i.e., whether a company’s share price is trending up or down), quality (i.e., profitability) and low volatility (i.e., a relatively low degree of fluctuation in a company’s share price over time). The index provider for the reference index on which the Index is based may delay or change a scheduled rebalancing or reconstitution of such reference index or the implementation of certain rules at its sole discretion. In such circumstances, the scheduled rebalancing or reconstitution of the Index may likewise be delayed or changed. It is not possible to invest directly in an unmanaged index. |
| 4 |
The S&P 500 Index is the Standard & Poor’s 500 Composite Index of 500 stocks, an unmanaged index of common stock prices. The Index figures do not reflect any deduction for fees, expenses or taxes. It is not possible to invest directly in an unmanaged index. |
|
The returns set forth in the tables above represent past performance. Past performance does not guarantee future results. The Fund’s investment returns and principal value will fluctuate so that an investor’s shares, when sold or redeemed, may be worth more or less than their original cost. Current performance may be lower or higher than the performance quoted above. Please visit our web site at www.GSAMFUNDS.com/ETFs. to obtain the most recent month-end returns. Returns do not reflect the deduction of taxes that a shareholder would pay on Fund distributions or the sale of Fund shares. |
| 19 |
FUND BASICS
|
TOP TEN HOLDINGS AS OF 2/29/24 5 |
| Holding | % of Net Assets | Line of Business | ||
|
Microsoft Corp. |
6.2% | Software | ||
|
Apple, Inc. |
5.5 | Technology Hardware, Storage & Peripherals | ||
|
NVIDIA Corp. |
3.7 | Semiconductors & Semiconductor Equipment | ||
|
Amazon.com, Inc. |
3.1 | Broadline Retail | ||
|
Meta Platforms, Inc., Class A |
2.5 | Interactive Media & Services | ||
|
Alphabet, Inc., Class A |
1.7 | Interactive Media & Services | ||
|
Alphabet, Inc., Class C |
1.6 | Interactive Media & Services | ||
|
Eli Lilly & Co. |
1.4 | Pharmaceuticals | ||
|
Broadcom, Inc. |
1.0 | Semiconductors & Semiconductor Equipment | ||
|
Berkshire Hathaway, Inc., Class B |
1.0 | Financial Services | ||
| 5 |
The top 10 holdings may not be representative of the Fund’s future investments. |
|
FUND VS BENCHMARK 6 |
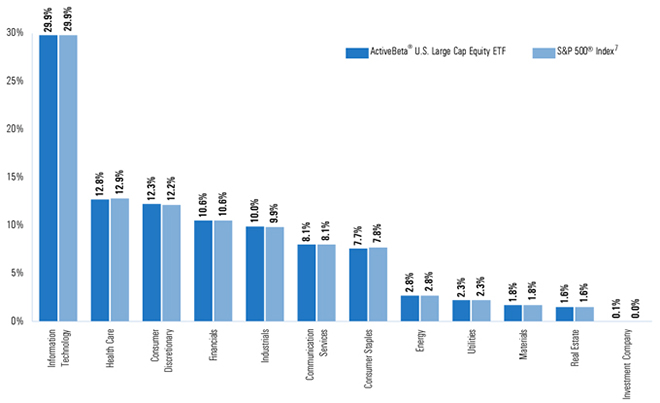
| 6 |
Country and sector classifications for securities may differ between the above listing and the Schedule of Investments due to differing classification methodologies. The classification methodology used for the above listing is as set forth by Standard & Poor’s. The Fund’s composition may differ over time. Consequently, the Fund’s overall sector allocations may differ from percentages contained in the chart above. The percentage shown for each investment category reflects the value of investments in that category as a percentage of market value (excluding investment in the securities lending reinvestment vehicle, if any). Underlying sector allocation of exchange-traded funds held by the Fund are not reflected in the chart above. Investments in the securities lending vehicle represented 0.1% of the Fund’s net assets as of February 29, 2024. Figures above may not sum to 100% due to rounding. |
| 7 |
The Fund seeks to provide investment results that closely correspond, before fees and expenses, to the performance of the Goldman Sachs ActiveBeta® U.S. Large Cap Equity Index. |
| 20 |
FUND BASICS
|
For more information about the Fund, please refer to www.GSAMFUNDS.com/ETFs. There, you can learn more about the Fund’s investment strategies, holdings, and performance. |
| 21 |
FUND BASICS
ActiveBeta® U.S. Small Cap Equity ETF
as of February 29, 2024
|
FUND SNAPSHOT |
|
As of February 29, 2024 |
||||
|
Market Price1 |
$63.48 | |||
|
Net Asset Value (NAV)1 |
$63.63 | |||
| 1 |
The Market Price is the price at which the Fund’s shares are trading on the NYSE Arca, Inc. The Market Price of the Fund’s shares will fluctuate and, at the time of sale, shares may be worth more or less than the original investment or the Fund’s then current net asset value (“NAV”). The NAV is the market value of one share of the Fund. This amount is derived by dividing the total value of all the securities in the Fund’s portfolio, plus other assets, less any liabilities, by the number of Fund shares outstanding. Fund shares are not individually redeemable and are issued and redeemed by the Fund at their NAV only in large, specified blocks of shares called creation units. Shares otherwise can be bought and sold only through exchange trading at market price (not NAV). Shares may trade at a premium or discount to their NAV in the secondary market. Information regarding how often shares of the Fund traded on NYSE Arca at a price above (i.e., at a premium) or below (i.e., at a discount) the NAV of the Fund can be found at www.GSAMFUNDS.com/ETFs. |
|
PERFORMANCE REVIEW |
| September 1, 2023-February 29, 2024 | Fund Total Return (based on NAV)2 |
Fund Total Return (based on Market Price)2 |
ActiveBeta® U.S. Small Cap Equity ETF Index3 |
Russell 2000® Index4 |
||||||
| Shares | 8.83% | 8.62% | 8.90% | 8.97% | ||||||
| 2 |
Total returns are calculated assuming purchase of a share at the market price or NAV on the first day and sale of a share at the market price or NAV on the last day of each period reported. The Total Returns based on NAV and Market Price assume the reinvestment of dividends and do not reflect brokerage commissions in connection with the purchase or sale of Fund shares, which if included would lower the performance shown above. The NAV used in the Total Return calculation assumes all management fees incurred by the Fund. Market Price returns are based upon the last trade as of 4:00pm EST and do not reflect the returns you would receive if you traded shares at other times. Total returns for periods less than one full year are not annualized. |
| 3 |
The Goldman Sachs ActiveBeta® U.S. Small Cap Equity Index (the “Index”) is designed to deliver exposure to equity securities of small capitalization U.S. issuers. The Index seeks to capture common sources of active equity returns, including value (i.e., how attractively a stock is priced relative to its “fundamentals”, such as book value or free cash flow), momentum (i.e., whether a company’s share price is trending up or down), quality (i.e., profitability) and low volatility (i.e., a relatively low degree of fluctuation in a company’s share price over time). The index provider for the reference index on which the Index is based may delay or change a scheduled rebalancing or reconstitution of such reference index or the implementation of certain rules at its sole discretion. In such circumstances, the scheduled rebalancing or reconstitution of the Index may likewise be delayed or changed. It is not possible to invest directly in an unmanaged index. |
| 4 |
The Russell 2000® Index is an unmanaged index of common stock prices that measures the performance of the 2000 smallest companies in the Russell 3000® Index. The Index is constructed to provide a comprehensive and unbiased small-cap barometer and is completely reconstituted annually to ensure larger stocks do not distort the performance and characteristics of the true small-cap opportunity set. |
|
The returns set forth in the tables above represent past performance. Past performance does not guarantee future results. The Fund’s investment returns and principal value will fluctuate so that an investor’s shares, when sold or redeemed, may be worth more or less than their original cost. Current performance may be lower or higher than the performance quoted above. Please visit our web site at www.GSAMFUNDS.com/ETFs. to obtain the most recent month-end returns. Returns do not reflect the deduction of taxes that a shareholder would pay on Fund distributions or the sale of Fund shares. |
| 22 |
FUND BASICS
|
TOP TEN HOLDINGS AS OF 2/29/24 5 |
| Holding | % of Net Assets | Line of Business | ||
|
Super Micro Computer, Inc. |
1.3% | Technology Hardware, Storage & Peripherals | ||
|
Comfort Systems USA, Inc. |
0.5 | Construction & Engineering | ||
|
Applied Industrial Technologies, Inc. |
0.4 | Trading Companies & Distributors | ||
|
Simpson Manufacturing Co., Inc. |
0.4 | Building Products | ||
|
Atkore, Inc. |
0.4 | Electrical Equipment | ||
|
Alpha Metallurgical Resources, Inc. |
0.4 | Metals & Mining | ||
|
Boise Cascade Co. |
0.4 | Trading Companies & Distributors | ||
|
Abercrombie & Fitch Co., Class A |
0.4 | Specialty Retail | ||
|
UFP Industries, Inc. |
0.4 | Building Products | ||
|
GMS, Inc. |
0.4 | Trading Companies & Distributors | ||
| 5 |
The top 10 holdings may not be representative of the Fund’s future investments. |
|
FUND VS BENCHMARK 6 |

| 6 |
Country and sector classifications for securities may differ between the above listing and the Schedule of Investments due to differing classification methodologies. The classification methodology used for the above listing is as set forth by Russell Investments. The Fund’s composition may differ over time. Consequently, the Fund’s overall sector allocations may differ from percentages contained in the chart above. The percentage shown for each investment category reflects the value of investments in that category as a percentage of market value (excluding investment in the securities lending reinvestment vehicle, if any). Underlying sector allocation of exchange-traded funds held by the Fund are not reflected in the chart above. Investments in the securities lending vehicle represented 0.6% of the Fund’s net assets as of February 29, 2024. Figures above may not sum to 100% due to rounding. |
| 7 |
The Fund seeks to provide investment results that closely correspond, before fees and expenses, to the performance of the Goldman Sachs ActiveBeta® U.S. Small Cap Equity Index. |
| 23 |
FUND BASICS
|
For more information about the Fund, please refer to www.GSAMFUNDS.com/ETFs. There, you can learn more about the Fund’s investment strategies, holdings, and performance. |
| 24 |
FUND BASICS
ActiveBeta® World Low Vol Plus Equity ETF
as of February 29, 2024
|
FUND SNAPSHOT |
|
As of February 29, 2024 |
||||
|
Market Price1 |
$45.79 | |||
|
Net Asset Value (NAV)1 |
$45.76 | |||
| 1 |
The Market Price is the price at which the Fund’s shares are trading on the Cboe BZX Exchange, Inc (“Cboe BZX”). The Market Price of the Fund’s shares will fluctuate and, at the time of sale, shares may be worth more or less than the original investment or the Fund’s then current net asset value (“NAV”). The NAV is the market value of one share of the Fund. This amount is derived by dividing the total value of all the securities in the Fund’s portfolio, plus other assets, less any liabilities, by the number of Fund shares outstanding. Fund shares are not individually redeemable and are issued and redeemed by the Fund at their NAV only in large, specified blocks of shares called creation units. Shares otherwise can be bought and sold only through exchange trading at market price (not NAV). Shares may trade at a premium or discount to their NAV in the secondary market. Information regarding how often shares of the Fund traded on Cboe BZX at a price above (i.e., at a premium) or below (i.e., at a discount) the NAV of the Fund can be found at www.GSAMFUNDS.com/ETFs. |
|
PERFORMANCE REVIEW |
| September 1, 2023-February 29, 2024 | Fund Total Return (based on NAV)2 |
Fund Total Return (based on Market Price)2 |
GS ActiveBeta® World Low Vol Plus Equity Index3 |
|||||
| Shares | 11.90% | 11.87% | 11.75% | |||||
| 2 |
Total returns are calculated assuming purchase of a share at the market price or NAV on the first day and sale of a share at the market price or NAV on the last day of each period reported. The Total Returns based on NAV and Market Price assume the reinvestment of dividends and do not reflect brokerage commissions in connection with the purchase or sale of Fund shares, which if included would lower the performance shown above. The NAV used in the Total Return calculation assumes all management fees incurred by the Fund. Market Price returns are based upon the last trade as of 4:00pm EST and do not reflect the returns you would receive if you traded shares at other times. Total returns for periods less than one full year are not annualized. |
| 3 |
The Goldman Sachs ActiveBeta® World Low Vol Plus Equity Index (the “Index”) is designed to deliver exposure is designed to deliver exposure to large and mid-capitalization equity securities of developed market issuers, including the United States. The Index seeks to capture common sources of active equity returns, including low volatility (i.e., a relatively low degree of fluctuation in a company’s share price over time), value (i.e., how attractively a stock is priced relative to its “fundamentals,” such as book value and free cash flow), momentum (i.e., whether a company’s share price is trending up or down), and quality (i.e., profitability). The Index seeks to provide exposure to these factors with an emphasis on the low volatility factor. The index is reconstituted and rebalanced quarterly. It is not possible to invest directly in an unmanaged index. |
|
The returns set forth in the tables above represent past performance. Past performance does not guarantee future results. The Fund’s investment returns and principal value will fluctuate so that an investor’s shares, when sold or redeemed, may be worth more or less than their original cost. Current performance may be lower or higher than the performance quoted above. Please visit our web site at www.GSAMFUNDS.com/ETFs. to obtain the most recent month-end returns. Returns do not reflect the deduction of taxes that a shareholder would pay on Fund distributions or the sale of Fund shares. |
| 25 |
FUND BASICS
|
TOP TEN HOLDINGS AS OF 2/29/24 5 |
| Holding | % of Net Assets | Line of Business | Country | |||
|
Microsoft Corp. |
2.9% | Information Technology | United States | |||
|
Apple, Inc. |
2.9 | Information Technology | United States | |||
|
O’Reilly Automotive, Inc. |
1.2 | Consumer Discretionary | United States | |||
|
Amazon.com, Inc. |
1.2 | Consumer Discretionary | United States | |||
|
Berkshire Hathaway, Inc., Class B |
1.2 | Financials | United States | |||
|
Walmart, Inc. |
1.1 | Consumer Staples | United States | |||
|
NVIDIA Corp. |
1.0 | Information Technology | United States | |||
|
Meta Platforms, Inc., Class A |
1.0 | Communication Services | United States | |||
|
International Business Machines Corp. |
0.9 | Information Technology | United States | |||
|
Home Depot, Inc. (The) |
0.8 | Consumer Discretionary | United States | |||
| 4 |
The top 10 holdings may not be representative of the Fund’s future investments. |
|
FUND VS BENCHMARK 5 |
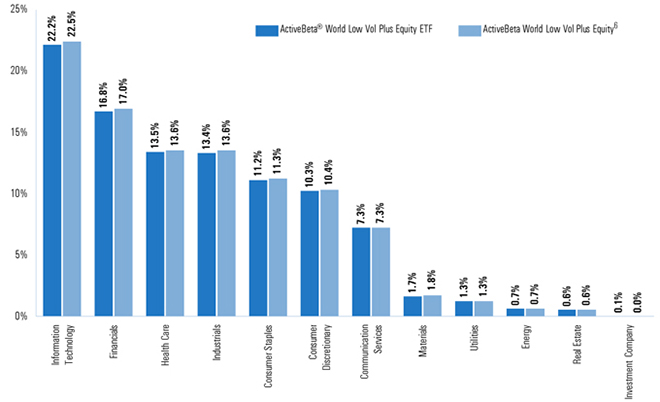
| 5 |
Country and sector classifications for securities may differ between the above listing and the Schedule of Investments due to differing classification methodologies. The classification methodology used for the above listing is as set forth by Standard & Poor’s. The Fund’s composition may differ over time. Consequently, the Fund’s overall sector allocations may differ from percentages contained in the chart above. The percentage shown for each investment category reflects the value of investments in that category as a percentage of market value (excluding investment in the securities lending reinvestment vehicle, if any). Underlying sector allocation of exchange-traded funds held by the Fund are not reflected in the chart above. Investments in the securities lending vehicle represented 0.1% of the Fund’s net assets as of February 29, 2024. Figures above may not sum to 100% due to rounding. |
| 6 |
The Fund seeks to provide investment results that closely correspond, before fees and expenses, to the performance of the Goldman Sachs ActiveBeta® World Low Vol Plus Equity Index. |
| 26 |
FUND BASICS
|
For more information about the Fund, please refer to www.GSAMFUNDS.com/ETFs. There, you can learn more about the Fund’s investment strategies, holdings, and performance. |
| 27 |
GOLDMAN SACHS ACTIVEBETA® EMERGING MARKETS EQUITY ETF
| Shares |
Description | Value | ||||||
| Common Stocks – 96.8% |
| |||||||
| Brazil – 4.0% | ||||||||
| 667,886 | Ambev SA (Consumer Staples) | $ | 1,691,004 | |||||
| 499,804 | B3 SA – Brasil Bolsa Balcao (Financials) | 1,290,589 | ||||||
| 403,110 | Banco Bradesco SA (Financials) | 997,908 | ||||||
| 92,046 | Banco do Brasil SA (Financials) | 1,071,877 | ||||||
| 64,908 | Banco Santander Brasil SA (Financials) | 373,616 | ||||||
| 543,960 | BB Seguridade Participacoes SA (Financials) | 3,650,011 | ||||||
| 190,031 | CCR SA (Industrials) | 527,030 | ||||||
| 121,391 | Centrais Eletricas Brasileiras SA (Utilities) | 1,062,765 | ||||||
| 94,045 | CPFL Energia SA (Utilities) | 669,850 | ||||||
| 48,079 | Energisa SA (Utilities) | 491,952 | ||||||
| 76,943 | Engie Brasil Energia SA (Utilities) | 650,709 | ||||||
| 279,333 | Equatorial Energia SA (Utilities) | 1,921,569 | ||||||
| 48,138 | Hypera SA (Health Care) | 318,553 | ||||||
| 84,762 | Klabin SA (Materials) | 385,030 | ||||||
| 257,373 | Lojas Renner SA (Consumer Discretionary) | 818,430 | ||||||
| 1,328,900 | Magazine Luiza SA (Consumer Discretionary)* | 569,683 | ||||||
| 306,273 | Natura & Co. Holding SA (Consumer Staples)* | 1,005,366 | ||||||
| 489,805 | Petroleo Brasileiro SA (Energy) | 4,063,430 | ||||||
| 76,179 | PRIO SA (Energy) | 670,159 | ||||||
| 552,715 | Raia Drogasil SA (Consumer Staples) | 2,963,446 | ||||||
| 85,225 | Suzano SA (Materials) | 966,546 | ||||||
| 201,741 | Telefonica Brasil SA (Communication Services) | 2,212,039 | ||||||
| 273,596 | TIM SA (Communication Services) | 1,000,521 | ||||||
| 442,527 | Vale SA (Materials) | 5,966,386 | ||||||
| 133,795 | Vibra Energia SA (Consumer Discretionary) | 696,354 | ||||||
| 236,849 | WEG SA (Industrials) | 1,748,964 | ||||||
|
|
|
|||||||
| 37,783,787 | ||||||||
|
|
||||||||
| Chile – 0.4% | ||||||||
| 918,721 | Cencosud SA (Consumer Staples) | 1,648,352 | ||||||
| 231,540 | Empresas CMPC SA (Materials) | 410,636 | ||||||
| 82,031 | Empresas Copec SA (Energy) | 525,940 | ||||||
| 2,982,330 | Enel Americas SA (Utilities) | 303,780 | ||||||
| 321,705 | Falabella SA (Consumer Discretionary)* | 815,062 | ||||||
|
|
|
|||||||
| 3,703,770 | ||||||||
|
|
||||||||
| China – 27.3% | ||||||||
| 193,995 | 360 Security Technology, Inc., Class A (Information Technology)* | 236,125 | ||||||
| Shares |
Description | Value | ||||||
| Common Stocks – (continued) |
| |||||||
| China – (continued) | ||||||||
| 358,131 | 37 Interactive Entertainment Network Technology Group Co. Ltd., Class A (Communication Services) | $ | 968,237 | |||||
| 2,716,985 | Agricultural Bank of China Ltd., Class A (Financials) | 1,579,982 | ||||||
| 4,262,766 | Agricultural Bank of China Ltd., Class H (Financials) | 1,753,284 | ||||||
| 125,685 | Aier Eye Hospital Group Co. Ltd., Class A (Health Care) | 255,548 | ||||||
| 19,798 | Airtac International Group (Industrials) | 757,860 | ||||||
| 82,404 | Akeso, Inc. (Health Care)*(a) | 495,763 | ||||||
| 1,694,540 | Alibaba Group Holding Ltd. (Consumer Discretionary) | 15,779,170 | ||||||
| 614,409 | Alibaba Health Information Technology Ltd. (Consumer Staples)* | 269,973 | ||||||
| 449,336 | Aluminum Corp. of China Ltd., Class A (Materials) | 377,292 | ||||||
| 1,254,817 | Aluminum Corp. of China Ltd., Class H (Materials) | 628,306 | ||||||
| 63,185 | Anhui Conch Cement Co. Ltd., Class A (Materials) | 209,937 | ||||||
| 60,318 | Anker Innovations Technology Co. Ltd., Class A (Information Technology) | 683,943 | ||||||
| 170,659 | ANTA Sports Products Ltd. (Consumer Discretionary) | 1,673,063 | ||||||
| 16,002 | Autohome, Inc. ADR (Communication Services) | 415,892 | ||||||
| 162,417 | Baidu, Inc., Class A (Communication Services)* | 2,065,273 | ||||||
| 1,822,276 | Bank of Beijing Co. Ltd., Class A (Financials) | 1,310,071 | ||||||
| 372,194 | Bank of Changsha Co. Ltd., Class A (Financials) | 402,400 | ||||||
| 2,923,030 | Bank of China Ltd., Class A (Financials) | 1,813,392 | ||||||
| 8,968,969 | Bank of China Ltd., Class H (Financials) | 3,528,564 | ||||||
| 1,933,364 | Bank of Communications Co. Ltd., Class A (Financials) | 1,682,411 | ||||||
| 2,384,594 | Bank of Communications Co. Ltd., Class H (Financials) | 1,565,606 | ||||||
| 193,627 | Bank of Hangzhou Co. Ltd., Class A (Financials) | 297,753 | ||||||
| 1,317,967 | Bank of Jiangsu Co. Ltd., Class A (Financials) | 1,402,978 | ||||||
| 608,526 | Bank of Nanjing Co. Ltd., Class A (Financials) | 738,989 | ||||||
| 997,546 | Bank of Shanghai Co. Ltd., Class A (Financials) | 904,060 | ||||||
| 343,233 | Bank of Suzhou Co. Ltd., Class A (Financials) | 337,743 | ||||||
| 456,232 | Baoshan Iron & Steel Co. Ltd., Class A (Materials) | 422,340 | ||||||
| 37,509 | BeiGene Ltd. (Health Care)* | 507,863 | ||||||
| 28 | The accompanying notes are an integral part of these financial statements. |
GOLDMAN SACHS ACTIVEBETA® EMERGING MARKETS EQUITY ETF
| Shares |
Description | Value | ||||||
| Common Stocks – (continued) |
| |||||||
| China – (continued) | ||||||||
| 245,583 | Beijing Enterprises Holdings Ltd. (Utilities) | $ | 925,391 | |||||
| 6,317 | Beijing Kingsoft Office Software, Inc., Class A (Information Technology) | 237,548 | ||||||
| 64,761 | Beijing Wantai Biological Pharmacy Enterprise Co. Ltd., Class A (Health Care) | 661,070 | ||||||
| 187,161 | Beijing Yanjing Brewery Co. Ltd., Class A (Consumer Staples) | 227,547 | ||||||
| 471,212 | Beijing-Shanghai High Speed Railway Co. Ltd., Class A (Industrials) | 330,262 | ||||||
| 62,206 | Bloomage Biotechnology Corp. Ltd., Class A (Health Care) | 551,935 | ||||||
| 1,042,510 | BOE Technology Group Co. Ltd., Class A (Information Technology) | 577,303 | ||||||
| 2,031,813 | Bosideng International Holdings Ltd. (Consumer Discretionary) | 1,025,146 | ||||||
| 12,493 | BYD Co. Ltd., Class A (Consumer Discretionary) | 331,517 | ||||||
| 56,472 | BYD Co. Ltd., Class H (Consumer Discretionary) | 1,394,344 | ||||||
| 114,796 | BYD Electronic International Co. Ltd. (Information Technology) | 434,034 | ||||||
| 166,904 | By-health Co. Ltd., Class A (Consumer Staples) | 391,475 | ||||||
| 136,061 | C&D International Investment Group Ltd. (Real Estate) | 221,415 | ||||||
| 363,177 | Caitong Securities Co. Ltd., Class A (Financials) | 402,228 | ||||||
| 440,955 | CECEP Solar Energy Co. Ltd., Class A (Utilities) | 332,923 | ||||||
| 996,903 | CGN Power Co. Ltd., Class A (Utilities) | 534,061 | ||||||
| 3,593,548 | CGN Power Co. Ltd., Class H (Utilities)(a) | 1,092,459 | ||||||
| 12,284 | Changchun High & New Technology Industry Group, Inc., Class A (Health Care) | 219,076 | ||||||
| 402,335 | Changjiang Securities Co. Ltd., Class A (Financials) | 307,115 | ||||||
| 3,763,641 | China Cinda Asset Management Co. Ltd., Class H (Financials) | 360,557 | ||||||
| 2,699,302 | China CITIC Bank Corp. Ltd., Class H (Financials) | 1,437,780 | ||||||
| 1,157,315 | China Communications Services Corp. Ltd., Class H (Industrials) | 492,267 | ||||||
| 1,164,718 | China Construction Bank Corp., Class A (Financials) | 1,131,540 | ||||||
| 11,095,407 | China Construction Bank Corp., Class H (Financials) | 6,916,205 | ||||||
| 1,200,550 | China Energy Engineering Corp. Ltd., Class A (Industrials) | 363,235 | ||||||
| Shares |
Description | Value | ||||||
| Common Stocks – (continued) |
| |||||||
| China – (continued) | ||||||||
| 1,256,618 | China Everbright Bank Co. Ltd., Class A (Financials) | $ | 561,578 | |||||
| 2,475,872 | China Everbright Bank Co. Ltd., Class H (Financials) | 774,817 | ||||||
| 1,540,342 | China Feihe Ltd. (Consumer Staples)(a) | 767,338 | ||||||
| 291,842 | China Galaxy Securities Co. Ltd., Class A (Financials) | 492,125 | ||||||
| 1,057,280 | China Galaxy Securities Co. Ltd., Class H (Financials) | 556,406 | ||||||
| 301,977 | China Great Wall Securities Co. Ltd., Class A (Financials) | 331,933 | ||||||
| 1,175,666 | China Medical System Holdings Ltd. (Health Care) | 1,931,211 | ||||||
| 535,493 | China Mengniu Dairy Co. Ltd. (Consumer Staples)* | 1,346,120 | ||||||
| 200,210 | China Merchants Bank Co. Ltd., Class A (Financials) | 890,285 | ||||||
| 387,865 | China Merchants Bank Co. Ltd., Class H (Financials) | 1,513,549 | ||||||
| 293,160 | China Merchants Port Holdings Co. Ltd. (Industrials) | 363,604 | ||||||
| 173,512 | China Merchants Securities Co. Ltd., Class A (Financials) | 339,547 | ||||||
| 270,970 | China Merchants Shekou Industrial Zone Holdings Co. Ltd., Class A (Real Estate) | 354,261 | ||||||
| 1,718,670 | China Minsheng Banking Corp. Ltd., Class A (Financials) | 963,662 | ||||||
| 2,916,758 | China Minsheng Banking Corp. Ltd., Class H (Financials) | 1,028,287 | ||||||
| 66,558 | China National Medicines Corp. Ltd., Class A (Health Care) | 290,979 | ||||||
| 388,960 | China National Nuclear Power Co. Ltd., Class A (Utilities) | 468,571 | ||||||
| 285,841 | China Oilfield Services Ltd., Class H (Energy) | 251,929 | ||||||
| 53,644 | China Pacific Insurance Group Co. Ltd., Class A (Financials) | 190,744 | ||||||
| 170,531 | China Pacific Insurance Group Co. Ltd., Class H (Financials) | 325,431 | ||||||
| 1,430,853 | China Petroleum & Chemical Corp., Class A (Energy) | 1,241,155 | ||||||
| 3,509,175 | China Petroleum & Chemical Corp., Class H (Energy) | 1,940,876 | ||||||
| 575,661 | China Railway Group Ltd., Class A (Industrials) | 507,331 | ||||||
| 910,170 | China Railway Group Ltd., Class H (Industrials) | 444,110 | ||||||
| 85,134 | China Resources Beer Holdings Co. Ltd. (Consumer Staples) | 369,188 | ||||||
| 75,279 | China Resources Land Ltd. (Real Estate) | 231,737 | ||||||
| 743,451 | China Resources Pharmaceutical Group Ltd. (Health Care)(a) | 503,307 | ||||||
| The accompanying notes are an integral part of these financial statements. | 29 |
GOLDMAN SACHS ACTIVEBETA® EMERGING MARKETS EQUITY ETF
|
Schedule of Investments (continued)
February 29, 2024 (Unaudited) |
| Shares |
Description | Value | ||||||
| Common Stocks – (continued) |
| |||||||
| China – (continued) | ||||||||
| 100,510 | China Resources Sanjiu Medical & Pharmaceutical Co. Ltd., Class A (Health Care) | $ | 766,946 | |||||
| 158,191 | China Shenhua Energy Co. Ltd., Class A (Energy) | 847,462 | ||||||
| 546,457 | China Shenhua Energy Co. Ltd., Class H (Energy) | 2,111,476 | ||||||
| 430,004 | China State Construction Engineering Corp. Ltd., Class A (Industrials) | 319,284 | ||||||
| 294,356 | China Taiping Insurance Holdings Co. Ltd. (Financials) | 256,802 | ||||||
| 568,205 | China Three Gorges Renewables Group Co. Ltd., Class A (Utilities) | 364,333 | ||||||
| 11,360,320 | China Tower Corp. Ltd., Class H (Communication Services)(a) | 1,378,539 | ||||||
| 1,329,095 | China United Network Communications Ltd., Class A (Communication Services) | 885,418 | ||||||
| 242,111 | China Yangtze Power Co. Ltd., Class A (Utilities) | 841,731 | ||||||
| 2,565,381 | China Zheshang Bank Co. Ltd., Class A (Financials) | 989,800 | ||||||
| 61,459 | Chongqing Brewery Co. Ltd., Class A (Consumer Staples) | 558,699 | ||||||
| 1,258,195 | Chongqing Rural Commercial Bank Co. Ltd., Class A (Financials) | 782,306 | ||||||
| 61,562 | Chongqing Taiji Industry Group Co. Ltd., Class A (Health Care)* | 324,161 | ||||||
| 69,971 | Chongqing Zhifei Biological Products Co. Ltd., Class A (Health Care) | 519,447 | ||||||
| 219,961 | Chow Tai Fook Jewellery Group Ltd. (Consumer Discretionary) | 329,290 | ||||||
| 691,449 | CITIC Ltd. (Industrials) | 698,621 | ||||||
| 139,148 | CITIC Securities Co. Ltd., Class A (Financials) | 411,346 | ||||||
| 1,089,594 | COSCO SHIPPING Development Co. Ltd., Class A (Industrials) | 372,007 | ||||||
| 391,190 | COSCO SHIPPING Holdings Co. Ltd., Class A (Industrials) | 570,070 | ||||||
| 478,003 | COSCO SHIPPING Holdings Co. Ltd., Class H (Industrials) | 515,321 | ||||||
| 471,852 | CRRC Corp. Ltd., Class A (Industrials) | 417,809 | ||||||
| 385,301 | CRRC Corp. Ltd., Class H (Industrials) | 198,832 | ||||||
| 81,888 | CSPC Innovation Pharmaceutical Co. Ltd., Class A (Health Care) | 389,026 | ||||||
| 2,176,156 | CSPC Pharmaceutical Group Ltd. (Health Care) | 1,701,164 | ||||||
| 408,555 | Daqin Railway Co. Ltd., Class A (Industrials) | 423,000 | ||||||
| Shares |
Description | Value | ||||||
| Common Stocks – (continued) |
| |||||||
| China – (continued) | ||||||||
| 92,026 | DaShenLin Pharmaceutical Group Co. Ltd., Class A (Consumer Staples) | $ | 303,848 | |||||
| 62,497 | Dong-E-E-Jiao Co. Ltd., Class A (Health Care) | 503,862 | ||||||
| 851,519 | Dongfeng Motor Group Co. Ltd., Class H (Consumer Discretionary) | 364,371 | ||||||
| 320,262 | Dongxing Securities Co. Ltd., Class A (Financials) | 377,367 | ||||||
| 135,732 | East Buy Holding Ltd. (Consumer Discretionary)*(a) | 419,568 | ||||||
| 79,230 | Ecovacs Robotics Co. Ltd., Class A (Consumer Discretionary) | 410,486 | ||||||
| 33,980 | ENN Energy Holdings Ltd. (Utilities) | 279,304 | ||||||
| 175,148 | ENN Natural Gas Co. Ltd., Class A (Utilities) | 455,296 | ||||||
| 407,278 | Fangda Carbon New Material Co. Ltd., Class A (Industrials)* | 278,669 | ||||||
| 449,102 | Far East Horizon Ltd. (Financials) | 360,828 | ||||||
| 428,021 | First Capital Securities Co. Ltd., Class A (Financials) | 340,385 | ||||||
| 251,613 | Foxconn Industrial Internet Co. Ltd., Class A (Information Technology) | 652,670 | ||||||
| 62,091 | Fuyao Glass Industry Group Co. Ltd., Class A (Consumer Discretionary) | 373,050 | ||||||
| 572,727 | Geely Automobile Holdings Ltd. (Consumer Discretionary) | 626,219 | ||||||
| 423,174 | GEM Co. Ltd., Class A (Materials) | 314,800 | ||||||
| 119,407 | GF Securities Co. Ltd., Class A (Financials) | 234,994 | ||||||
| 281,774 | Goldwind Science & Technology Co. Ltd., Class A (Industrials) | 298,776 | ||||||
| 74,890 | Gree Electric Appliances, Inc. of Zhuhai, Class A (Consumer Discretionary) | 405,878 | ||||||
| 51,568 | Guangdong Haid Group Co. Ltd., Class A (Consumer Staples) | 308,610 | ||||||
| 259,436 | Guangzhou Automobile Group Co. Ltd., Class A (Consumer Discretionary) | 320,818 | ||||||
| 158,661 | Guangzhou Baiyunshan Pharmaceutical Holdings Co. Ltd., Class A (Health Care) | 651,357 | ||||||
| 51,112 | Guangzhou Kingmed Diagnostics Group Co. Ltd., Class A (Health Care) | 427,751 | ||||||
| 249,815 | Guosen Securities Co. Ltd., Class A (Financials) | 298,866 | ||||||
| 30 | The accompanying notes are an integral part of these financial statements. |
GOLDMAN SACHS ACTIVEBETA® EMERGING MARKETS EQUITY ETF
| Shares |
Description | Value | ||||||
| Common Stocks – (continued) |
| |||||||
| China – (continued) | ||||||||
| 180,160 | Guotai Junan Securities Co. Ltd., Class A (Financials) | $ | 377,310 | |||||
| 381,654 | Guoyuan Securities Co. Ltd., Class A (Financials) | 369,723 | ||||||
| 637,829 | Haidilao International Holding Ltd. (Consumer Discretionary)(a) | 1,168,310 | ||||||
| 216,479 | Haier Smart Home Co. Ltd., Class A (Consumer Discretionary) | 723,775 | ||||||
| 430,218 | Haier Smart Home Co. Ltd., Class H (Consumer Discretionary) | 1,313,383 | ||||||
| 272,120 | Haitong Securities Co. Ltd., Class A (Financials) | 345,190 | ||||||
| 514,672 | Haitong Securities Co. Ltd., Class H (Financials) | 255,732 | ||||||
| 219,684 | Hangzhou Binjiang Real Estate Group Co. Ltd., Class A (Real Estate) | 230,500 | ||||||
| 73,673 | Hangzhou Robam Appliances Co. Ltd., Class A (Consumer Discretionary) | 255,623 | ||||||
| 206,229 | Heilongjiang Agriculture Co. Ltd., Class A (Consumer Staples) | 355,772 | ||||||
| 101,863 | Henan Shuanghui Investment & Development Co. Ltd., Class A (Consumer Staples) | 413,093 | ||||||
| 74,853 | Hengan International Group Co. Ltd. (Consumer Staples) | 231,382 | ||||||
| 422,902 | Hengyi Petrochemical Co. Ltd., Class A (Materials)* | 406,160 | ||||||
| 1,219,242 | Hesteel Co. Ltd., Class A (Materials) | 368,890 | ||||||
| 108,670 | Hisense Visual Technology Co. Ltd., Class A (Consumer Discretionary) | 390,625 | ||||||
| 49,025 | Hithink RoyalFlush Information Network Co. Ltd., Class A (Financials) | 932,633 | ||||||
| 112,923 | Huadong Medicine Co. Ltd., Class A (Health Care) | 527,844 | ||||||
| 376,817 | Huafon Chemical Co. Ltd., Class A (Materials) | 356,669 | ||||||
| 261,393 | Huaibei Mining Holdings Co. Ltd., Class A (Materials) | 687,471 | ||||||
| 189,642 | Huatai Securities Co. Ltd., Class A (Financials) | 382,692 | ||||||
| 330,395 | Huatai Securities Co. Ltd., Class H (Financials)(a) | 390,795 | ||||||
| 1,329,585 | Huaxia Bank Co. Ltd., Class A (Financials) | 1,169,920 | ||||||
| 171,864 | Huayu Automotive Systems Co. Ltd., Class A (Consumer Discretionary) | 416,705 | ||||||
| 144,846 | Hubei Jumpcan Pharmaceutical Co. Ltd., Class A (Health Care) | 743,805 | ||||||
| Shares |
Description | Value | ||||||
| Common Stocks – (continued) |
| |||||||
| China – (continued) | ||||||||
| 1,826,766 | Industrial & Commercial Bank of China Ltd., Class A (Financials) | $ | 1,351,329 | |||||
| 6,166,599 | Industrial & Commercial Bank of China Ltd., Class H (Financials) | 3,182,232 | ||||||
| 415,666 | Industrial Bank Co. Ltd., Class A (Financials) | 960,527 | ||||||
| 1,477,395 | Inner Mongolia BaoTou Steel Union Co. Ltd., Class A (Materials)* | 315,768 | ||||||
| 190,150 | Inner Mongolia Dian Tou Energy Corp. Ltd., Class A (Energy) | 437,818 | ||||||
| 100,956 | Inner Mongolia Yili Industrial Group Co. Ltd., Class A (Consumer Staples) | 397,225 | ||||||
| 127,662 | iQIYI, Inc. ADR (Communication Services)* | 471,073 | ||||||
| 191,600 | JCET Group Co. Ltd., Class A (Information Technology) | 695,639 | ||||||
| 52,967 | JD Health International, Inc. (Consumer Staples)*(a) | 201,617 | ||||||
| 205,946 | JD.com, Inc., Class A (Consumer Discretionary) | 2,342,567 | ||||||
| 410,613 | Jiangsu Expressway Co. Ltd., Class H (Industrials) | 422,215 | ||||||
| 248,484 | Jiangsu Hengrui Pharmaceuticals Co. Ltd., Class A (Health Care) | 1,470,505 | ||||||
| 58,340 | Jiangsu Pacific Quartz Co. Ltd., Class A (Information Technology) | 647,183 | ||||||
| 184,105 | Jiangxi Copper Co. Ltd., Class A (Materials) | 500,554 | ||||||
| 317,893 | Jiangxi Copper Co. Ltd., Class H (Materials) | 473,461 | ||||||
| 24,797 | JiuGui Liquor Co. Ltd., Class A (Consumer Staples) | 210,449 | ||||||
| 217,579 | Joincare Pharmaceutical Group Industry Co. Ltd., Class A (Health Care) | 364,783 | ||||||
| 631,211 | Jointown Pharmaceutical Group Co. Ltd., Class A (Health Care) | 713,099 | ||||||
| 294,073 | Kingboard Holdings Ltd. (Information Technology) | 577,719 | ||||||
| 335,016 | Kingnet Network Co. Ltd., Class A (Communication Services) | 581,201 | ||||||
| 97,185 | Kingsoft Corp. Ltd. (Communication Services) | 271,241 | ||||||
| 255,503 | Kuaishou Technology (Communication Services)*(a) | 1,452,315 | ||||||
| 9,448 | Kweichow Moutai Co. Ltd., Class A (Consumer Staples) | 2,222,596 | ||||||
| 1,841,639 | Lenovo Group Ltd. (Information Technology) | 2,039,522 | ||||||
| The accompanying notes are an integral part of these financial statements. | 31 |
GOLDMAN SACHS ACTIVEBETA® EMERGING MARKETS EQUITY ETF
|
Schedule of Investments (continued)
February 29, 2024 (Unaudited) |
| Shares |
Description | Value | ||||||
| Common Stocks – (continued) |
| |||||||
| China – (continued) |
| |||||||
| 72,001 | Li Auto, Inc., Class A (Consumer Discretionary)* | $ | 1,630,617 | |||||
| 257,180 | Li Ning Co. Ltd. (Consumer Discretionary) | 641,242 | ||||||
| 1,502,219 | Liaoning Port Co. Ltd., Class A (Industrials) | 308,564 | ||||||
| 150,647 | Longfor Group Holdings Ltd. (Real Estate)(a) | 190,118 | ||||||
| 181,664 | LONGi Green Energy Technology Co. Ltd., Class A (Information Technology) | 535,518 | ||||||
| 15,365 | Luzhou Laojiao Co. Ltd., Class A (Consumer Staples) | 374,782 | ||||||
| 428,903 | Meituan, Class B (Consumer Discretionary)*(a) | 4,371,865 | ||||||
| 651,478 | Metallurgical Corp. of China Ltd., Class A (Industrials) | 301,089 | ||||||
| 41,917 | Muyuan Foods Co. Ltd., Class A (Consumer Staples) | 223,918 | ||||||
| 196,521 | NetEase, Inc. (Communication Services) | 4,423,028 | ||||||
| 75,069 | New China Life Insurance Co. Ltd., Class A (Financials) | 341,732 | ||||||
| 163,259 | New China Life Insurance Co. Ltd., Class H (Financials) | 314,473 | ||||||
| 456,541 | New Hope Liuhe Co. Ltd., Class A (Consumer Staples)* | 561,390 | ||||||
| 253,175 | New Oriental Education & Technology Group, Inc. (Consumer Discretionary)* | 2,401,165 | ||||||
| 315,014 | Nongfu Spring Co. Ltd., Class H (Consumer Staples)(a) | 1,786,560 | ||||||
| 700,640 | Offshore Oil Engineering Co. Ltd., Class A (Energy) | 601,917 | ||||||
| 272,394 | OFILM Group Co. Ltd., Class A (Information Technology)* | 308,488 | ||||||
| 338,281 | Oriental Pearl Group Co. Ltd., Class A (Communication Services) | 347,424 | ||||||
| 55,508 | PDD Holdings, Inc. ADR (Consumer Discretionary)* | 6,912,966 | ||||||
| 505,677 | People’s Insurance Co. Group of China Ltd. (The), Class A (Financials) | 368,454 | ||||||
| 2,287,684 | People’s Insurance Co. Group of China Ltd. (The), Class H (Financials) | 762,678 | ||||||
| 2,115,523 | PetroChina Co. Ltd., Class A (Energy) | 2,595,500 | ||||||
| 4,352,190 | PetroChina Co. Ltd., Class H (Energy) | 3,430,029 | ||||||
| 1,535,339 | PICC Property & Casualty Co. Ltd., Class H (Financials) | 2,102,344 | ||||||
| 198,100 | Ping An Bank Co. Ltd., Class A (Financials) | 291,160 | ||||||
| 118,187 | Ping An Insurance Group Co. of China Ltd., Class A (Financials) | 703,684 | ||||||
| Shares |
Description | Value | ||||||
| Common Stocks – (continued) |
| |||||||
| China – (continued) |
| |||||||
| 397,995 | Ping An Insurance Group Co. of China Ltd., Class H (Financials) | $ | 1,784,389 | |||||
| 1,337,413 | Postal Savings Bank of China Co. Ltd., Class A (Financials) | 900,240 | ||||||
| 1,289,200 | Postal Savings Bank of China Co. Ltd., Class H (Financials)(a) | 680,104 | ||||||
| 56,997 | Qifu Technology, Inc. ADR (Financials) | 880,604 | ||||||
| 259,490 | Qinghai Salt Lake Industry Co. Ltd., Class A (Materials)* | 581,626 | ||||||
| 194,617 | SAIC Motor Corp. Ltd., Class A (Consumer Discretionary) | 404,076 | ||||||
| 32,046 | Sangfor Technologies, Inc., Class A (Information Technology)* | 281,977 | ||||||
| 447,560 | SDIC Capital Co. Ltd., Class A (Financials) | 428,599 | ||||||
| 203,305 | SDIC Power Holdings Co. Ltd., Class A (Utilities) | 406,596 | ||||||
| 169,817 | Seazen Holdings Co. Ltd., Class A (Real Estate)* | 245,348 | ||||||
| 27,146 | SG Micro Corp., Class A (Information Technology) | 266,515 | ||||||
| 125,743 | Shaanxi Coal Industry Co. Ltd., Class A (Energy) | 450,251 | ||||||
| 170,185 | Shandong Gold Mining Co. Ltd., Class A (Materials) | 512,309 | ||||||
| 988,126 | Shanghai Construction Group Co. Ltd., Class A (Industrials) | 335,992 | ||||||
| 599,823 | Shanghai Electric Group Co. Ltd., Class A (Industrials)* | 352,972 | ||||||
| 649,281 | Shanghai International Port Group Co. Ltd., Class A (Industrials) | 489,309 | ||||||
| 174,524 | Shanghai Lingang Holdings Corp. Ltd., Class A (Real Estate) | 258,931 | ||||||
| 194,560 | Shanghai Pharmaceuticals Holding Co. Ltd., Class A (Health Care) | 489,556 | ||||||
| 970,007 | Shanghai Pudong Development Bank Co. Ltd., Class A (Financials) | 962,569 | ||||||
| 420,684 | Shanghai RAAS Blood Products Co. Ltd., Class A (Health Care) | 420,377 | ||||||
| 463,490 | Shanghai Rural Commercial Bank Co. Ltd., Class A (Financials) | 414,907 | ||||||
| 309,712 | Shanghai Yuyuan Tourist Mart Group Co. Ltd., Class A (Consumer Discretionary) | 284,126 | ||||||
| 781,822 | Shanxi Taigang Stainless Steel Co. Ltd., Class A (Materials) | 411,243 | ||||||
| 26,669 | Shanxi Xinghuacun Fen Wine Factory Co. Ltd., Class A (Consumer Staples) | 862,632 | ||||||
| 661,731 | Shenwan Hongyuan Group Co. Ltd., Class A (Financials) | 420,628 | ||||||
| 32 | The accompanying notes are an integral part of these financial statements. |
GOLDMAN SACHS ACTIVEBETA® EMERGING MARKETS EQUITY ETF
| Shares |
Description | Value | ||||||
| Common Stocks – (continued) |
| |||||||
| China – (continued) |
| |||||||
| 385,102 | Shenzhen Energy Group Co. Ltd., Class A (Utilities) | $ | 352,218 | |||||
| 14,472 | Shenzhen Mindray Bio-Medical Electronics Co. Ltd., Class A (Health Care) | 580,828 | ||||||
| 663,705 | Shenzhen Overseas Chinese Town Co. Ltd., Class A (Real Estate)* | 282,790 | ||||||
| 56,203 | Shenzhen SC New Energy Technology Corp., Class A (Information Technology) | 505,068 | ||||||
| 85,265 | Shenzhen SED Industry Co. Ltd., Class A (Industrials) | 233,953 | ||||||
| 201,284 | Shijiazhuang Yiling Pharmaceutical Co. Ltd., Class A (Health Care) | 599,501 | ||||||
| 441,580 | Sichuan Changhong Electric Co. Ltd., Class A (Consumer Discretionary) | 315,009 | ||||||
| 165,667 | Sichuan Chuantou Energy Co. Ltd., Class A (Utilities) | 360,063 | ||||||
| 196,024 | Sichuan Kelun Pharmaceutical Co. Ltd., Class A (Health Care) | 746,797 | ||||||
| 328,093 | Sichuan Road and Bridge Group Co. Ltd., Class A (Industrials) | 371,568 | ||||||
| 73,665 | Sichuan Swellfun Co. Ltd., Class A (Consumer Staples) | 513,439 | ||||||
| 20,749 | Silergy Corp. (Information Technology) | 273,726 | ||||||
| 209,262 | Sinoma International Engineering Co., Class A (Industrials) | 326,153 | ||||||
| 237,612 | Sinopharm Group Co. Ltd., Class H (Health Care) | 666,205 | ||||||
| 356,094 | SooChow Securities Co. Ltd., Class A (Financials) | 360,777 | ||||||
| 33,743 | Sunny Optical Technology Group Co. Ltd. (Information Technology) | 218,954 | ||||||
| 69,634 | TAL Education Group ADR (Consumer Discretionary)* | 1,025,709 | ||||||
| 639,688 | TCL Technology Group Corp., Class A (Information Technology)* | 402,177 | ||||||
| 734,965 | Tencent Holdings Ltd. (Communication Services) | 26,023,439 | ||||||
| 128,533 | Tencent Music Entertainment Group ADR (Communication Services)* | 1,345,740 | ||||||
| 117,705 | Tianqi Lithium Corp., Class A (Materials) | 876,100 | ||||||
| 1,053,799 | Tingyi Cayman Islands Holding Corp. (Consumer Staples) | 1,175,105 | ||||||
| 215,850 | Tongwei Co. Ltd., Class A (Information Technology) | 793,869 | ||||||
| 1,918,502 | Topsports International Holdings Ltd. (Consumer Discretionary)(a) | 1,303,703 | ||||||
| Shares |
Description | Value | ||||||
| Common Stocks – (continued) |
| |||||||
| China – (continued) |
| |||||||
| 17,971 | Trip.com Group Ltd. (Consumer Discretionary)* | $ | 819,034 | |||||
| 172,297 | Vipshop Holdings Ltd. ADR (Consumer Discretionary)* | 3,316,717 | ||||||
| 28,207 | Wanhua Chemical Group Co. Ltd., Class A (Materials) | 311,421 | ||||||
| 1,705,152 | Want Want China Holdings Ltd. (Consumer Staples) | 940,918 | ||||||
| 364,942 | Western Securities Co. Ltd., Class A (Financials) | 403,676 | ||||||
| 1,699,499 | Wintime Energy Group Co. Ltd., Class A (Utilities)* | 325,500 | ||||||
| 838,575 | Wuchan Zhongda Group Co. Ltd., Class A (Consumer Discretionary) | 535,366 | ||||||
| 27,075 | Wuliangye Yibin Co. Ltd., Class A (Consumer Staples) | 534,529 | ||||||
| 118,533 | Wuxi Biologics Cayman, Inc. (Health Care)*(a) | 288,278 | ||||||
| 385,649 | Xiamen C & D, Inc., Class A (Industrials) | 557,178 | ||||||
| 942,664 | Xiaomi Corp., Class B (Information Technology)*(a) | 1,591,817 | ||||||
| 262,446 | Yadea Group Holdings Ltd. (Consumer Discretionary)(a) | 411,664 | ||||||
| 352,580 | Yankuang Energy Group Co. Ltd., Class H (Energy) | 814,256 | ||||||
| 75,123 | Yihai Kerry Arawana Holdings Co. Ltd., Class A (Consumer Staples) | 337,182 | ||||||
| 65,034 | YongXing Special Materials Technology Co. Ltd., Class A (Materials) | 498,140 | ||||||
| 424,044 | Youngor Fashion Co. Ltd., Class A (Real Estate) | 432,563 | ||||||
| 129,197 | YTO Express Group Co. Ltd., Class A (Industrials) | 228,620 | ||||||
| 667,555 | Yuexiu Property Co. Ltd. (Real Estate) | 445,958 | ||||||
| 58,059 | Yum China Holdings, Inc. (Consumer Discretionary) | 2,490,151 | ||||||
| 46,944 | Yunnan Baiyao Group Co. Ltd., Class A (Health Care) | 324,655 | ||||||
| 58,892 | Yunnan Botanee Bio- Technology Group Co. Ltd., Class A (Consumer Staples) | 535,854 | ||||||
| 159,335 | Yunnan Yuntianhua Co. Ltd., Class A (Materials) | 403,355 | ||||||
| 214,277 | Yutong Bus Co. Ltd., Class A (Industrials) | 555,227 | ||||||
| 135,629 | Zangge Mining Co. Ltd., Class A (Materials) | 551,344 | ||||||
| 8,374 | Zhangzhou Pientzehuang Pharmaceutical Co. Ltd., Class A (Health Care) | 259,172 | ||||||
| 324,784 | Zhejiang China Commodities City Group Co. Ltd., Class A (Consumer Discretionary) | 370,525 | ||||||
| The accompanying notes are an integral part of these financial statements. | 33 |
GOLDMAN SACHS ACTIVEBETA® EMERGING MARKETS EQUITY ETF
|
Schedule of Investments (continued)
February 29, 2024 (Unaudited) |
| Shares |
Description | Value | ||||||
| Common Stocks – (continued) |
| |||||||
| China – (continued) |
| |||||||
| 798,281 | Zhejiang Expressway Co. Ltd., Class H (Industrials) | $ | 609,764 | |||||
| 274,703 | Zhejiang Longsheng Group Co. Ltd., Class A (Materials) | 326,353 | ||||||
| 153,670 | Zhejiang NHU Co. Ltd., Class A (Health Care) | 383,895 | ||||||
| 63,427 | Zhejiang Supor Co. Ltd., Class A (Consumer Discretionary) | 486,624 | ||||||
| 257,051 | Zhejiang Weixing New Building Materials Co. Ltd., Class A (Industrials) | 561,889 | ||||||
| 249,288 | Zheshang Securities Co. Ltd., Class A (Financials) | 354,285 | ||||||
| 26,107 | Zhongji Innolight Co. Ltd., Class A (Information Technology) | 562,196 | ||||||
| 306,727 | Zhongjin Gold Corp. Ltd., Class A (Materials) | 443,579 | ||||||
| 150,026 | Zhongsheng Group Holdings Ltd. (Consumer Discretionary) | 275,186 | ||||||
| 341,967 | Zhongtai Securities Co. Ltd., Class A (Financials) | 329,853 | ||||||
| 175,711 | Zijin Mining Group Co. Ltd., Class H (Materials) | 284,143 | ||||||
| 434,008 | Zoomlion Heavy Industry Science and Technology Co. Ltd., Class A (Industrials) | 481,880 | ||||||
| 127,814 | ZTE Corp., Class H (Information Technology) | 288,319 | ||||||
| 13,032 | ZTO Express Cayman, Inc. ADR (Industrials) | 250,084 | ||||||
|
|
|
|||||||
| 257,970,257 | ||||||||
|
|
||||||||
| Czech Republic – 0.2% |
| |||||||
| 13,473 | CEZ AS (Utilities) | 461,479 | ||||||
| 18,771 | Komercni banka AS (Financials) | 654,987 | ||||||
| 152,339 | Moneta Money Bank AS (Financials)(a) | 670,971 | ||||||
|
|
|
|||||||
| 1,787,437 | ||||||||
|
|
||||||||
| Egypt – 0.3% |
| |||||||
| 1,421,159 | Commercial International Bank - Egypt (CIB) (Financials) | 1,992,538 | ||||||
| 1,779,689 | Eastern Co. SAE (Consumer Staples) | 1,234,636 | ||||||
|
|
|
|||||||
| 3,227,174 | ||||||||
|
|
||||||||
| Greece – 0.8% |
| |||||||
| 565,762 | Eurobank Ergasias Services and Holdings SA (Financials)* | 1,170,296 | ||||||
| 173,701 | Hellenic Telecommunications Organization SA (Communication Services) | 2,624,070 | ||||||
| 18,708 | JUMBO SA (Consumer Discretionary) | 547,421 | ||||||
| 14,182 | Motor Oil Hellas Corinth Refineries SA (Energy) | 405,162 | ||||||
| 24,205 | Mytilineos SA (Industrials) | 942,964 | ||||||
| Shares |
Description | Value | ||||||
| Common Stocks – (continued) |
| |||||||
| Greece – (continued) |
| |||||||
| 75,677 | National Bank of Greece SA (Financials)* | $ | 593,239 | |||||
| 86,525 | OPAP SA (Consumer Discretionary) | 1,579,590 | ||||||
|
|
|
|||||||
| 7,862,742 | ||||||||
|
|
||||||||
| Hong Kong – 0.2% |
| |||||||
| 48,285 | Orient Overseas International Ltd. (Industrials) | 750,599 | ||||||
| 2,340,967 | Sino Biopharmaceutical Ltd. (Health Care) | 935,932 | ||||||
|
|
|
|||||||
| 1,686,531 | ||||||||
|
|
||||||||
| Hungary – 0.2% |
| |||||||
| 128,210 | MOL Hungarian Oil & Gas PLC (Energy) | 1,019,685 | ||||||
| 15,975 | OTP Bank Nyrt (Financials) | 765,616 | ||||||
| 15,462 | Richter Gedeon Nyrt (Health Care) | 411,470 | ||||||
|
|
|
|||||||
| 2,196,771 | ||||||||
|
|
||||||||
| India – 17.2% |
| |||||||
| 7,630 | ABB India Ltd. (Industrials) | 501,047 | ||||||
| 210,893 | Adani Power Ltd. (Utilities)* | 1,398,768 | ||||||
| 6,420 | Apollo Hospitals Enterprise Ltd. (Health Care) | 472,432 | ||||||
| 51,491 | Asian Paints Ltd. (Materials) | 1,752,400 | ||||||
| 121,194 | Aurobindo Pharma Ltd. (Health Care) | 1,502,716 | ||||||
| 20,209 | Avenue Supermarts Ltd. (Consumer Staples)*(a) | 955,145 | ||||||
| 159,870 | Axis Bank Ltd. (Financials) | 2,072,890 | ||||||
| 5,075 | Bajaj Auto Ltd. (Consumer Discretionary) | 484,102 | ||||||
| 16,300 | Bajaj Finance Ltd. (Financials) | 1,276,881 | ||||||
| 19,570 | Bajaj Finserv Ltd. (Financials) | 376,171 | ||||||
| 313,774 | Bank of Baroda (Financials) | 1,004,523 | ||||||
| 77,376 | Berger Paints India Ltd. (Materials) | 566,162 | ||||||
| 294,712 | Bharat Electronics Ltd. (Industrials) | 728,994 | ||||||
| 118,525 | Bharat Petroleum Corp. Ltd. (Energy) | 863,176 | ||||||
| 159,277 | Bharti Airtel Ltd. (Communication Services) | 2,157,886 | ||||||
| 48,727 | Britannia Industries Ltd. (Consumer Staples) | 2,917,876 | ||||||
| 146,732 | CG Power & Industrial Solutions Ltd. (Industrials) | 784,393 | ||||||
| 37,061 | Cholamandalam Investment and Finance Co. Ltd. (Financials) | 486,839 | ||||||
| 162,748 | Cipla Ltd. (Health Care) | 2,905,631 | ||||||
| 191,426 | Coal India Ltd. (Energy) | 1,008,195 | ||||||
| 94,603 | Colgate-Palmolive India Ltd. (Consumer Staples) | 2,882,886 | ||||||
| 192,152 | Dabur India Ltd. (Consumer Staples) | 1,247,121 | ||||||
| 12,035 | Divi’s Laboratories Ltd. (Health Care) | 506,387 | ||||||
| 34 | The accompanying notes are an integral part of these financial statements. |
GOLDMAN SACHS ACTIVEBETA® EMERGING MARKETS EQUITY ETF
| Shares |
Description | Value | ||||||
| Common Stocks – (continued) |
| |||||||
| India – (continued) |
| |||||||
| 48,256 | DLF Ltd. (Real Estate) | $ | 524,485 | |||||
| 30,534 | Dr. Reddy’s Laboratories Ltd. (Health Care) | 2,365,737 | ||||||
| 11,610 | Eicher Motors Ltd. (Consumer Discretionary) | 531,015 | ||||||
| 362,498 | GAIL India Ltd. (Utilities) | 796,771 | ||||||
| 25,300 | Godrej Consumer Products Ltd. (Consumer Staples) | 383,758 | ||||||
| 42,620 | Grasim Industries Ltd. (Materials) | 1,126,407 | ||||||
| 83,714 | Havells India Ltd. (Industrials) | 1,546,083 | ||||||
| 267,922 | HCL Technologies Ltd. (Information Technology) | 5,376,293 | ||||||
| 14,800 | HDFC Asset Management Co. Ltd. (Financials)(a) | 669,886 | ||||||
| 161,462 | HDFC Bank Ltd. (Financials) | 2,732,827 | ||||||
| 101,187 | HDFC Life Insurance Co. Ltd. (Financials)(a) | 710,245 | ||||||
| 260,602 | Hindalco Industries Ltd. (Materials) | 1,583,578 | ||||||
| 24,849 | Hindustan Aeronautics Ltd. (Industrials) | 924,253 | ||||||
| 127,533 | Hindustan Petroleum Corp. Ltd. (Energy) | 783,505 | ||||||
| 82,341 | Hindustan Unilever Ltd. (Consumer Staples) | 2,395,564 | ||||||
| 470,534 | ICICI Bank Ltd. (Financials) | 5,971,036 | ||||||
| 43,327 | ICICI Lombard General Insurance Co. Ltd. (Financials)(a) | 894,457 | ||||||
| 141,928 | Indian Hotels Co. Ltd. (Consumer Discretionary) | 1,004,256 | ||||||
| 865,757 | Indian Oil Corp. Ltd. (Energy) | 1,728,564 | ||||||
| 410,770 | Infosys Ltd. (Information Technology) | 8,292,559 | ||||||
| 445,230 | ITC Ltd. (Consumer Staples) | 2,181,683 | ||||||
| 144,552 | Jindal Steel & Power Ltd. (Materials) | 1,353,275 | ||||||
| 261,025 | Jio Financial Services Ltd. (Financials)* | 975,897 | ||||||
| 95,825 | JSW Steel Ltd. (Materials) | 924,663 | ||||||
| 158,406 | Jubilant Foodworks Ltd. (Consumer Discretionary) | 886,250 | ||||||
| 32,508 | Kotak Mahindra Bank Ltd. (Financials) | 662,363 | ||||||
| 68,003 | Larsen & Toubro Ltd. (Industrials) | 2,852,081 | ||||||
| 41,045 | LTIMindtree Ltd. (Information Technology)(a) | 2,624,014 | ||||||
| 51,233 | Lupin Ltd. (Health Care) | 1,001,628 | ||||||
| 87,503 | Mahindra & Mahindra Ltd. (Consumer Discretionary) | 2,039,296 | ||||||
| 317,881 | Marico Ltd. (Consumer Staples) | 2,003,523 | ||||||
| 8,239 | Maruti Suzuki India Ltd. (Consumer Discretionary) | 1,121,671 | ||||||
| 42,532 | Mphasis Ltd. (Information Technology) | 1,342,573 | ||||||
| 382 | MRF Ltd. (Consumer Discretionary) | 673,006 | ||||||
| Shares |
Description | Value | ||||||
| Common Stocks – (continued) |
| |||||||
| India – (continued) |
| |||||||
| 56,139 | Muthoot Finance Ltd. (Financials) | $ | 882,713 | |||||
| 94,700 | Nestle India Ltd. (Consumer Staples) | 2,965,162 | ||||||
| 334,800 | NMDC Ltd. (Materials) | 912,141 | ||||||
| 611,199 | NTPC Ltd. (Utilities) | 2,473,802 | ||||||
| 552,254 | Oil & Natural Gas Corp. Ltd. (Energy) | 1,762,337 | ||||||
| 4,202 | Page Industries Ltd. (Consumer Discretionary) | 1,738,727 | ||||||
| 13,641 | Persistent Systems Ltd. (Information Technology) | 1,419,825 | ||||||
| 8,665 | PI Industries Ltd. (Materials) | 383,808 | ||||||
| 47,725 | Pidilite Industries Ltd. (Materials) | 1,574,789 | ||||||
| 10,248 | Polycab India Ltd. (Industrials) | 587,056 | ||||||
| 330,330 | Power Finance Corp. Ltd. (Financials) | 1,596,348 | ||||||
| 841,729 | Power Grid Corp. of India Ltd. (Utilities) | 2,871,368 | ||||||
| 247,853 | REC Ltd. (Financials) | 1,321,374 | ||||||
| 259,125 | Reliance Industries Ltd. (Energy) | 9,130,413 | ||||||
| 42,800 | SBI Cards & Payment Services Ltd. (Financials) | 371,471 | ||||||
| 45,462 | SBI Life Insurance Co. Ltd. (Financials)(a) |
851,245 | ||||||
| 20,385 | Shriram Finance Ltd. (Financials) | 599,531 | ||||||
| 29,446 | Siemens Ltd. (Industrials) | 1,661,739 | ||||||
| 14,126 | SRF Ltd. (Materials) | 407,112 | ||||||
| 204,685 | State Bank of India (Financials) | 1,846,741 | ||||||
| 76,663 | Sun Pharmaceutical Industries Ltd. (Health Care) | 1,458,947 | ||||||
| 7,374 | Supreme Industries Ltd. (Materials) | 369,126 | ||||||
| 747,774 | Suzlon Energy Ltd. (Industrials)* | 408,084 | ||||||
| 27,100 | Tata Communications Ltd. (Communication Services) | 628,571 | ||||||
| 142,199 | Tata Consultancy Services Ltd. (Information Technology) | 7,022,979 | ||||||
| 74,364 | Tata Consumer Products Ltd. (Consumer Staples) | 1,067,304 | ||||||
| 16,512 | Tata Elxsi Ltd. (Information Technology) | 1,555,498 | ||||||
| 335,987 | Tata Motors Ltd. (Consumer Discretionary) | 3,850,329 | ||||||
| 169,850 | Tata Motors Ltd., Class A (Consumer Discretionary) | 1,295,134 | ||||||
| 151,102 | Tata Power Co. Ltd. (The) (Utilities) | 677,457 | ||||||
| 1,374,132 | Tata Steel Ltd. (Materials) | 2,334,241 | ||||||
| 201,601 | Tech Mahindra Ltd. (Information Technology) | 3,097,215 | ||||||
| 23,082 | Titan Co. Ltd. (Consumer Discretionary) | 1,008,951 | ||||||
| The accompanying notes are an integral part of these financial statements. | 35 |
GOLDMAN SACHS ACTIVEBETA® EMERGING MARKETS EQUITY ETF
|
Schedule of Investments (continued)
February 29, 2024 (Unaudited) |
| Shares |
Description | Value | ||||||
| Common Stocks – (continued) |
| |||||||
| India – (continued) |
| |||||||
| 66,155 | Torrent Pharmaceuticals Ltd. (Health Care) | $ | 2,127,157 | |||||
| 11,487 | Trent Ltd. (Consumer Discretionary) | 537,774 | ||||||
| 20,292 | Tube Investments of India Ltd. (Consumer Discretionary) | 853,773 | ||||||
| 26,977 | TVS Motor Co. Ltd. (Consumer Discretionary)* | 695,994 | ||||||
| 16,366 | UltraTech Cement Ltd. (Materials) | 1,952,561 | ||||||
| 27,200 | United Spirits Ltd. (Consumer Staples) | 382,448 | ||||||
| 90,020 | UPL Ltd. (Materials) | 509,941 | ||||||
| 108,843 | Varun Beverages Ltd. (Consumer Staples) | 1,848,918 | ||||||
| 355,560 | Vedanta Ltd. (Materials) | 1,149,447 | ||||||
| 266,444 | Wipro Ltd. (Information Technology) | 1,666,475 | ||||||
| 268,088 | Zomato Ltd. (Consumer Discretionary)* | 534,939 | ||||||
|
|
|
|||||||
| 162,226,788 | ||||||||
|
|
||||||||
| Indonesia – 1.9% |
| |||||||
| 1,784,047 | Adaro Energy Indonesia Tbk PT (Energy) | 274,731 | ||||||
| 4,872,030 | Aneka Tambang Tbk (Materials) | 452,635 | ||||||
| 3,108,771 | Astra International Tbk PT (Industrials) | 1,033,619 | ||||||
| 3,830,256 | Bank Central Asia Tbk PT (Financials) | 2,406,858 | ||||||
| 2,889,561 | Bank Mandiri Persero Tbk PT (Financials) | 1,287,110 | ||||||
| 2,714,736 | Bank Negara Indonesia Persero Tbk PT (Financials) | 1,036,489 | ||||||
| 4,046,814 | Bank Rakyat Indonesia Persero Tbk PT (Financials) | 1,577,266 | ||||||
| 906,467 | Indah Kiat Pulp & Paper Tbk PT (Materials) | 503,272 | ||||||
| 2,114,185 | Indofood CBP Sukses Makmur Tbk PT (Consumer Staples) | 1,553,855 | ||||||
| 3,466,071 | Indofood Sukses Makmur Tbk PT (Consumer Staples) | 1,461,198 | ||||||
| 11,406,541 | Kalbe Farma Tbk PT (Health Care) | 1,081,498 | ||||||
| 6,579,435 | Sumber Alfaria Trijaya Tbk PT (Consumer Staples) | 1,151,349 | ||||||
| 10,136,410 | Telkom Indonesia Persero Tbk PT (Communication Services) | 2,580,060 | ||||||
| 6,076,989 | Unilever Indonesia Tbk PT (Consumer Staples) | 1,055,691 | ||||||
|
|
|
|||||||
| 17,455,631 | ||||||||
|
|
||||||||
| Kuwait – 0.6% |
| |||||||
| 312,135 | Agility Public Warehousing Co. KSC (Industrials)* | 609,761 | ||||||
| 201,735 | Boubyan Bank KSCP (Financials) | 421,634 | ||||||
| 590,729 | Kuwait Finance House KSCP (Financials) | 1,555,308 | ||||||
| Shares |
Description | Value | ||||||
| Common Stocks – (continued) |
| |||||||
| Kuwait – (continued) |
| |||||||
| 871,804 | National Bank of Kuwait SAKP (Financials) | $ | 2,777,078 | |||||
|
|
|
|||||||
| 5,363,781 | ||||||||
|
|
||||||||
| Luxembourg – 0.1% |
| |||||||
| 40,574 | Reinet Investments SCA (Financials) | 1,023,754 | ||||||
|
|
||||||||
| Mexico – 2.6% |
| |||||||
| 807,226 | Alfa SAB de CV, Class A (Industrials) | 601,169 | ||||||
| 2,810,955 | America Movil SAB de CV, Series B (Communication Services) | 2,628,708 | ||||||
| 51,098 | Arca Continental SAB de CV (Consumer Staples) | 549,738 | ||||||
| 107,500 | Banco del Bajio SA (Financials)(a) | 399,539 | ||||||
| 2,536,919 | Cemex SAB de CV, Series CPO (Materials)* | 1,936,897 | ||||||
| 103,936 | Coca-Cola Femsa SAB de CV (Consumer Staples) | 1,013,142 | ||||||
| 327,661 | Fomento Economico Mexicano SAB de CV (Consumer Staples) | 4,086,139 | ||||||
| 130,813 | Gruma SAB de CV, Class B (Consumer Staples) | 2,326,527 | ||||||
| 461,124 | Grupo Bimbo SAB de CV, Series A (Consumer Staples) | 1,926,472 | ||||||
| 75,231 | Grupo Carso SAB de CV, Series A1 (Industrials) | 650,020 | ||||||
| 317,108 | Grupo Financiero Banorte SAB de CV, Class O (Financials) | 3,274,296 | ||||||
| 246,110 | Grupo Mexico SAB de CV, Series B (Materials) | 1,193,164 | ||||||
| 241,373 | Kimberly-Clark de Mexico SAB de CV, Class A (Consumer Staples) | 535,740 | ||||||
| 216,057 | Orbia Advance Corp. SAB de CV (Materials) | 399,034 | ||||||
| 40,958 | Promotora y Operadora de Infraestructura SAB de CV (Industrials) | 425,119 | ||||||
| 4,800 | Southern Copper Corp. (Materials) | 388,128 | ||||||
| 744,807 | Wal-Mart de Mexico SAB de CV (Consumer Staples) | 2,978,530 | ||||||
|
|
|
|||||||
| 25,312,362 | ||||||||
|
|
||||||||
| Philippines – 0.1% |
| |||||||
| 442,034 | Bank of the Philippine Islands (Financials) | 983,696 | ||||||
| 38,170 | Manila Electric Co. (Utilities) | 264,810 | ||||||
|
|
|
|||||||
| 1,248,506 | ||||||||
|
|
||||||||
| Poland – 1.2% |
| |||||||
| 32,139 | Bank Pekao SA (Financials) | 1,394,229 | ||||||
| 14,680 | CD Projekt SA (Communication Services)(b) | 403,820 | ||||||
| 36 | The accompanying notes are an integral part of these financial statements. |
GOLDMAN SACHS ACTIVEBETA® EMERGING MARKETS EQUITY ETF
| Shares |
Description | Value | ||||||
| Common Stocks – (continued) |
| |||||||
| Poland – (continued) |
| |||||||
| 22,364 | Dino Polska SA (Consumer Staples)*(a) |
$ | 2,606,021 | |||||
| 503 | LPP SA (Consumer Discretionary) | 2,262,800 | ||||||
| 25,787 | ORLEN SA (Energy) | 400,782 | ||||||
| 101,966 | Powszechna Kasa Oszczednosci Bank Polski SA (Financials) | 1,420,605 | ||||||
| 184,201 | Powszechny Zaklad Ubezpieczen SA (Financials) | 2,268,390 | ||||||
| 3,156 | Santander Bank Polska SA (Financials) | 434,871 | ||||||
|
|
|
|||||||
| 11,191,518 | ||||||||
|
|
||||||||
| Qatar – 0.9% |
| |||||||
| 512,875 | Commercial Bank PSQC (The) (Financials) | 712,193 | ||||||
| 91,940 | Industries Qatar QSC (Industrials) | 325,742 | ||||||
| 655,702 | Ooredoo QPSC (Communication Services) | 2,047,606 | ||||||
| 366,678 | Qatar International Islamic Bank QSC (Financials) | 1,149,079 | ||||||
| 325,626 | Qatar Islamic Bank (Financials) | 1,802,077 | ||||||
| 688,093 | Qatar National Bank QPSC (Financials) | 2,878,236 | ||||||
|
|
|
|||||||
| 8,914,933 | ||||||||
|
|
||||||||
| Romania – 0.1% |
| |||||||
| 116,547 | NEPI Rockcastle NV (Real Estate)* | 831,405 | ||||||
|
|
||||||||
| Russia – 0.0% |
| |||||||
| 1,256,908 | Gazprom PJSC (Energy)*(c) | — | ||||||
| 35,708,229 | Inter RAO UES PJSC (Utilities)(c) | — | ||||||
| 62,206 | LUKOIL PJSC (Energy)(c) | — | ||||||
| 11,906 | MMC Norilsk Nickel PJSC (Materials)(c) | — | ||||||
| 824,628 | Moscow Exchange MICEX-RTS PJSC (Financials)(c) | — | ||||||
| 839,494 | Novolipetsk Steel PJSC (Materials)*(c) |
— | ||||||
| 820 | PhosAgro PJSC (Materials)(c) | — | ||||||
| 127,440 | PhosAgro PJSC, GDR (Materials)*(c) | — | ||||||
| 70,023 | Polymetal International PLC (Materials)*(c) | — | ||||||
| 11,287 | Polyus PJSC (Materials)*(c) | — | ||||||
| 90,086 | Rosneft Oil Co. PJSC (Energy)(c) | — | ||||||
| 1,661,273 | Sberbank of Russia PJSC (Financials)(c) |
— | ||||||
| 152,107 | Severstal PAO (Materials)*(c) | — | ||||||
| 3,362,523 | Surgutneftegas PJSC (Energy)(c) | — | ||||||
| 277,377 | Tatneft PJSC (Energy)(c) | — | ||||||
| 1,366 | TCS Group Holding PLC, GDR (Financials)*(c) | — | ||||||
| 799,132,583 | VTB Bank PJSC (Financials)*(c) | — | ||||||
| Shares |
Description | Value | ||||||
| Common Stocks – (continued) |
| |||||||
| Russia – (continued) |
| |||||||
| 40,500 | Yandex NV, Class A (Communication Services)*(c) | $ | — | |||||
|
|
|
|||||||
| — | ||||||||
|
|
||||||||
| Saudi Arabia – 4.0% |
| |||||||
| 11,627 | ACWA Power Co. (Utilities) | 818,475 | ||||||
| 31,010 | Advanced Petrochemical Co. (Materials) | 316,277 | ||||||
| 198,395 | Al Rajhi Bank (Financials) | 4,708,198 | ||||||
| 72,176 | Alinma Bank (Financials) | 845,835 | ||||||
| 28,985 | Almarai Co. JSC (Consumer Staples) | 454,448 | ||||||
| 53,756 | Arab National Bank (Financials) | 399,196 | ||||||
| 7,232 | Arabian Internet & Co.mmunications Services Co. (Information Technology) | 707,329 | ||||||
| 40,409 | Bank AlBilad (Financials) | 532,279 | ||||||
| 56,422 | Bank Al-Jazira (Financials)* | 292,769 | ||||||
| 44,097 | Banque Saudi Fransi (Financials) | 447,990 | ||||||
| 30,238 | Bupa Arabia for Cooperative Insurance Co. (Financials) | 1,851,224 | ||||||
| 129,372 | Dar Al Arkan Real Estate Development Co. (Real Estate)* | 481,570 | ||||||
| 11,023 | Dr Sulaiman Al Habib Medical Services Group Co. (Health Care) | 968,183 | ||||||
| 4,731 | Elm Co. (Information Technology) | 1,333,405 | ||||||
| 186,031 | Etihad Etisalat Co. (Communication Services) | 2,743,118 | ||||||
| 88,173 | Jarir Marketing Co. (Consumer Discretionary) | 366,300 | ||||||
| 171,864 | Mobile Telecommunications Co Saudi Arabia (Communication Services) | 682,818 | ||||||
| 31,300 | Nahdi Medical Co. (Consumer Staples) | 1,185,132 | ||||||
| 76,724 | Riyad Bank (Financials) | 636,247 | ||||||
| 29,136 | SABIC Agri-Nutrients Co. (Materials) | 972,676 | ||||||
| 101,488 | Sahara International Petrochemical Co. (Materials) | 829,429 | ||||||
| 64,028 | Saudi Arabian Mining Co. (Materials)* | 849,370 | ||||||
| 458,535 | Saudi Arabian Oil Co. (Energy)(a) | 3,875,839 | ||||||
| 104,848 | Saudi Awwal Bank (Financials) | 1,153,236 | ||||||
| 89,537 | Saudi Basic Industries Corp. (Materials) | 1,881,320 | ||||||
| 137,859 | Saudi Electricity Co. (Utilities) | 735,189 | ||||||
| 84,855 | Saudi Investment Bank (The) (Financials) | 366,092 | ||||||
| 290,381 | Saudi Kayan Petrochemical Co. (Materials)* | 747,187 | ||||||
| 277,467 | Saudi National Bank (The) (Financials) | 3,133,277 | ||||||
| 203,873 | Saudi Telecom Co. (Communication Services) | 2,307,658 | ||||||
| The accompanying notes are an integral part of these financial statements. | 37 |
GOLDMAN SACHS ACTIVEBETA® EMERGING MARKETS EQUITY ETF
|
Schedule of Investments (continued)
February 29, 2024 (Unaudited) |
| Shares |
Description | Value | ||||||
| Common Stocks – (continued) |
| |||||||
| Saudi Arabia – (continued) |
| |||||||
| 104,882 | Savola Group (The) (Consumer Staples) | $ | 1,482,214 | |||||
|
|
|
|||||||
| 38,104,280 | ||||||||
|
|
||||||||
| South Africa – 2.8% |
| |||||||
| 125,422 | Absa Group Ltd. (Financials) | 1,069,344 | ||||||
| 112,157 | Aspen Pharmacare Holdings Ltd. (Health Care) | 1,145,848 | ||||||
| 84,549 | Bid Corp. Ltd. (Consumer Staples) | 1,977,566 | ||||||
| 42,953 | Bidvest Group Ltd. (The) (Industrials) | 523,172 | ||||||
| 7,152 | Capitec Bank Holdings Ltd. (Financials) | 752,256 | ||||||
| 87,993 | Clicks Group Ltd. (Consumer Staples) | 1,376,468 | ||||||
| 28,631 | Discovery Ltd. (Financials) | 202,826 | ||||||
| 540,853 | FirstRand Ltd. (Financials) | 1,826,361 | ||||||
| 124,575 | Gold Fields Ltd. (Materials) | 1,635,133 | ||||||
| 186,566 | Impala Platinum Holdings Ltd. (Materials) | 629,999 | ||||||
| 52,087 | Kumba Iron Ore Ltd. (Materials) | 1,457,907 | ||||||
| 264,958 | MTN Group Ltd. (Communication Services) | 1,153,267 | ||||||
| 8,910 | Naspers Ltd., Class N (Consumer Discretionary) | 1,465,422 | ||||||
| 95,624 | Nedbank Group Ltd. (Financials) | 1,092,582 | ||||||
| 1,179,356 | Old Mutual Ltd. (Financials) | 734,033 | ||||||
| 280,654 | OUTsurance Group Ltd. (Financials) | 609,184 | ||||||
| 296,438 | Pepkor Holdings Ltd. (Consumer Discretionary)(a) | 288,499 | ||||||
| 92,085 | Remgro Ltd. (Financials) | 698,231 | ||||||
| 256,115 | Sanlam Ltd. (Financials) | 981,938 | ||||||
| 212,916 | Shoprite Holdings Ltd. (Consumer Staples) | 2,865,924 | ||||||
| 189,537 | Standard Bank Group Ltd. (Financials) | 1,993,998 | ||||||
| 150,904 | Vodacom Group Ltd. (Communication Services) | 739,584 | ||||||
| 294,407 | Woolworths Holdings Ltd. (Consumer Discretionary) | 984,797 | ||||||
|
|
|
|||||||
| 26,204,339 | ||||||||
|
|
||||||||
| South Korea – 11.7% |
| |||||||
| 14,719 | Amorepacific Corp. (Consumer Staples) | 1,322,013 | ||||||
| 4,274 | Celltrion, Inc. (Health Care) | 576,778 | ||||||
| 5,661 | CJ CheilJedang Corp. (Consumer Staples) | 1,273,257 | ||||||
| 2,506 | CosmoAM&T Co. Ltd. (Information Technology)* | 333,293 | ||||||
| 45,388 | Coway Co. Ltd. (Consumer Discretionary) | 1,847,424 | ||||||
| 8,928 | DB Insurance Co. Ltd. (Financials)* | 662,426 | ||||||
| Shares |
Description | Value | ||||||
| Common Stocks – (continued) |
| |||||||
| South Korea – (continued) |
| |||||||
| 15,042 | Doosan Bobcat, Inc. (Industrials) | $ | 530,356 | |||||
| 28,784 | Doosan Enerbility Co. Ltd. (Industrials)* | 351,045 | ||||||
| 3,395 | Ecopro BM Co. Ltd. (Industrials)* | 679,459 | ||||||
| 925 | Ecopro Co. Ltd. (Industrials)* | 429,296 | ||||||
| 43,175 | GS Holdings Corp. (Industrials) | 1,557,944 | ||||||
| 44,102 | Hana Financial Group, Inc. (Financials) | 1,874,567 | ||||||
| 36,624 | Hankook Tire & Technology Co. Ltd. (Consumer Discretionary) | 1,490,704 | ||||||
| 6,148 | Hanmi Pharm Co. Ltd. (Health Care) | 1,542,079 | ||||||
| 4,563 | Hanwha Aerospace Co. Ltd. (Industrials) | 642,507 | ||||||
| 11,079 | HD Hyundai Co. Ltd. (Energy) | 588,229 | ||||||
| 8,300 | HD Korea Shipbuilding & Offshore Engineering Co. Ltd. (Industrials) | 697,484 | ||||||
| 69,099 | HMM Co. Ltd. (Industrials)* | 948,062 | ||||||
| 1,765 | HYBE Co. Ltd. (Communication Services) | 263,902 | ||||||
| 2,700 | Hyundai Glovis Co. Ltd. (Industrials)* | 386,265 | ||||||
| 6,531 | Hyundai Mobis Co. Ltd. (Consumer Discretionary) | 1,189,372 | ||||||
| 11,240 | Hyundai Motor Co. (Consumer Discretionary) | 2,114,464 | ||||||
| 19,863 | Hyundai Steel Co. (Materials)* | 536,253 | ||||||
| 157,340 | Industrial Bank of Korea (Financials)* | 1,654,220 | ||||||
| 14,546 | Kakao Corp. (Communication Services) | 582,233 | ||||||
| 61,041 | Kangwon Land, Inc. (Consumer Discretionary)* | 796,705 | ||||||
| 43,505 | KB Financial Group, Inc. (Financials) | 2,074,623 | ||||||
| 36,266 | Kia Corp. (Consumer Discretionary)* | 3,390,746 | ||||||
| 15,215 | Korea Aerospace Industries Ltd. (Industrials)* | 586,159 | ||||||
| 43,517 | Korea Electric Power Corp. (Utilities) | 810,470 | ||||||
| 5,744 | Korea Investment Holdings Co. Ltd. (Financials)* | 306,266 | ||||||
| 652 | Korea Zinc Co. Ltd. (Materials) | 219,112 | ||||||
| 34,398 | Korean Air Lines Co. Ltd. (Industrials) | 594,138 | ||||||
| 2,300 | Krafton, Inc. (Communication Services)* | 392,085 | ||||||
| 24,288 | KT Corp. (Communication Services) | 713,173 | ||||||
| 19,345 | KT&G Corp. (Consumer Staples) | 1,351,070 | ||||||
| 5,333 | Kumho Petrochemical Co. Ltd. (Materials)* | 592,333 | ||||||
| 1,065 | LG Chem Ltd. (Materials) | 362,305 | ||||||
| 38 | The accompanying notes are an integral part of these financial statements. |
GOLDMAN SACHS ACTIVEBETA® EMERGING MARKETS EQUITY ETF
| Shares |
Description | Value | ||||||
| Common Stocks – (continued) |
| |||||||
| South Korea – (continued) |
| |||||||
| 5,498 | LG Corp. (Industrials) | $ | 386,875 | |||||
| 30,213 | LG Electronics, Inc. (Consumer Discretionary) | 2,153,209 | ||||||
| 6,746 | LG H&H Co. Ltd. (Consumer Staples) | 1,616,081 | ||||||
| 2,480 | LG Innotek Co. Ltd. (Information Technology) | 376,209 | ||||||
| 294,337 | LG Uplus Corp. (Communication Services) | 2,281,134 | ||||||
| 13,300 | Meritz Financial Group, Inc. (Financials) | 830,002 | ||||||
| 69,964 | Mirae Asset Securities Co. Ltd. (Financials)* | 473,923 | ||||||
| 8,051 | NAVER Corp. (Communication Services) | 1,178,991 | ||||||
| 9,129 | NCSoft Corp. (Communication Services) | 1,329,999 | ||||||
| 8,100 | Netmarble Corp. (Communication Services)*(a) | 375,315 | ||||||
| 85,771 | NH Investment & Securities Co. Ltd. (Financials)* | 756,197 | ||||||
| 21,698 | Orion Corp. (Consumer Staples) | 1,513,776 | ||||||
| 13,022 | Posco DX Co. Ltd. (Information Technology)*(b) | 529,055 | ||||||
| 1,585 | POSCO Future M Co. Ltd. (Industrials)* | 377,324 | ||||||
| 7,223 | POSCO Holdings, Inc. (Materials) | 2,340,586 | ||||||
| 1,101 | Samsung Biologics Co. Ltd. (Health Care)*(a) | 639,962 | ||||||
| 13,621 | Samsung C&T Corp. (Industrials) | 1,602,892 | ||||||
| 7,034 | Samsung Electro-Mechanics Co. Ltd. (Information Technology) | 739,531 | ||||||
| 578,332 | Samsung Electronics Co. Ltd. (Information Technology) | 31,878,619 | ||||||
| 24,089 | Samsung Engineering Co. Ltd. (Industrials)* | 445,021 | ||||||
| 9,857 | Samsung Fire & Marine Insurance Co. Ltd. (Financials)* | 2,205,907 | ||||||
| 119,893 | Samsung Heavy Industries Co. Ltd. (Industrials)* | 711,291 | ||||||
| 10,089 | Samsung Life Insurance Co. Ltd. (Financials) | 734,173 | ||||||
| 1,621 | Samsung SDI Co. Ltd. (Information Technology) | 458,934 | ||||||
| 10,781 | Samsung SDS Co. Ltd. (Information Technology) | 1,295,404 | ||||||
| 43,199 | Samsung Securities Co. Ltd. (Financials) | 1,347,941 | ||||||
| 53,613 | Shinhan Financial Group Co. Ltd. (Financials) | 1,753,414 | ||||||
| 18,074 | SK Biopharmaceuticals Co. Ltd. (Health Care)* | 1,315,238 | ||||||
| 53,130 | SK Hynix, Inc. (Information Technology) | 6,232,281 | ||||||
| Shares |
Description | Value | ||||||
| Common Stocks – (continued) |
| |||||||
| South Korea – (continued) |
| |||||||
| 17,049 | SK Square Co. Ltd. (Industrials)* | $ | 894,957 | |||||
| 60,332 | SK Telecom Co. Ltd. (Communication Services) | 2,387,726 | ||||||
| 2,214 | SK, Inc. (Industrials) | 318,898 | ||||||
| 8,100 | S-Oil Corp. (Energy) | 464,734 | ||||||
| 110,227 | Woori Financial Group, Inc. (Financials) | 1,233,390 | ||||||
| 23,852 | Yuhan Corp. (Health Care) | 1,207,288 | ||||||
|
|
|
|||||||
| 110,649,094 | ||||||||
|
|
||||||||
| Taiwan – 16.5% |
| |||||||
| 152,083 | Accton Technology Corp. (Information Technology) | 2,497,068 | ||||||
| 556,762 | Acer, Inc. (Information Technology) | 795,261 | ||||||
| 179,804 | Advantech Co. Ltd. (Information Technology) | 2,218,433 | ||||||
| 632,395 | ASE Technology Holding Co. Ltd. (Information Technology) | 2,780,901 | ||||||
| 434,107 | Asia Cement Corp. (Materials) | 555,517 | ||||||
| 82,907 | Asustek Computer, Inc. (Information Technology) | 1,193,397 | ||||||
| 189,509 | Catcher Technology Co. Ltd. (Information Technology) | 1,181,078 | ||||||
| 797,467 | Cathay Financial Holding Co. Ltd. (Financials)* | 1,136,554 | ||||||
| 231,899 | Chailease Holding Co. Ltd. (Financials) | 1,280,197 | ||||||
| 770,300 | Chang Hwa Commercial Bank Ltd. (Financials) | 433,773 | ||||||
| 342,975 | Cheng Shin Rubber Industry Co. Ltd. (Consumer Discretionary) | 509,425 | ||||||
| 2,905,011 | China Development Financial Holding Corp. (Financials)* | 1,153,384 | ||||||
| 701,578 | China Steel Corp. (Materials) | 546,001 | ||||||
| 393,969 | Chunghwa Telecom Co. Ltd. (Communication Services) | 1,501,867 | ||||||
| 1,385,835 | Compal Electronics, Inc. (Information Technology) | 1,600,246 | ||||||
| 1,897,347 | CTBC Financial Holding Co. Ltd. (Financials) | 1,764,723 | ||||||
| 247,603 | Delta Electronics, Inc. (Information Technology) | 2,306,872 | ||||||
| 57,435 | E Ink Holdings, Inc. (Information Technology) | 446,986 | ||||||
| 916,645 | E.Sun Financial Holding Co. Ltd. (Financials) | 732,226 | ||||||
| 20,573 | eMemory Technology, Inc. (Information Technology) | 1,763,800 | ||||||
| 140,444 | Evergreen Marine Corp. Taiwan Ltd. (Industrials) | 735,332 | ||||||
| 806,763 | Far Eastern New Century Corp. (Industrials) | 832,043 | ||||||
| 272,813 | Feng TAY Enterprise Co. Ltd. (Consumer Discretionary) | 1,428,385 | ||||||
| 1,013,932 | First Financial Holding Co. Ltd. (Financials) | 869,282 | ||||||
| The accompanying notes are an integral part of these financial statements. | 39 |
GOLDMAN SACHS ACTIVEBETA® EMERGING MARKETS EQUITY ETF
|
Schedule of Investments (continued)
February 29, 2024 (Unaudited) |
| Shares |
Description | Value | ||||||
| Common Stocks – (continued) |
| |||||||
| Taiwan – (continued) |
| |||||||
| 335,011 | Formosa Plastics Corp. (Materials) | $ | 759,907 | |||||
| 1,029,462 | Fubon Financial Holding Co. Ltd. (Financials) | 2,214,632 | ||||||
| 35,376 | Gigabyte Technology Co. Ltd. (Information Technology) | 386,109 | ||||||
| 25,232 | Global Unichip Corp. (Information Technology) | 1,269,203 | ||||||
| 30,003 | Globalwafers Co. Ltd. (Information Technology) | 529,641 | ||||||
| 1,146,457 | Hon Hai Precision Industry Co. Ltd. (Information Technology) | 3,735,746 | ||||||
| 851,555 | Hua Nan Financial Holdings Co. Ltd. (Financials) | 592,677 | ||||||
| 798,735 | Inventec Corp. (Information Technology) | 1,389,786 | ||||||
| 9,167 | Largan Precision Co. Ltd. (Information Technology) | 751,120 | ||||||
| 467,084 | Lite-On Technology Corp. (Information Technology) | 1,618,048 | ||||||
| 198,101 | MediaTek, Inc. (Information Technology) | 7,144,534 | ||||||
| 751,101 | Mega Financial Holding Co. Ltd. (Financials) | 919,585 | ||||||
| 370,288 | Micro-Star International Co. Ltd. (Information Technology) | 2,237,460 | ||||||
| 422,328 | Nan Ya Plastics Corp. (Materials) | 797,639 | ||||||
| 49,174 | Nan Ya Printed Circuit Board Corp. (Information Technology) | 329,025 | ||||||
| 486,585 | Nanya Technology Corp. (Information Technology) | 1,035,991 | ||||||
| 122,062 | Nien Made Enterprise Co. Ltd. (Consumer Discretionary) | 1,426,847 | ||||||
| 204,253 | Novatek Microelectronics Corp. (Information Technology) | 3,883,518 | ||||||
| 510,323 | Pegatron Corp. (Information Technology) | 1,380,364 | ||||||
| 768,929 | Pou Chen Corp. (Consumer Discretionary) | 741,939 | ||||||
| 333,624 | President Chain Store Corp. (Consumer Staples) | 2,844,451 | ||||||
| 251,803 | Quanta Computer, Inc. (Information Technology) | 1,848,125 | ||||||
| 158,032 | Realtek Semiconductor Corp. (Information Technology) | 2,844,721 | ||||||
| 319,800 | Shanghai Commercial & Savings Bank Ltd. (The) (Financials) | 455,275 | ||||||
| 1,597,869 | SinoPac Financial Holdings Co. Ltd. (Financials) | 1,016,061 | ||||||
| 386,890 | Synnex Technology International Corp. (Information Technology) | 952,247 | ||||||
| 2,081,072 | Taishin Financial Holding Co. Ltd. (Financials) | 1,145,562 | ||||||
| 984,875 | Taiwan Business Bank (Financials) | 436,206 | ||||||
| Shares |
Description | Value | ||||||
| Common Stocks – (continued) |
| |||||||
| Taiwan – (continued) |
| |||||||
| 371,609 | Taiwan Cement Corp. (Materials) | $ | 377,375 | |||||
| 662,919 | Taiwan Cooperative Financial Holding Co. Ltd. (Financials) | 544,227 | ||||||
| 176,644 | Taiwan Mobile Co. Ltd. (Communication Services) | 553,244 | ||||||
| 2,936,048 | Taiwan Semiconductor Manufacturing Co. Ltd. (Information Technology) | 64,090,641 | ||||||
| 93,486 | Unimicron Technology Corp. (Information Technology) | 530,876 | ||||||
| 1,459,480 | Uni-President Enterprises Corp. (Consumer Staples) | 3,541,407 | ||||||
| 1,704,202 | United Microelectronics Corp. (Information Technology) | 2,633,710 | ||||||
| 181,806 | Vanguard International Semiconductor Corp. (Information Technology) | 415,267 | ||||||
| 29,558 | Voltronic Power Technology Corp. (Industrials) | 1,500,833 | ||||||
| 611,152 | Winbond Electronics Corp. (Information Technology) | 540,398 | ||||||
| 458,934 | Wistron Corp. (Information Technology) | 1,676,929 | ||||||
| 375,409 | WPG Holdings Ltd. (Information Technology) | 1,102,136 | ||||||
| 189,941 | Yang Ming Marine Transport Corp. (Industrials) | 299,548 | ||||||
| 2,444,684 | Yuanta Financial Holding Co. Ltd. (Financials) | 2,122,988 | ||||||
| 157,265 | Zhen Ding Technology Holding Ltd. (Information Technology) | 500,012 | ||||||
|
|
|
|||||||
| 155,378,761 | ||||||||
|
|
||||||||
| Thailand – 1.3% |
| |||||||
| 274,816 | Advanced Info Service PCL, NVDR (Communication Services) | 1,540,165 | ||||||
| 303,900 | Airports of Thailand PCL, NVDR (Industrials) | 538,064 | ||||||
| 1,598,100 | Bangkok Dusit Medical Services PCL, NVDR (Health Care) | 1,269,925 | ||||||
| 177,100 | Bumrungrad Hospital PCL, NVDR (Health Care) | 1,106,103 | ||||||
| 198,100 | Central Pattana PCL, NVDR (Real Estate) | 357,646 | ||||||
| 699,300 | Charoen Pokphand Foods PCL, NVDR (Consumer Staples) | 368,514 | ||||||
| 835,477 | CP ALL PCL, NVDR (Consumer Staples) | 1,339,465 | ||||||
| 510,200 | Delta Electronics Thailand PCL, NVDR (Information Technology)* | 1,013,572 | ||||||
| 277,900 | Gulf Energy Development PCL, NVDR (Utilities) | 333,186 | ||||||
| 780,700 | Indorama Ventures PCL, NVDR (Materials) | 507,188 | ||||||
| 40 | The accompanying notes are an integral part of these financial statements. |
GOLDMAN SACHS ACTIVEBETA® EMERGING MARKETS EQUITY ETF
| Shares |
Description | Value | ||||||
| Common Stocks – (continued) |
| |||||||
| Thailand – (continued) |
| |||||||
| 267,400 | Intouch Holdings PCL, NVDR (Communication Services) | $ | 505,126 | |||||
| 1,146,900 | Krung Thai Bank PCL, NVDR (Financials) | 514,850 | ||||||
| 290,000 | Krungthai Card PCL, NVDR (Financials) | 345,671 | ||||||
| 181,900 | PTT Exploration & Production PCL, NVDR (Energy) | 765,841 | ||||||
| 342,100 | PTT Global Chemical PCL, NVDR (Materials) | 362,465 | ||||||
| 705,200 | PTT PCL, NVDR (Energy) | 673,445 | ||||||
| 77,100 | Siam Cement PCL (The), NVDR (Materials) | 578,277 | ||||||
| 236,800 | Thai Oil PCL, NVDR (Energy) | 369,742 | ||||||
|
|
|
|||||||
| 12,489,245 | ||||||||
|
|
||||||||
| Turkey – 0.8% |
| |||||||
| 288,000 | Akbank TAS (Financials) | 383,572 | ||||||
| 224,459 | BIM Birlesik Magazalar AS (Consumer Staples) | 2,791,381 | ||||||
| 332,880 | KOC Holding AS (Industrials) | 1,793,429 | ||||||
| 47,191 | Tofas Turk Otomobil Fabrikasi AS (Consumer Discretionary) | 404,346 | ||||||
| 108,896 | Turk Hava Yollari AO (Industrials)* | 982,758 | ||||||
| 172,223 | Turkiye Petrol Rafinerileri AS (Energy) | 892,566 | ||||||
| 506,000 | Yapi ve Kredi Bankasi AS (Financials) | 374,398 | ||||||
|
|
|
|||||||
| 7,622,450 | ||||||||
|
|
||||||||
| United Arab Emirates – 1.5% |
| |||||||
| 418,490 | Abu Dhabi Commercial Bank PJSC (Financials) | 976,465 | ||||||
| 427,911 | Abu Dhabi Islamic Bank PJSC (Financials) | 1,309,515 | ||||||
| 1,155,552 | Abu Dhabi National Oil Co. for Distribution PJSC (Consumer Discretionary) | 1,101,155 | ||||||
| 603,976 | Aldar Properties PJSC (Real Estate) | 909,360 | ||||||
| 796,457 | Americana Restaurants International PLC (Consumer Discretionary) | 743,785 | ||||||
| 1,057,679 | Dubai Islamic Bank PJSC (Financials) | 1,854,516 | ||||||
| 940,198 | Emaar Properties PJSC (Real Estate) | 2,078,578 | ||||||
| 484,640 | Emirates NBD Bank PJSC (Financials) | 2,414,689 | ||||||
| 170,119 | Emirates Telecommunications Group Co. PJSC (Communication Services) | 838,344 | ||||||
| 412,531 | First Abu Dhabi Bank PJSC (Financials) | 1,532,011 | ||||||
|
|
|
|||||||
| 13,758,418 | ||||||||
|
|
||||||||
| Shares |
Description | Value | ||||||
| Common Stocks – (continued) |
| |||||||
| United Kingdom – 0.0% |
| |||||||
| 55,106 | Pepco Group NV (Consumer Discretionary)* | $ | 276,642 | |||||
|
|
||||||||
| United States – 0.1% |
| |||||||
| 49,223 | JBS SA (Consumer Staples) | 228,449 | ||||||
| 10,038 | Parade Technologies Ltd. (Information Technology) | 322,326 | ||||||
|
|
|
|||||||
| 550,775 | ||||||||
|
|
||||||||
| TOTAL COMMON STOCKS (Cost $791,106,210) |
914,821,151 | |||||||
|
|
||||||||
| Shares | Description | Rate | Value | |||||||||
| Preferred Stocks – 2.5% | ||||||||||||
| Brazil – 1.5% | ||||||||||||
| 539,825 | Banco Bradesco SA (Financials) | 8.10 | % | 1,493,885 | ||||||||
| 38,827 | Centrais Eletricas Brasileiras SA, Class B (Utilities) | 3.12 | 374,388 | |||||||||
| 242,142 | Cia Energetica de Minas Gerais (Utilities) | 10.78 | 583,345 | |||||||||
| 187,100 | Companhia Paranaense de Energia (Utilities) | 3.27 | 384,845 | |||||||||
| 152,342 | Gerdau SA (Materials) | 7.44 | 659,204 | |||||||||
| 589,064 | Itau Unibanco Holding SA (Financials) | 7.02 | 4,023,796 | |||||||||
| 793,727 | Itausa SA (Financials) | 8.36 | 1,645,394 | |||||||||
| 629,112 | Petroleo Brasileiro SA (Energy) | 7.91 | 5,082,378 | |||||||||
|
| ||||||||||||
| 14,247,235 | ||||||||||||
|
| ||||||||||||
| Chile – 0.1% | ||||||||||||
| 20,889 | Sociedad Quimica y Minera de Chile SA, Class B (Industrials) | 8.66 | 1,036,873 | |||||||||
|
| ||||||||||||
| Colombia – 0.1% | ||||||||||||
| 75,095 | Bancolombia SA (Financials) | 11.02 | 613,520 | |||||||||
|
| ||||||||||||
| Russia – 0.0% | ||||||||||||
| 3,212,489 | Surgutneftegas PJSC (Energy)(c) | 1.29 | — | |||||||||
|
| ||||||||||||
| South Korea – 0.8% | ||||||||||||
| 8,986 | Hyundai Motor Co. (Consumer Discretionary) | 21.25 | 1,084,447 | |||||||||
| 8,734 | Hyundai Motor Co. (Consumer Discretionary) | 21.27 | 1,046,165 | |||||||||
| The accompanying notes are an integral part of these financial statements. | 41 |
GOLDMAN SACHS ACTIVEBETA® EMERGING MARKETS EQUITY ETF
|
Schedule of Investments (continued)
February 29, 2024 (Unaudited) |
| Shares |
Description | Rate | Value | |||||||||||
| Preferred Stocks – (continued) | ||||||||||||||
| South Korea – (continued) | ||||||||||||||
| 104,962 | Samsung Electronics Co. Ltd. (Information Technology) | 2.30 | % | $ | 5,013,205 | |||||||||
|
|
|
|||||||||||||
| 7,143,817 | ||||||||||||||
|
|
|
|||||||||||||
| |
TOTAL PREFERRED
STOCKS (Cost $16,918,700) |
23,041,445 | ||||||||||||
|
|
|
|||||||||||||
| Shares | Description | Value | ||||||
| Exchange-Traded Fund – 0.6% | ||||||||
| United States – 0.6% | ||||||||
| 257,264 | iShares MSCI Malaysia ETF(b) | |||||||
| (Cost $7,732,868) | 5,590,347 | |||||||
|
|
||||||||
| Shares | Dividend Rate | Value | ||||||
| Investment Company – 1.3%(d) | ||||||||
|
Goldman Sachs Financial Square Treasury Obligations Fund – Institutional Shares |
| |||||||
| 12,595,998 | 5.195% | 12,595,998 | ||||||
| (Cost $12,595,998) | ||||||||
|
|
||||||||
| TOTAL INVESTMENTS BEFORE
SECURITIES LENDING REINVESTMENT VEHICLE (Cost $828,353,776) |
956,048,941 | |||||||
|
|
||||||||
| Sector Name | %
of Market Value |
|||
|
|
||||
|
Information Technology |
22% | |||
|
Financials |
21.3 | |||
|
Consumer Discretionary |
11.3 | |||
|
Consumer Staples |
9.9 | |||
|
Communication Services |
8.2 | |||
|
Materials |
6.2 | |||
|
Industrials |
5.3 | |||
|
Energy |
5.2 | |||
|
Health Care |
4.7 | |||
|
Utilities |
2.7 | |||
|
Investment Company |
1.3 | |||
|
Real Estate |
0.8 | |||
|
Exchange-Traded Fund |
0.6 | |||
|
Securities Lending Reinvestment Vehicle |
0.1 | |||
|
|
||||
|
TOTAL INVESTMENTS |
100.0% | |||
|
|
||||
| Shares | Dividend Rate |
Value | ||||||||||
| Securities Lending Reinvestment Vehicle – 0.1%(d) |
| |||||||||||
|
Goldman Sachs Financial Square Government Fund - Institutional Shares |
| |||||||||||
| 906,385 | 5.219% | $ | 906,385 | |||||||||
| (Cost $906,385) |
| |||||||||||
|
|
||||||||||||
| TOTAL INVESTMENTS –
101.3% (Cost $829,260,161) |
$ | 956,955,326 | ||||||||||
|
|
||||||||||||
|
LIABILITIES IN EXCESS OF OTHER ASSETS – (1.3)% |
(12,265,166 | ) | ||||||||||
|
|
||||||||||||
| NET ASSETS – 100.0% | $ | 944,690,160 | ||||||||||
|
|
||||||||||||
The percentage shown for each investment category reflects the value of investments in that category as a percentage of net assets.
| * |
Non-income producing security. |
| (a) |
Exempt from registration under Rule 144A of the Securities Act of 1933. |
| (b) |
All or a portion of security is on loan. |
| (c) |
Significant unobservable inputs were used in the valuation of this portfolio security; i.e. Level 3. |
| (d) |
Represents an affiliated issuer. |
|
| ||
| Investment Abbreviations: | ||
| ADR | —American Depositary Receipt | |
| GDR | —Global Depositary Receipt | |
| NVDR | —Non-Voting Depository Receipt | |
| PLC | —Public Limited Company | |
|
| ||
| 42 | The accompanying notes are an integral part of these financial statements. |
GOLDMAN SACHS ACTIVEBETA® EUROPE EQUITY ETF
|
Schedule of Investments
February 29, 2024 (Unaudited) |
| Shares | Description | Value | ||||||
| Common Stocks – 99.1% | ||||||||
| Australia – 0.7% | ||||||||
| 5,717 | Glencore PLC (Materials) | $ | 27,130 | |||||
| 727 | Rio Tinto PLC (Materials) | 46,707 | ||||||
|
|
|
|||||||
| 73,837 | ||||||||
|
|
||||||||
| Austria – 0.6% | ||||||||
| 338 | Erste Group Bank AG (Financials) | 13,497 | ||||||
| 227 | Mondi PLC (Materials) | 4,044 | ||||||
| 63 | OMV AG (Energy) | 2,778 | ||||||
| 1,735 | voestalpine AG (Materials) | 47,389 | ||||||
|
|
|
|||||||
| 67,708 | ||||||||
|
|
||||||||
| Belgium – 1.2% | ||||||||
| 534 | Ageas SA/NV (Financials) | 22,652 | ||||||
| 605 | Anheuser-Busch InBev SA/NV (Consumer Staples) | 36,480 | ||||||
| 17 | D’ieteren Group (Consumer Discretionary) | 3,275 | ||||||
| 28 | Elia Group SA/NV (Utilities) | 3,112 | ||||||
| 102 | Groupe Bruxelles Lambert NV (Financials) | 7,654 | ||||||
| 140 | KBC Group NV (Financials) | 9,832 | ||||||
| 1 | Lotus Bakeries NV (Consumer Staples) | 9,415 | ||||||
| 152 | Syensqo SA (Materials)* | 13,588 | ||||||
| 219 | UCB SA (Health Care) | 25,239 | ||||||
|
|
|
|||||||
| 131,247 | ||||||||
|
|
||||||||
| Brazil – 0.1% | ||||||||
| 172 | Yara International ASA (Materials) | 5,355 | ||||||
|
|
||||||||
| China – 0.1% | ||||||||
| 323 | Prosus NV (Consumer Discretionary)* | 9,434 | ||||||
|
|
||||||||
| Denmark – 5.2% | ||||||||
| 7 | AP Moller – Maersk A/S, Class A (Industrials)(a) | 9,502 | ||||||
| 7 | AP Moller – Maersk A/S, Class B (Industrials) | 9,904 | ||||||
| 135 | Carlsberg AS, Class B (Consumer Staples) | 18,834 | ||||||
| 68 | Coloplast A/S, Class B (Health Care) | 9,039 | ||||||
| 725 | Danske Bank A/S (Financials) | 21,313 | ||||||
| 157 | Demant A/S (Health Care)* | 7,866 | ||||||
| 55 | DSV A/S (Industrials) | 8,831 | ||||||
| 48 | Genmab A/S (Health Care)* | 13,449 | ||||||
| 3,083 | Novo Nordisk A/S, Class B (Health Care) | 366,873 | ||||||
| 244 | Novozymes A/S, Class B (Materials) | 13,772 | ||||||
| 260 | Pandora A/S (Consumer Discretionary) | 42,010 | ||||||
| 28 | ROCKWOOL A/S, Class B (Industrials) | 8,963 | ||||||
| 581 | Tryg A/S (Financials) | 12,357 | ||||||
| Shares | Description | Value | ||||||
| Common Stocks – (continued) | ||||||||
| Denmark – (continued) | ||||||||
| 115 | Vestas Wind Systems A/S (Industrials)* | $ | 3,204 | |||||
|
|
|
|||||||
| 545,917 | ||||||||
|
|
||||||||
| Finland – 1.2% | ||||||||
| 235 | Elisa OYJ (Communication Services) | 10,594 | ||||||
| 289 | Fortum OYJ (Utilities) | 3,612 | ||||||
| 126 | Kone OYJ, Class B (Industrials) | 6,166 | ||||||
| 427 | Metso Corp. (Industrials) | 4,562 | ||||||
| 4,858 | Nokia OYJ (Information Technology) | 17,135 | ||||||
| 1,579 | Nordea Bank Abp (Financials) | 19,206 | ||||||
| 842 | Orion OYJ, Class B (Health Care) | 33,167 | ||||||
| 290 | Sampo OYJ, Class A (Financials) | 12,983 | ||||||
| 232 | UPM-Kymmene OYJ (Materials) | 7,765 | ||||||
| 463 | Wartsila OYJ Abp (Industrials) | 7,162 | ||||||
|
|
|
|||||||
| 122,352 | ||||||||
|
|
||||||||
| France – 17.4% | ||||||||
| 237 | Accor SA (Consumer Discretionary) | 10,282 | ||||||
| 257 | Adevinta ASA (Communication Services)* | 2,750 | ||||||
| 32 | Aeroports de Paris SA (Industrials) | 4,353 | ||||||
| 325 | Air Liquide SA (Materials) | 66,084 | ||||||
| 281 | Airbus SE (Industrials) | 46,507 | ||||||
| 64 | Amundi SA (Financials)(b) | 4,214 | ||||||
| 112 | Arkema SA (Materials) | 11,606 | ||||||
| 1,860 | AXA SA (Financials) | 66,181 | ||||||
| 167 | BioMerieux (Health Care) | 18,271 | ||||||
| 792 | BNP Paribas SA (Financials) | 47,464 | ||||||
| 1,462 | Bollore SE (Communication Services) | 10,031 | ||||||
| 390 | Bouygues SA (Industrials) | 15,434 | ||||||
| 545 | Bureau Veritas SA (Industrials) | 15,847 | ||||||
| 175 | Capgemini SE (Information Technology) | 42,553 | ||||||
| 2,484 | Carrefour SA (Consumer Staples) | 41,746 | ||||||
| 798 | Cie de Saint-Gobain SA (Industrials) | 61,485 | ||||||
| 475 | Cie Generale des Etablissements Michelin SCA (Consumer Discretionary) | 17,574 | ||||||
| 54 | Covivio SA REIT (Real Estate) | 2,426 | ||||||
| 2,490 | Credit Agricole SA (Financials) | 33,736 | ||||||
| 633 | Danone SA (Consumer Staples) | 40,429 | ||||||
| 100 | Dassault Aviation SA (Industrials) | 19,793 | ||||||
| 480 | Dassault Systemes (Information Technology) | 22,432 | ||||||
| 280 | Edenred SE (Financials) | 13,874 | ||||||
| 553 | Eiffage SA (Industrials) | 60,232 | ||||||
| 1,952 | Engie SA (Utilities) | 31,339 | ||||||
| The accompanying notes are an integral part of these financial statements. | 43 |
GOLDMAN SACHS ACTIVEBETA® EUROPE EQUITY ETF
|
Schedule of Investments (continued)
February 29, 2024 (Unaudited) |
| Shares | Description | Value | ||||||
| Common Stocks – (continued) | ||||||||
| France – (continued) | ||||||||
| 205 | EssilorLuxottica SA (Health Care) | $ | 43,516 | |||||
| 545 | Eurazeo SE (Financials) | 46,061 | ||||||
| 43 | Gecina SA REIT (Real Estate) | 4,155 | ||||||
| 510 | Getlink SE (Industrials) | 8,714 | ||||||
| 35 | Hermes International SCA (Consumer Discretionary) | 87,605 | ||||||
| 449 | Ipsen SA (Health Care) | 49,463 | ||||||
| 51 | Kering (Consumer Discretionary) | 23,458 | ||||||
| 116 | Klepierre SA REIT (Real Estate) | 2,947 | ||||||
| 1,354 | La Francaise des Jeux SAEM (Consumer Discretionary)(b) | 56,734 | ||||||
| 250 | Legrand SA (Industrials) | 25,295 | ||||||
| 254 | L’Oreal SA (Consumer Staples) | 121,408 | ||||||
| 241 | LVMH Moet Hennessy Louis Vuitton SE (Consumer Discretionary) | 219,801 | ||||||
| 1,914 | Orange SA (Communication Services) | 21,968 | ||||||
| 67 | Pernod Ricard SA (Consumer Staples) | 11,206 | ||||||
| 245 | Publicis Groupe SA (Communication Services) | 25,924 | ||||||
| 804 | Rexel SA (Industrials) | 20,620 | ||||||
| 208 | Safran SA (Industrials) | 43,599 | ||||||
| 475 | SEB SA (Consumer Discretionary) | 56,234 | ||||||
| 704 | Societe Generale SA (Financials) | 17,088 | ||||||
| 119 | Sodexo SA (Consumer Discretionary) | 9,491 | ||||||
| 138 | Thales SA (Industrials) | 20,467 | ||||||
| 2,019 | TotalEnergies SE (Energy) | 128,885 | ||||||
| 504 | Veolia Environnement SA (Utilities) | 15,626 | ||||||
| 410 | Vinci SA (Industrials) | 52,532 | ||||||
| 740 | Vivendi SE (Communication Services) | 8,272 | ||||||
| 911 | Worldline SA (Financials)*(b) | 10,475 | ||||||
|
|
|
|||||||
| 1,838,187 | ||||||||
|
|
||||||||
| Germany – 13.1% | ||||||||
| 236 | adidas AG (Consumer Discretionary) | 47,788 | ||||||
| 258 | Allianz SE (Financials) | 70,874 | ||||||
| 396 | BASF SE (Materials) | 20,173 | ||||||
| 799 | Bayer AG (Health Care) | 24,288 | ||||||
| 400 | Bayerische Motoren Werke AG (Consumer Discretionary) | 47,277 | ||||||
| 247 | Bechtle AG (Information Technology) | 12,739 | ||||||
| 170 | Beiersdorf AG (Consumer Staples) | 24,385 | ||||||
| 217 | Brenntag SE (Industrials) | 19,815 | ||||||
| 51 | Carl Zeiss Meditec AG (Health Care) | 6,278 | ||||||
| 1,923 | Commerzbank AG (Financials) | 22,256 | ||||||
| Shares | Description | Value | ||||||
| Common Stocks – (continued) | ||||||||
| Germany – (continued) | ||||||||
| 186 | Covestro AG (Materials)*(b) | $ | 10,124 | |||||
| 332 | Daimler Truck Holding AG (Industrials) | 13,573 | ||||||
| 3,581 | Deutsche Bank AG (Financials) | 47,905 | ||||||
| 121 | Deutsche Boerse AG (Financials) | 25,350 | ||||||
| 5,800 | Deutsche Lufthansa AG (Industrials)* | 45,115 | ||||||
| 1,466 | Deutsche Post AG (Industrials) | 68,074 | ||||||
| 2,207 | Deutsche Telekom AG (Communication Services) | 52,507 | ||||||
| 4,063 | E.ON SE (Utilities) | 51,926 | ||||||
| 224 | Evonik Industries AG (Materials) | 4,135 | ||||||
| 994 | Fresenius Medical Care AG (Health Care) | 38,057 | ||||||
| 491 | Fresenius SE & Co. KGaA (Health Care) | 13,751 | ||||||
| 202 | GEA Group AG (Industrials) | 8,147 | ||||||
| 80 | Hannover Rueck SE (Financials) | 20,544 | ||||||
| 374 | Heidelberg Materials AG (Materials) | 36,304 | ||||||
| 122 | Henkel AG & Co. KGaA (Consumer Staples) | 8,238 | ||||||
| 583 | Infineon Technologies AG (Information Technology) | 20,879 | ||||||
| 221 | Knorr-Bremse AG (Industrials) | 15,469 | ||||||
| 684 | Mercedes-Benz Group AG (Consumer Discretionary) | 54,508 | ||||||
| 121 | Merck KGaA (Health Care) | 20,662 | ||||||
| 23 | MTU Aero Engines AG (Industrials) | 5,533 | ||||||
| 101 | Muenchener Rueckversicherungs- Gesellschaft AG in Muenchen (Financials) | 47,041 | ||||||
| 533 | Nemetschek SE (Information Technology) | 50,861 | ||||||
| 582 | Puma SE (Consumer Discretionary) | 26,748 | ||||||
| 44 | Rational AG (Industrials) | 36,187 | ||||||
| 43 | Rheinmetall AG (Industrials) | 19,730 | ||||||
| 315 | RWE AG (Utilities) | 10,567 | ||||||
| 825 | SAP SE (Information Technology) | 154,343 | ||||||
| 133 | Scout24 SE (Communication Services)(b) | 9,672 | ||||||
| 501 | Siemens AG (Industrials) | 99,182 | ||||||
| 1,186 | Siemens Energy AG (Industrials)* | 18,231 | ||||||
| 124 | Siemens Healthineers AG (Health Care)*(b) | 7,447 | ||||||
| 76 | Symrise AG (Materials) | 7,777 | ||||||
| 248 | Talanx AG (Financials) | 17,713 | ||||||
| 74 | Vonovia SE (Real Estate) | 2,066 | ||||||
| 44 | The accompanying notes are an integral part of these financial statements. |
GOLDMAN SACHS ACTIVEBETA® EUROPE EQUITY ETF
| Shares | Description | Value | ||||||
| Common Stocks – (continued) | ||||||||
| Germany – (continued) | ||||||||
| 1,020 | Zalando SE (Consumer Discretionary)*(b) | $ | 21,546 | |||||
|
|
|
|||||||
| 1,385,785 | ||||||||
|
|
||||||||
| Hong Kong – 0.1% | ||||||||
| 809 | Prudential PLC (Financials) | 7,958 | ||||||
|
|
||||||||
| Ireland – 0.4% | ||||||||
| 118 | AerCap Holdings NV (Industrials)* | 9,107 | ||||||
| 320 | Bank of Ireland Group PLC (Financials) | 2,789 | ||||||
| 117 | Kerry Group PLC, Class A (Consumer Staples) | 10,273 | ||||||
| 152 | Kingspan Group PLC (Industrials) | 13,732 | ||||||
| 252 | Smurfit Kappa Group PLC (Materials) | 10,753 | ||||||
|
|
|
|||||||
| 46,654 | ||||||||
|
|
||||||||
| Italy – 4.8% | ||||||||
| 1,918 | Assicurazioni Generali SpA (Financials) | 45,496 | ||||||
| 1,497 | Banco BPM SpA (Financials) | 8,706 | ||||||
| 489 | Coca-Cola HBC AG (Consumer Staples)* | 15,247 | ||||||
| 789 | Davide Campari-Milano NV (Consumer Staples) | 8,002 | ||||||
| 63 | DiaSorin SpA (Health Care) | 6,366 | ||||||
| 5,489 | Enel SpA (Utilities) | 34,945 | ||||||
| 3,062 | Eni SpA (Energy) | 47,211 | ||||||
| 146 | Ferrari NV (Consumer Discretionary) | 61,602 | ||||||
| 959 | FinecoBank Banca Fineco SpA (Financials) | 13,263 | ||||||
| 549 | Infrastrutture Wireless Italiane SpA (Communication Services)(b) | 6,081 | ||||||
| 7,705 | Intesa Sanpaolo SpA (Financials) | 24,497 | ||||||
| 1,940 | Leonardo SpA (Industrials) | 41,473 | ||||||
| 862 | Mediobanca Banca di Credito Finanziario SpA (Financials) | 11,749 | ||||||
| 615 | Moncler SpA (Consumer Discretionary) | 44,364 | ||||||
| 2,247 | Poste Italiane SpA (Financials)(b) | 26,358 | ||||||
| 467 | Prysmian SpA (Industrials) | 23,272 | ||||||
| 335 | Recordati Industria Chimica e Farmaceutica SpA (Health Care) | 18,764 | ||||||
| 1,646 | Snam SpA (Utilities) | 7,697 | ||||||
| 1,363 | Terna - Rete Elettrica Nazionale (Utilities) | 10,685 | ||||||
| 1,659 | UniCredit SpA (Financials) | 55,492 | ||||||
|
|
|
|||||||
| 511,270 | ||||||||
|
|
||||||||
| Jordan – 0.2% | ||||||||
| 630 | Hikma Pharmaceuticals PLC (Health Care) | 15,675 | ||||||
|
|
||||||||
| Shares | Description | Value | ||||||
| Common Stocks – (continued) | ||||||||
| Luxembourg – 0.6% | ||||||||
| 2,115 | ArcelorMittal (Materials) | $ | 55,205 | |||||
| 149 | Eurofins Scientific SE (Health Care) | 8,907 | ||||||
|
|
|
|||||||
| 64,112 | ||||||||
|
|
||||||||
| Netherlands – 8.7% | ||||||||
| 912 | ABN AMRO Bank NV (Financials)(b) | 14,656 | ||||||
| 7 | Adyen NV (Financials)*(b) | 11,060 | ||||||
| 1,319 | Aegon Ltd. (Financials) | 7,916 | ||||||
| 163 | Akzo Nobel NV (Materials) | 11,878 | ||||||
| 23 | Argenx SE (Health Care)* | 8,542 | ||||||
| 43 | ASM International NV (Information Technology) | 26,230 | ||||||
| 338 | ASML Holding NV (Information Technology) | 318,400 | ||||||
| 129 | ASR Nederland NV (Financials) | 5,951 | ||||||
| 104 | BE Semiconductor Industries NV (Information Technology) | 18,812 | ||||||
| 80 | Euronext NV (Financials)(b) | 7,380 | ||||||
| 387 | EXOR NV (Financials) | 41,795 | ||||||
| 262 | Heineken Holding NV (Consumer Staples) | 20,244 | ||||||
| 176 | Heineken NV (Consumer Staples) | 16,269 | ||||||
| 52 | IMCD NV (Industrials) | 7,929 | ||||||
| 1,734 | ING Groep NV (Financials) | 23,812 | ||||||
| 440 | JDE Peet’s NV (Consumer Staples) | 10,066 | ||||||
| 2,336 | Koninklijke Ahold Delhaize NV (Consumer Staples) | 69,568 | ||||||
| 4,595 | Koninklijke KPN NV (Communication Services) | 16,822 | ||||||
| 524 | Koninklijke Philips NV (Health Care) | 10,492 | ||||||
| 109 | NN Group NV (Financials) | 4,867 | ||||||
| 568 | Randstad NV (Industrials) | 31,311 | ||||||
| 4,924 | Shell PLC (Energy) | 153,037 | ||||||
| 510 | Universal Music Group NV (Communication Services) | 15,381 | ||||||
| 419 | Wolters Kluwer NV (Industrials) | 66,131 | ||||||
|
|
|
|||||||
| 918,549 | ||||||||
|
|
||||||||
| Norway – 1.1% | ||||||||
| 269 | Aker BP ASA (Energy) | 6,540 | ||||||
| 706 | DNB Bank ASA (Financials) | 14,141 | ||||||
| 1,221 | Equinor ASA (Energy) | 30,141 | ||||||
| 787 | Gjensidige Forsikring ASA (Financials) | 12,444 | ||||||
| 204 | Kongsberg Gruppen ASA (Industrials) | 13,020 | ||||||
| 291 | Mowi ASA (Consumer Staples) | 5,626 | ||||||
| 1,808 | Orkla ASA (Consumer Staples) | 12,974 | ||||||
| 135 | Salmar ASA (Consumer Staples) | 8,577 | ||||||
| 931 | Telenor ASA (Communication Services) | 10,207 | ||||||
|
|
|
|||||||
| 113,670 | ||||||||
|
|
||||||||
| The accompanying notes are an integral part of these financial statements. | 45 |
GOLDMAN SACHS ACTIVEBETA® EUROPE EQUITY ETF
|
Schedule of Investments (continued)
February 29, 2024 (Unaudited) |
| Shares | Description | Value | ||||||
| Common Stocks – (continued) | ||||||||
| Portugal – 0.5% | ||||||||
| 1,293 | EDP – Energias de Portugal SA (Utilities) | $ | 5,148 | |||||
| 365 | Galp Energia SGPS SA (Energy) | 5,755 | ||||||
| 1,613 | Jeronimo Martins SGPS SA (Consumer Staples) | 38,610 | ||||||
|
|
|
|||||||
| 49,513 | ||||||||
|
|
||||||||
| Singapore – 0.3% | ||||||||
| 635 | STMicroelectronics NV (Information Technology) | 28,672 | ||||||
|
|
||||||||
| Spain – 4.1% | ||||||||
| 33 | Acciona SA (Utilities) | 3,694 | ||||||
| 1,101 | ACS Actividades de Construccion y Servicios SA (Industrials) | 45,203 | ||||||
| 31 | Aena SME SA (Industrials)(b) | 5,876 | ||||||
| 275 | Amadeus IT Group SA (Consumer Discretionary) | 16,183 | ||||||
| 5,454 | Banco Bilbao Vizcaya Argentaria SA (Financials) | 54,216 | ||||||
| 15,368 | Banco Santander SA (Financials) | 63,953 | ||||||
| 3,123 | CaixaBank SA (Financials) | 14,093 | ||||||
| 77 | Cellnex Telecom SA (Communication Services)*(b) |
2,772 | ||||||
| 375 | Enagas SA (Utilities) | 5,416 | ||||||
| 315 | Endesa SA (Utilities) | 5,672 | ||||||
| 325 | Grifols SA (Health Care)* | 2,667 | ||||||
| 4,509 | Iberdrola SA (Utilities) | 51,819 | ||||||
| 1,876 | Industria de Diseno Textil SA (Consumer Discretionary) | 83,255 | ||||||
| 487 | Redeia Corp. SA (Utilities) | 7,747 | ||||||
| 2,510 | Repsol SA (Energy) | 39,996 | ||||||
| 8,210 | Telefonica SA (Communication Services) | 33,699 | ||||||
|
|
|
|||||||
| 436,261 | ||||||||
|
|
||||||||
| Sweden – 3.9% | ||||||||
| 259 | Alfa Laval AB (Industrials) | 9,754 | ||||||
| 485 | Assa Abloy AB, Class B (Industrials) | 13,846 | ||||||
| 1,827 | Atlas Copco AB, Class A (Industrials) | 31,738 | ||||||
| 1,130 | Atlas Copco AB, Class B (Industrials) | 16,910 | ||||||
| 204 | Epiroc AB, Class A (Industrials) | 3,702 | ||||||
| 152 | Epiroc AB, Class B (Industrials) | 2,509 | ||||||
| 434 | Essity AB, Class B (Consumer Staples) | 10,138 | ||||||
| 68 | Evolution AB (Consumer Discretionary)(b) | 8,815 | ||||||
| 115 | Getinge AB, Class B (Health Care) | 2,281 | ||||||
| 3,060 | H & M Hennes & Mauritz AB, Class B (Consumer Discretionary) | 41,538 | ||||||
| Shares | Description | Value | ||||||
| Common Stocks – (continued) | ||||||||
| Sweden – (continued) | ||||||||
| 1,349 | Hexagon AB, Class B (Information Technology) | $ | 15,820 | |||||
| 152 | Holmen AB, Class B (Materials) | 6,108 | ||||||
| 641 | Husqvarna AB, Class B (Industrials) | 4,947 | ||||||
| 254 | Industrivarden AB, Class A (Financials) | 8,672 | ||||||
| 260 | Industrivarden AB, Class C (Financials) | 8,852 | ||||||
| 1,227 | Investor AB, Class B (Financials) | 30,878 | ||||||
| 117 | L E Lundbergforetagen AB, Class B (Financials) | 6,366 | ||||||
| 296 | Lifco AB, Class B (Industrials) | 7,890 | ||||||
| 115 | Saab AB, Class B (Industrials) | 9,073 | ||||||
| 193 | Sandvik AB (Industrials) | 4,344 | ||||||
| 1,277 | Skandinaviska Enskilda Banken AB, Class A (Financials) | 18,981 | ||||||
| 110 | SKF AB, Class B (Industrials) | 2,400 | ||||||
| 357 | Svenska Cellulosa AB SCA, Class B (Materials) | 5,060 | ||||||
| 1,283 | Svenska Handelsbanken AB, Class A (Financials) | 15,350 | ||||||
| 848 | Swedbank AB, Class A (Financials) | 18,636 | ||||||
| 490 | Swedish Orphan Biovitrum AB (Health Care)* | 12,057 | ||||||
| 688 | Tele2 AB, Class B (Communication Services) | 5,779 | ||||||
| 3,835 | Telefonaktiebolaget LM Ericsson, Class B (Information Technology) | 20,840 | ||||||
| 2,668 | Telia Co. AB (Communication Services) | 6,361 | ||||||
| 428 | Volvo AB, Class A (Industrials) | 11,946 | ||||||
| 880 | Volvo AB, Class B (Industrials) | 24,246 | ||||||
| 7,160 | Volvo Car AB, Class B (Consumer Discretionary)* | 26,128 | ||||||
|
|
|
|||||||
| 411,965 | ||||||||
|
|
||||||||
| Switzerland – 9.1% | ||||||||
| 923 | ABB Ltd. (Industrials) | 42,683 | ||||||
| 95 | Adecco Group AG (Industrials) | 3,822 | ||||||
| 146 | Alcon, Inc. (Health Care) | 12,465 | ||||||
| 86 | Avolta AG (Consumer Discretionary)* | 3,378 | ||||||
| 74 | Baloise Holding AG (Financials) | 11,984 | ||||||
| 136 | Banque Cantonale Vaudoise (Financials) | 16,356 | ||||||
| 6 | Barry Callebaut AG (Consumer Staples) | 8,463 | ||||||
| 82 | BKW AG (Utilities) | 11,547 | ||||||
| 2 | Chocoladefabriken Lindt & Spruengli AG (Consumer Staples) | 24,576 | ||||||
| 342 | Cie Financiere Richemont SA (Consumer Discretionary) | 54,608 | ||||||
| 269 | Clariant AG (Materials)* | 3,342 | ||||||
| 46 | The accompanying notes are an integral part of these financial statements. |
GOLDMAN SACHS ACTIVEBETA® EUROPE EQUITY ETF
| Shares | Description | Value | ||||||
| Common Stocks – (continued) | ||||||||
| Switzerland – (continued) | ||||||||
| 63 | DSM-Firmenich AG (Materials) | $ | 6,749 | |||||
| 25 | EMS-Chemie Holding AG (Materials) | 17,503 | ||||||
| 53 | Geberit AG (Industrials) | 30,889 | ||||||
| 5 | Givaudan SA (Materials) | 21,049 | ||||||
| 80 | Helvetia Holding AG (Financials) | 11,348 | ||||||
| 165 | Kuehne + Nagel International AG (Industrials) | 55,765 | ||||||
| 441 | Logitech International SA (Information Technology) | 39,054 | ||||||
| 7 | Lonza Group AG (Health Care) | 3,673 | ||||||
| 1,837 | Novartis AG (Health Care) | 186,694 | ||||||
| 32 | Partners Group Holding AG (Financials) | 46,117 | ||||||
| 622 | Sandoz Group AG (Health Care)* | 19,397 | ||||||
| 30 | Schindler Holding AG (Industrials) | 7,659 | ||||||
| 36 | Schindler Holding AG Participation Certificates (Industrials) | 9,522 | ||||||
| 438 | SGS SA (Industrials) | 42,181 | ||||||
| 136 | SIG Group AG (Materials)* | 2,703 | ||||||
| 24 | Sika AG (Materials) | 6,964 | ||||||
| 37 | Sonova Holding AG (Health Care) | 11,442 | ||||||
| 156 | Straumann Holding AG (Health Care) | 24,732 | ||||||
| 58 | Swatch Group AG (The) – Bearer (Consumer Discretionary) | 13,740 | ||||||
| 267 | Swatch Group AG (The) – Registered (Consumer Discretionary) | 12,265 | ||||||
| 32 | Swiss Life Holding AG (Financials) | 23,316 | ||||||
| 121 | Swiss Prime Site AG (Real Estate) | 11,612 | ||||||
| 23 | Swisscom AG (Communication Services) | 13,201 | ||||||
| 31 | Temenos AG (Information Technology) | 2,334 | ||||||
| 2,785 | UBS Group AG (Financials) | 79,734 | ||||||
| 31 | VAT Group AG (Industrials)(b) | 15,589 | ||||||
| 98 | Zurich Insurance Group AG (Financials) | 52,308 | ||||||
|
|
|
|||||||
| 960,764 | ||||||||
|
|
||||||||
| United Kingdom – 16.7% | ||||||||
| 1,348 | 3i Group PLC (Financials) | 42,083 | ||||||
| 811 | Admiral Group PLC (Financials) | 27,350 | ||||||
| 65 | Ashtead Group PLC (Industrials) | 4,670 | ||||||
| 773 | Associated British Foods PLC (Consumer Staples) | 22,226 | ||||||
| 1,276 | AstraZeneca PLC (Health Care) | 161,133 | ||||||
| Shares | Description | Value | ||||||
| Common Stocks – (continued) | ||||||||
| United Kingdom – (continued) | ||||||||
| 5,947 | Auto Trader Group PLC (Communication Services)(b) | $ | 55,698 | |||||
| 1,403 | Aviva PLC (Financials) | 7,921 | ||||||
| 2,763 | BAE Systems PLC (Industrials) | 43,409 | ||||||
| 14,785 | Barclays PLC (Financials) | 30,758 | ||||||
| 2,621 | Barratt Developments PLC (Consumer Discretionary) | 15,466 | ||||||
| 245 | Berkeley Group Holdings PLC (Consumer Discretionary) | 14,389 | ||||||
| 14,095 | BP PLC (Energy) | 82,140 | ||||||
| 1,711 | British American Tobacco PLC (Consumer Staples) | 50,754 | ||||||
| 2,307 | BT Group PLC (Communication Services) | 3,048 | ||||||
| 468 | Bunzl PLC (Industrials) | 18,666 | ||||||
| 2,796 | Burberry Group PLC (Consumer Discretionary) | 45,448 | ||||||
| 28,385 | Centrica PLC (Utilities) | 45,187 | ||||||
| 299 | Coca-Cola Europacific Partners PLC (Consumer Staples) | 20,520 | ||||||
| 1,335 | Compass Group PLC (Consumer Discretionary) | 36,645 | ||||||
| 346 | DCC PLC (Industrials) | 24,580 | ||||||
| 1,562 | Diageo PLC (Consumer Staples) | 58,525 | ||||||
| 22 | Flutter Entertainment PLC (Consumer Discretionary)* | 4,760 | ||||||
| 229 | Halma PLC (Information Technology) | 6,668 | ||||||
| 3,740 | Hargreaves Lansdown PLC (Financials) | 34,460 | ||||||
| 13,989 | HSBC Holdings PLC (Financials) | 108,738 | ||||||
| 1,298 | Imperial Brands PLC (Consumer Staples) | 27,986 | ||||||
| 1,420 | Informa PLC (Communication Services) | 14,553 | ||||||
| 176 | InterContinental Hotels Group PLC (Consumer Discretionary) | 18,656 | ||||||
| 139 | Intertek Group PLC (Industrials) | 8,127 | ||||||
| 6,597 | J Sainsbury PLC (Consumer Staples) | 20,829 | ||||||
| 26,348 | JD Sports Fashion PLC (Consumer Discretionary) | 39,295 | ||||||
| 4,156 | Kingfisher PLC (Consumer Discretionary) | 12,328 | ||||||
| 345 | Land Securities Group PLC REIT (Real Estate) | 2,704 | ||||||
| 9,901 | Legal & General Group PLC (Financials) | 30,321 | ||||||
| 17,035 | Lloyds Banking Group PLC (Financials) | 10,035 | ||||||
| 266 | London Stock Exchange Group PLC (Financials) | 29,866 | ||||||
| 1,378 | M&G PLC (Financials) | 3,917 | ||||||
| 1,303 | Melrose Industries PLC (Industrials) | 10,466 | ||||||
| The accompanying notes are an integral part of these financial statements. | 47 |
GOLDMAN SACHS ACTIVEBETA® EUROPE EQUITY ETF
|
Schedule of Investments (continued)
February 29, 2024 (Unaudited) |
| Shares | Description | Value | ||||||
| Common Stocks – (continued) | ||||||||
| United Kingdom – (continued) | ||||||||
| 2,258 | National Grid PLC (Utilities) | $ | 29,634 | |||||
| 3,693 | NatWest Group PLC (Financials) | 11,169 | ||||||
| 440 | Next PLC (Consumer Discretionary) | 46,274 | ||||||
| 525 | Pearson PLC (Consumer Discretionary) | 6,379 | ||||||
| 1,145 | Phoenix Group Holdings PLC (Financials) | 7,203 | ||||||
| 418 | Reckitt Benckiser Group PLC (Consumer Staples) | 26,427 | ||||||
| 1,528 | RELX PLC (Industrials) | 66,896 | ||||||
| 429 | Rentokil Initial PLC (Industrials) | 2,378 | ||||||
| 5,181 | Rolls-Royce Holdings PLC (Industrials)* | 24,190 | ||||||
| 3,676 | Sage Group PLC (The) (Information Technology) | 57,869 | ||||||
| 865 | Schroders PLC (Financials) | 4,303 | ||||||
| 275 | Severn Trent PLC (Utilities) | 8,697 | ||||||
| 945 | Smith & Nephew PLC (Health Care) | 12,438 | ||||||
| 604 | Smiths Group PLC (Industrials) | 12,286 | ||||||
| 45 | Spirax-Sarco Engineering PLC (Industrials) | 5,877 | ||||||
| 755 | SSE PLC (Utilities) | 15,524 | ||||||
| 1,736 | St James’s Place PLC (Financials) | 11,046 | ||||||
| 1,724 | Standard Chartered PLC (Financials) | 14,559 | ||||||
| 4,962 | Taylor Wimpey PLC (Consumer Discretionary) | 8,652 | ||||||
| 13,533 | Tesco PLC (Consumer Staples) | 47,727 | ||||||
| 1,512 | Unilever PLC (Consumer Staples) | 73,951 | ||||||
| 695 | United Utilities Group PLC (Utilities) | 9,011 | ||||||
| 43,200 | Vodafone Group PLC (Communication Services) | 37,771 | ||||||
| 293 | Whitbread PLC (Consumer Discretionary) | 12,242 | ||||||
| 1,573 | Wise PLC, Class A (Financials)* | 18,262 | ||||||
| 563 | WPP PLC (Communication Services) | 5,036 | ||||||
|
|
|
|||||||
| 1,770,126 | ||||||||
|
|
||||||||
| United States – 9.0% | ||||||||
| 385 | CRH PLC (Materials) | 32,016 | ||||||
| 433 | Experian PLC (Industrials) | 18,540 | ||||||
| 445 | Ferrovial SE (Industrials) | 16,686 | ||||||
| 3,897 | GSK PLC (Health Care) | 82,057 | ||||||
| 3,803 | Haleon PLC (Consumer Staples) | 15,945 | ||||||
| 556 | Holcim AG (Materials)* | 45,526 | ||||||
| 2,156 | Nestle SA (Consumer Staples) | 224,672 | ||||||
| 335 | QIAGEN NV (Health Care)* | 14,368 | ||||||
| 656 | Roche Holding AG (Health Care) | 172,800 | ||||||
| Shares | Description | Value | ||||||
| Common Stocks – (continued) | ||||||||
| United States – (continued) | ||||||||
| 75 | Roche Holding AG (Health | |||||||
| Care) | $ | 20,902 | ||||||
| 1,011 | Sanofi SA (Health Care) | 96,156 | ||||||
| 434 | Schneider Electric SE | |||||||
| (Industrials) | 98,533 | |||||||
| 2,478 | Stellantis NV (Consumer | |||||||
| Discretionary) | 64,720 | |||||||
| 227 | Swiss Re AG (Financials) | 27,481 | ||||||
| 459 | Tenaris SA (Energy) | 8,156 | ||||||
|
|
|
|||||||
| 938,558 | ||||||||
|
|
||||||||
| TOTAL COMMON STOCKS (Cost $9,201,919) |
10,453,569 | |||||||
|
|
||||||||
| Shares | Description | Rate | Value | |||||||
| Preferred Stocks – 0.5% | ||||||||||
| Germany – 0.5% | ||||||||||
| 253 | Bayerische Motoren Werke AG (Consumer Discretionary) | 8.33% | 27,734 | |||||||
| 29 | Dr. Ing hc F Porsche AG (Consumer Discretionary)(b) | 1.16 | 2,709 | |||||||
| 203 | Henkel AG & Co. KGaA (Consumer Staples) | 2.66 | 15,281 | |||||||
| 86 | Porsche Automobil Holding SE (Consumer Discretionary) | 5.18 | 4,596 | |||||||
| 49 | Volkswagen AG (Consumer Discretionary) | 7.00 | 6,646 | |||||||
|
|
||||||||||
|
TOTAL PREFERRED STOCKS (Cost $60,696) |
56,966 | |||||||||
|
|
||||||||||
| 48 | The accompanying notes are an integral part of these financial statements. |
GOLDMAN SACHS ACTIVEBETA® EUROPE EQUITY ETF
| Shares | Dividend Rate | Value | ||||||||||||
| Investment Company – 0.5%(c) |
| |||||||||||||
|
Goldman Sachs Financial Square Treasury Obligations Fund – Institutional Shares |
|
|||||||||||||
| 48,442 | 5.195% | $ 48,442 | ||||||||||||
|
(Cost $48,442) |
|
|||||||||||||
|
|
||||||||||||||
| TOTAL INVESTMENTS BEFORE SECURITIES |
|
|||||||||||||
|
LENDING REINVESTMENT VEHICLE (Cost $9,311,057) |
|
10,558,977 | ||||||||||||
|
|
||||||||||||||
| Securities Lending Reinvestment Vehicle – 0.2%(c) |
| |||||||||||||
|
Goldman Sachs Financial Square Government Fund - Institutional Shares |
|
|||||||||||||
| 22,539 | 5.219% | 22,539 | ||||||||||||
| (Cost $22,539) |
|
|||||||||||||
|
|
||||||||||||||
| Shares | Dividend Rate | Value | ||||||
| Securities Lending Reinvestment Vehicle –0.2%(c) –(continued) |
| |||||||
|
TOTAL INVESTMENTS – 100.3% (Cost $9,333,596) |
$ | 10,581,516 | ||||||
|
|
||||||||
|
LIABILITIES IN EXCESS OF OTHER ASSETS – (0.3)% |
(26,755 | ) | ||||||
|
|
||||||||
|
NET ASSETS – 100.0% |
$ | 10,554,761 | ||||||
|
|
||||||||
| The percentage shown for each investment category reflects the value of investments in that category as a percentage of net assets. | ||
| * | Non-income producing security. | |
| (a) | All or a portion of security is on loan. | |
| (b) | Exempt from registration under Rule 144A of the Securities Act of 1933. | |
| (c) | Represents an affiliated issuer. | |
|
| ||
| Investment Abbreviations: | ||
| PLC | —Public Limited Company | |
| REIT | —Real Estate Investment Trust | |
|
| ||
|
ADDITIONAL INVESTMENT INFORMATION |
FUTURES CONTRACTS — At February 29, 2024, the Fund had the following futures contracts:
| Description | Number of Contracts |
Expiration Date |
Notional Amount |
Unrealized Appreciation/ (Depreciation) |
||||||||
|
|
||||||||||||
|
Long position contracts: |
||||||||||||
|
MSCI EUROPE MAR24 |
1 | 03/15/24 | $ | 34,770 | $ | 1,537 | ||||||
|
|
||||||||||||
| The accompanying notes are an integral part of these financial statements. | 49 |
GOLDMAN SACHS ACTIVEBETA® INTERNATIONAL EQUITY ETF
|
Schedule of Investments
February 29, 2024 (Unaudited) |
|
Shares |
Description | Value | ||||||
| Common Stocks – 99.4% |
| |||||||
| Australia – 5.9% |
| |||||||
| 76,241 | Ampol Ltd. (Energy) | $ | 1,955,987 | |||||
| 437,445 | ANZ Group Holdings Ltd. (Financials) | 8,103,766 | ||||||
| 217,375 | APA Group (Utilities) | 1,111,119 | ||||||
| 88,849 | Aristocrat Leisure Ltd. (Consumer Discretionary) | 2,697,734 | ||||||
| 33,546 | ASX Ltd. (Financials) | 1,436,646 | ||||||
| 540,462 | Aurizon Holdings Ltd. (Industrials) | 1,340,823 | ||||||
| 635,208 | BHP Group Ltd. (Materials) | 18,170,143 | ||||||
| 722,154 | BlueScope Steel Ltd. (Materials) | 10,740,070 | ||||||
| 336,897 | Brambles Ltd. (Industrials) | 3,305,914 | ||||||
| 78,604 | CAR Group Ltd. (Communication Services) | 1,881,487 | ||||||
| 39,799 | Cochlear Ltd. (Health Care) | 9,074,700 | ||||||
| 665,155 | Coles Group Ltd. (Consumer Staples) | 7,319,657 | ||||||
| 233,600 | Commonwealth Bank of Australia (Financials) | 17,706,972 | ||||||
| 45,947 | Computershare Ltd. (Industrials) | 775,485 | ||||||
| 154,356 | Dexus REIT (Real Estate) | 739,746 | ||||||
| 265,843 | Endeavour Group Ltd. (Consumer Staples) | 952,070 | ||||||
| 247,921 | Fortescue Ltd. (Materials) | 4,185,979 | ||||||
| 1,092,011 | Glencore PLC (Materials) | 5,182,098 | ||||||
| 90,039 | Goodman Group REIT (Real Estate) | 1,753,004 | ||||||
| 254,462 | GPT Group (The) REIT (Real Estate) | 720,764 | ||||||
| 552,383 | IDP Education Ltd. (Consumer Discretionary)(a) | 6,866,373 | ||||||
| 422,855 | Insurance Australia Group Ltd. (Financials) | 1,707,121 | ||||||
| 1,972,964 | Lottery Corp. Ltd. (The) (Consumer Discretionary) | 6,526,255 | ||||||
| 37,826 | Macquarie Group Ltd. (Financials) | 4,798,250 | ||||||
| 1,042,609 | Medibank Pvt Ltd. (Financials) | 2,437,233 | ||||||
| 442,574 | National Australia Bank Ltd. (Financials) | 9,752,084 | ||||||
| 208,064 | Northern Star Resources Ltd. (Materials) | 1,747,704 | ||||||
| 132,655 | Orica Ltd. (Materials) | 1,477,933 | ||||||
| 176,319 | Origin Energy Ltd. (Utilities) | 1,032,143 | ||||||
| 1,556,098 | Pilbara Minerals Ltd. (Materials)(a) |
4,255,665 | ||||||
| 208,444 | QBE Insurance Group Ltd. (Financials) | 2,346,743 | ||||||
| 28,533 | REA Group Ltd. (Communication Services) | 3,606,422 | ||||||
| 103,064 | Reece Ltd. (Industrials) | 1,803,250 | ||||||
| 48,485 | Rio Tinto Ltd. (Materials) | 3,907,860 | ||||||
| 95,755 | Rio Tinto PLC (Materials) | 6,151,958 | ||||||
| 486,661 | Santos Ltd. (Energy) | 2,243,577 | ||||||
| 63,866 | Seven Group Holdings Ltd. (Industrials) | 1,601,491 | ||||||
|
Shares |
Description | Value | ||||||
| Common Stocks – (continued) |
| |||||||
| Australia – (continued) |
| |||||||
| 97,649 | Sonic Healthcare Ltd. (Health Care) | $ | 1,897,987 | |||||
| 306,914 | Stockland REIT (Real Estate) | 897,313 | ||||||
| 386,270 | Suncorp Group Ltd. (Financials) | 3,848,253 | ||||||
| 1,046,859 | Telstra Group Ltd. (Communication Services) | 2,603,950 | ||||||
| 250,756 | Transurban Group (Industrials) | 2,210,809 | ||||||
| 724,823 | Vicinity Ltd. REIT (Real Estate) | 915,619 | ||||||
| 114,251 | Washington H Soul Pattinson & Co. Ltd. (Financials) | 2,569,588 | ||||||
| 272,946 | Wesfarmers Ltd. (Consumer Discretionary) | 11,843,850 | ||||||
| 469,084 | Westpac Banking Corp. (Financials) | 8,048,453 | ||||||
| 28,515 | WiseTech Global Ltd. (Information Technology) | 1,754,262 | ||||||
| 133,492 | Woodside Energy Group Ltd. (Energy) | 2,638,993 | ||||||
| 425,823 | Woolworths Group Ltd. (Consumer Staples) | 9,044,702 | ||||||
|
|
|
|||||||
| 209,690,005 | ||||||||
|
|
||||||||
| Austria – 0.3% |
| |||||||
| 48,140 | Erste Group Bank AG (Financials) | 1,922,295 | ||||||
| 47,220 | Mondi PLC (Materials) | 841,311 | ||||||
| 16,289 | OMV AG (Energy) | 718,130 | ||||||
| 298,920 | voestalpine AG (Materials) | 8,164,544 | ||||||
|
|
|
|||||||
| 11,646,280 | ||||||||
|
|
||||||||
| Belgium – 0.7% |
| |||||||
| 110,940 | Ageas SA/NV (Financials) | 4,706,107 | ||||||
| 102,356 | Anheuser-Busch InBev SA/NV (Consumer Staples) | 6,171,803 | ||||||
| 8,348 | Elia Group SA/NV (Utilities) | 927,770 | ||||||
| 22,869 | Groupe Bruxelles Lambert NV (Financials) | 1,716,005 | ||||||
| 27,283 | KBC Group NV (Financials) | 1,916,128 | ||||||
| 132 | Lotus Bakeries NV (Consumer Staples) | 1,242,742 | ||||||
| 34,119 | Syensqo SA (Materials)* | 3,050,117 | ||||||
| 46,294 | UCB SA (Health Care) | 5,335,338 | ||||||
|
|
|
|||||||
| 25,066,010 | ||||||||
|
|
||||||||
| Brazil – 0.1% |
| |||||||
| 28,631 | Wheaton Precious Metals Corp. (Materials) | 1,180,618 | ||||||
| 26,784 | Yara International ASA (Materials) | 833,901 | ||||||
|
|
|
|||||||
| 2,014,519 | ||||||||
|
|
||||||||
| Canada – 11.2% |
| |||||||
| 21,201 | Agnico Eagle Mines Ltd. (Materials) | 1,017,417 | ||||||
| 127,597 | Air Canada (Industrials)* | 1,704,617 | ||||||
| 188,180 | Alimentation Couche-Tard, Inc. (Consumer Staples) | 11,677,746 | ||||||
| 46,363 | AltaGas Ltd. (Utilities) | 994,360 | ||||||
| 387,668 | ARC Resources Ltd. (Energy) | 6,610,949 | ||||||
| 86,999 | Bank of Montreal (Financials) | 7,879,203 | ||||||
| 50 | The accompanying notes are an integral part of these financial statements. |
GOLDMAN SACHS ACTIVEBETA® INTERNATIONAL EQUITY ETF
|
Shares |
Description | Value | ||||||
| Common Stocks – (continued) |
| |||||||
| Canada – (continued) |
| |||||||
| 161,284 | Bank of Nova Scotia (The) (Financials) | $ | 7,825,488 | |||||
| 31,402 | BCE, Inc. (Communication Services) | 1,165,927 | ||||||
| 75,376 | Brookfield Asset Management Ltd., Class A (Financials)(a) | 3,073,725 | ||||||
| 35,308 | Brookfield Corp. (Financials) | 1,457,771 | ||||||
| 73,553 | Cameco Corp. (Energy) | 2,982,575 | ||||||
| 31,830 | Canadian Apartment Properties REIT (Real Estate) | 1,117,283 | ||||||
| 134,375 | Canadian Imperial Bank of Commerce (Financials) | 6,362,342 | ||||||
| 33,400 | Canadian National Railway Co. (Industrials) | 4,333,246 | ||||||
| 152,836 | Canadian Natural Resources Ltd. (Energy) | 10,652,940 | ||||||
| 56,427 | Canadian Pacific Kansas City Ltd. (Industrials) | 4,793,809 | ||||||
| 33,974 | Canadian Tire Corp. Ltd., Class A (Consumer Discretionary) | 3,459,144 | ||||||
| 55,418 | Canadian Utilities Ltd., Class A (Utilities) | 1,248,626 | ||||||
| 32,119 | CCL Industries, Inc., Class B (Materials) | 1,638,215 | ||||||
| 640,609 | Cenovus Energy, Inc. (Energy) | 11,169,980 | ||||||
| 81,222 | CGI, Inc. (Information Technology)* | 9,330,934 | ||||||
| 8,961 | Constellation Software, Inc. (Information Technology) | 24,962,696 | ||||||
| 21,171 | Descartes Systems Group, Inc. (The) (Information Technology)* | 1,836,063 | ||||||
| 153,428 | Dollarama, Inc. (Consumer Discretionary) | 11,875,159 | ||||||
| 46,689 | Element Fleet Management Corp. (Industrials) | 779,670 | ||||||
| 40,839 | Emera, Inc. (Utilities) | 1,433,211 | ||||||
| 491,972 | Empire Co. Ltd. (Consumer Staples) | 12,473,858 | ||||||
| 178,721 | Enbridge, Inc. (Energy) | 6,146,890 | ||||||
| 11,788 | Fairfax Financial Holdings Ltd. (Financials) | 12,589,655 | ||||||
| 23,934 | FirstService Corp. (Real Estate) | 3,941,033 | ||||||
| 46,824 | Fortis, Inc. (Utilities) | 1,806,540 | ||||||
| 8,707 | Franco-Nevada Corp. (Materials) | 912,137 | ||||||
| 96,683 | George Weston Ltd. (Consumer Staples) | 12,671,044 | ||||||
| 26,589 | GFL Environmental, Inc. (Industrials) | 959,192 | ||||||
| 132,299 | Great-West Lifeco, Inc. (Financials)(a) |
4,077,191 | ||||||
| 67,776 | Hydro One Ltd. (Utilities)(b) | 2,021,262 | ||||||
| 78,880 | iA Financial Corp., Inc. (Financials) | 4,894,416 | ||||||
| 59,753 | IGM Financial, Inc. (Financials) | 1,570,534 | ||||||
| 116,419 | Imperial Oil Ltd. (Energy)(a) | 7,288,901 | ||||||
|
Shares |
Description | Value | ||||||
| Common Stocks – (continued) |
| |||||||
| Canada – (continued) |
| |||||||
| 23,206 | Intact Financial Corp. (Financials) | $ | 3,861,194 | |||||
| 48,763 | Keyera Corp. (Energy) | 1,200,425 | ||||||
| 203,570 | Kinross Gold Corp. (Materials) | 996,575 | ||||||
| 166,977 | Loblaw Cos. Ltd. (Consumer Staples) | 17,806,284 | ||||||
| 457,519 | Manulife Financial Corp. (Financials)(a) | 10,864,959 | ||||||
| 154,338 | MEG Energy Corp. (Energy)* | 3,305,577 | ||||||
| 69,057 | Metro, Inc. (Consumer Staples) | 3,741,150 | ||||||
| 76,159 | National Bank of Canada (Financials) | 5,947,965 | ||||||
| 93,724 | Nutrien Ltd. (Materials) | 4,895,055 | ||||||
| 20,613 | Onex Corp. (Financials) | 1,536,002 | ||||||
| 37,855 | Open Text Corp. (Information Technology) | 1,456,595 | ||||||
| 155,717 | Parkland Corp. (Energy) | 4,983,725 | ||||||
| 64,612 | Pembina Pipeline Corp. (Energy) | 2,249,880 | ||||||
| 240,753 | Power Corp. of Canada (Financials) | 6,959,800 | ||||||
| 65,901 | Quebecor, Inc., Class B (Communication Services) | 1,542,152 | ||||||
| 23,910 | RB Global, Inc. (Industrials) | 1,804,951 | ||||||
| 49,044 | Restaurant Brands International, Inc. (Consumer Discretionary) | 3,810,415 | ||||||
| 38,547 | Rogers Communications, Inc., Class B (Communication Services) | 1,706,885 | ||||||
| 224,587 | Royal Bank of Canada (Financials) | 21,823,693 | ||||||
| 129,942 | Saputo, Inc. (Consumer Staples) | 2,645,113 | ||||||
| 93,830 | Shopify, Inc., Class A (Information Technology)* | 7,173,099 | ||||||
| 62,426 | Stantec, Inc. (Industrials) | 5,215,552 | ||||||
| 101,238 | Sun Life Financial, Inc. (Financials)(a) | 5,380,053 | ||||||
| 294,912 | Suncor Energy, Inc. (Energy)(a) | 10,138,789 | ||||||
| 47,669 | TC Energy Corp. (Energy) | 1,886,587 | ||||||
| 81,623 | TELUS Corp. (Communication Services) | 1,424,423 | ||||||
| 15,344 | TFI International, Inc. (Industrials) | 2,268,425 | ||||||
| 30,380 | Thomson Reuters Corp. (Industrials) | 4,798,622 | ||||||
| 130,929 | TMX Group Ltd. (Financials) | 3,436,482 | ||||||
| 31,039 | Toromont Industries Ltd. (Industrials) | 2,852,517 | ||||||
| 265,899 | Toronto-Dominion Bank (The) (Financials) | 15,975,308 | ||||||
| 42,021 | Tourmaline Oil Corp. (Energy) | 1,902,849 | ||||||
| 15,230 | West Fraser Timber Co. Ltd. (Materials) | 1,226,395 | ||||||
| 89,933 | WSP Global, Inc. (Industrials) | 14,283,457 | ||||||
|
|
|
|||||||
| 393,836,702 | ||||||||
|
|
||||||||
| China – 0.7% |
| |||||||
| 1,685,997 | BOC Hong Kong Holdings Ltd. (Financials) | 4,447,149 | ||||||
| The accompanying notes are an integral part of these financial statements. | 51 |
GOLDMAN SACHS ACTIVEBETA® INTERNATIONAL EQUITY ETF
|
Schedule of Investments (continued)
February 29, 2024 (Unaudited) |
|
Shares |
Description | Value | ||||||
| Common Stocks – (continued) |
| |||||||
| China – (continued) |
| |||||||
| 40,375 | Prosus NV (Consumer Discretionary)* | $ | 1,179,242 | |||||
| 3,804,909 | SITC International Holdings Co. Ltd. (Industrials) | 6,259,864 | ||||||
| 527,577 | Wharf Holdings Ltd. (The) (Real Estate) | 1,950,919 | ||||||
| 3,657,026 | Wilmar International Ltd. (Consumer Staples) | 9,029,694 | ||||||
|
|
|
|||||||
| 22,866,868 | ||||||||
|
|
||||||||
| Denmark – 3.0% |
| |||||||
| 991 | AP Moller – Maersk A/S, Class A (Industrials)(a) | 1,345,158 | ||||||
| 1,003 | AP Moller – Maersk A/S, Class B (Industrials)(a) | 1,419,107 | ||||||
| 26,775 | Carlsberg AS, Class B (Consumer Staples) | 3,735,432 | ||||||
| 16,280 | Coloplast A/S, Class B (Health Care) | 2,163,954 | ||||||
| 122,660 | Danske Bank A/S (Financials) | 3,605,919 | ||||||
| 57,184 | Demant A/S (Health Care)* | 2,864,886 | ||||||
| 10,229 | DSV A/S (Industrials) | 1,642,390 | ||||||
| 8,652 | Genmab A/S (Health Care)* | 2,424,163 | ||||||
| 593,846 | Novo Nordisk A/S, Class B (Health Care) | 70,667,010 | ||||||
| 46,172 | Novozymes A/S, Class B (Materials) | 2,606,111 | ||||||
| 56,054 | Pandora A/S (Consumer Discretionary) | 9,057,112 | ||||||
| 4,898 | ROCKWOOL A/S, Class B (Industrials) | 1,567,889 | ||||||
| 118,650 | Tryg A/S (Financials) | 2,523,442 | ||||||
|
|
|
|||||||
| 105,622,573 | ||||||||
|
|
||||||||
| Finland – 0.6% |
| |||||||
| 32,985 | Elisa OYJ (Communication Services) | 1,487,042 | ||||||
| 71,055 | Fortum OYJ (Utilities) | 888,105 | ||||||
| 25,001 | Kone OYJ, Class B (Industrials) | 1,223,420 | ||||||
| 812,462 | Nokia OYJ (Information Technology) | 2,865,772 | ||||||
| 240,732 | Nordea Bank Abp (Financials) | 2,928,112 | ||||||
| 180,305 | Orion OYJ, Class B (Health Care) | 7,102,263 | ||||||
| 65,756 | Sampo OYJ, Class A (Financials) | 2,943,802 | ||||||
| 45,059 | UPM-Kymmene OYJ (Materials) | 1,508,166 | ||||||
| 79,715 | Wartsila OYJ Abp (Industrials) | 1,233,138 | ||||||
|
|
|
|||||||
| 22,179,820 | ||||||||
|
|
||||||||
| France – 10.3% |
| |||||||
| 54,492 | Accor SA (Consumer Discretionary) | 2,364,049 | ||||||
| 8,377 | Aeroports de Paris SA (Industrials) | 1,139,492 | ||||||
| 50,122 | Air Liquide SA (Materials) | 10,191,610 | ||||||
| 48,776 | Airbus SE (Industrials) | 8,072,627 | ||||||
| 10,603 | Amundi SA (Financials)(b) | 698,195 | ||||||
|
Shares |
Description | Value | ||||||
| Common Stocks – (continued) |
| |||||||
| France – (continued) |
| |||||||
| 31,463 | Arkema SA (Materials) | $ | 3,260,407 | |||||
| 355,344 | AXA SA (Financials) | 12,643,532 | ||||||
| 44,271 | BioMerieux (Health Care) | 4,843,486 | ||||||
| 153,988 | BNP Paribas SA (Financials) | 9,228,422 | ||||||
| 290,182 | Bollore SE (Communication Services) | 1,990,890 | ||||||
| 102,214 | Bouygues SA (Industrials) | 4,045,041 | ||||||
| 77,572 | Bureau Veritas SA (Industrials) | 2,255,590 | ||||||
| 43,155 | Capgemini SE (Information Technology) | 10,493,535 | ||||||
| 484,453 | Carrefour SA (Consumer Staples) | 8,141,618 | ||||||
| 176,420 | Cie de Saint-Gobain SA (Industrials) | 13,593,003 | ||||||
| 72,494 | Cie Generale des Etablissements Michelin SCA (Consumer Discretionary) | 2,682,185 | ||||||
| 400,659 | Credit Agricole SA (Financials) | 5,428,337 | ||||||
| 101,021 | Danone SA (Consumer Staples) | 6,452,061 | ||||||
| 16,857 | Dassault Aviation SA (Industrials) | 3,336,427 | ||||||
| 110,901 | Dassault Systemes (Information Technology) | 5,182,699 | ||||||
| 53,350 | Edenred SE (Financials) | 2,643,581 | ||||||
| 110,955 | Eiffage SA (Industrials) | 12,085,045 | ||||||
| 379,889 | Engie SA (Utilities) | 6,099,035 | ||||||
| 41,692 | EssilorLuxottica SA (Health Care) | 8,850,153 | ||||||
| 103,415 | Eurazeo SE (Financials) | 8,740,216 | ||||||
| 8,496 | Gecina SA REIT (Real Estate) | 821,020 | ||||||
| 105,945 | Getlink SE (Industrials) | 1,810,299 | ||||||
| 7,681 | Hermes International SCA (Consumer Discretionary) | 19,225,649 | ||||||
| 120,674 | Ipsen SA (Health Care) | 13,293,799 | ||||||
| 10,844 | Kering (Consumer Discretionary) | 4,987,893 | ||||||
| 41,740 | Klepierre SA REIT (Real Estate) | 1,060,567 | ||||||
| 234,583 | La Francaise des Jeux SAEM (Consumer Discretionary)(b) | 9,829,230 | ||||||
| 37,610 | Legrand SA (Industrials) | 3,805,420 | ||||||
| 51,390 | L’Oreal SA (Consumer Staples) | 24,563,691 | ||||||
| 48,082 | LVMH Moet Hennessy Louis Vuitton SE (Consumer Discretionary) | 43,852,531 | ||||||
| 302,220 | Orange SA (Communication Services) | 3,468,666 | ||||||
| 13,071 | Pernod Ricard SA (Consumer Staples) | 2,186,077 | ||||||
| 55,314 | Publicis Groupe SA (Communication Services) | 5,852,922 | ||||||
| 146,571 | Rexel SA (Industrials) | 3,759,101 | ||||||
| 38,935 | Safran SA (Industrials) | 8,161,264 | ||||||
| 95,470 | SEB SA (Consumer Discretionary) | 11,302,431 | ||||||
| 116,182 | Societe Generale SA (Financials) | 2,820,043 | ||||||
| 52 | The accompanying notes are an integral part of these financial statements. |
GOLDMAN SACHS ACTIVEBETA® INTERNATIONAL EQUITY ETF
|
Shares |
Description | Value | ||||||
| Common Stocks – (continued) |
| |||||||
| France – (continued) |
| |||||||
| 20,485 | Sodexo SA (Consumer Discretionary) | $ | 1,633,771 | |||||
| 24,293 | Thales SA (Industrials) | 3,602,863 | ||||||
| 383,448 | TotalEnergies SE (Energy) | 24,477,806 | ||||||
| 93,108 | Veolia Environnement SA (Utilities) | 2,886,684 | ||||||
| 86,151 | Vinci SA (Industrials) | 11,038,235 | ||||||
| 147,631 | Vivendi SE (Communication Services) | 1,650,310 | ||||||
| 145,696 | Worldline SA (Financials)*(b) | 1,675,190 | ||||||
|
|
|
|||||||
| 362,226,698 | ||||||||
|
|
||||||||
| Germany – 7.4% |
| |||||||
| 47,530 | adidas AG (Consumer Discretionary) | 9,624,444 | ||||||
| 46,606 | Allianz SE (Financials) | 12,802,848 | ||||||
| 52,902 | BASF SE (Materials) | 2,694,946 | ||||||
| 157,592 | Bayer AG (Health Care) | 4,790,419 | ||||||
| 71,556 | Bayerische Motoren Werke AG (Consumer Discretionary) | 8,457,380 | ||||||
| 65,561 | Bechtle AG (Information Technology) | 3,381,327 | ||||||
| 40,437 | Beiersdorf AG (Consumer Staples) | 5,800,244 | ||||||
| 44,881 | Brenntag SE (Industrials) | 4,098,167 | ||||||
| 10,770 | Carl Zeiss Meditec AG (Health Care) | 1,325,729 | ||||||
| 438,935 | Commerzbank AG (Financials) | 5,080,057 | ||||||
| 18,496 | Covestro AG (Materials)*(b) | 1,006,777 | ||||||
| 31,642 | Daimler Truck Holding AG (Industrials) | 1,293,640 | ||||||
| 546,459 | Deutsche Bank AG (Financials) | 7,310,279 | ||||||
| 27,827 | Deutsche Boerse AG (Financials) | 5,829,876 | ||||||
| 970,881 | Deutsche Lufthansa AG (Industrials)* | 7,551,995 | ||||||
| 312,582 | Deutsche Post AG (Industrials) | 14,514,768 | ||||||
| 420,231 | Deutsche Telekom AG (Communication Services) | 9,997,747 | ||||||
| 774,498 | E.ON SE (Utilities) | 9,898,236 | ||||||
| 49,873 | Evonik Industries AG (Materials) | 920,730 | ||||||
| 157,195 | Fresenius Medical Care AG (Health Care) | 6,018,443 | ||||||
| 160,394 | Fresenius SE & Co. KGaA (Health Care) | 4,492,003 | ||||||
| 47,283 | GEA Group AG (Industrials) | 1,907,006 | ||||||
| 16,393 | Hannover Rueck SE (Financials) | 4,209,629 | ||||||
| 97,087 | Heidelberg Materials AG (Materials) | 9,424,127 | ||||||
| 28,064 | Henkel AG & Co. KGaA (Consumer Staples) | 1,895,055 | ||||||
| 66,830 | Infineon Technologies AG (Information Technology) | 2,393,434 | ||||||
| 38,701 | Knorr-Bremse AG (Industrials) | 2,708,818 | ||||||
| 136,093 | Mercedes-Benz Group AG (Consumer Discretionary) | 10,845,190 | ||||||
| 25,095 | Merck KGaA (Health Care) | 4,285,306 | ||||||
|
Shares |
Description | Value | ||||||
| Common Stocks – (continued) |
| |||||||
| Germany – (continued) |
| |||||||
| 3,379 | MTU Aero Engines AG (Industrials) | $ | 812,859 | |||||
| 18,689 | Muenchener Rueckversicherungs- Gesellschaft AG in Muenchen (Financials) | 8,704,542 | ||||||
| 95,163 | Nemetschek SE (Information Technology) | 9,080,836 | ||||||
| 88,953 | Puma SE (Consumer Discretionary) | 4,088,184 | ||||||
| 8,273 | Rational AG (Industrials) | 6,803,999 | ||||||
| 11,323 | Rheinmetall AG (Industrials) | 5,195,352 | ||||||
| 55,103 | RWE AG (Utilities) | 1,848,522 | ||||||
| 147,637 | SAP SE (Information Technology) | 27,620,248 | ||||||
| 23,127 | Scout24 SE (Communication Services)(b) | 1,681,807 | ||||||
| 81,180 | Siemens AG (Industrials) | 16,071,090 | ||||||
| 252,297 | Siemens Energy AG (Industrials)* | 3,878,296 | ||||||
| 25,766 | Siemens Healthineers AG (Health Care)(b) | 1,547,489 | ||||||
| 15,310 | Symrise AG (Materials) | 1,566,644 | ||||||
| 52,799 | Talanx AG (Financials) | 3,771,006 | ||||||
| 205,432 | Zalando SE (Consumer Discretionary)*(b) | 4,339,458 | ||||||
|
|
|
|||||||
| 261,568,952 | ||||||||
|
|
||||||||
| Hong Kong – 1.1% |
| |||||||
| 591,241 | AIA Group Ltd. (Financials) | 4,803,153 | ||||||
| 241,189 | CK Asset Holdings Ltd. (Real Estate) | 1,113,706 | ||||||
| 134,701 | CK Infrastructure Holdings Ltd. (Utilities) | 792,328 | ||||||
| 193,186 | CLP Holdings Ltd. (Utilities) | 1,610,130 | ||||||
| 22,067 | Futu Holdings Ltd. ADR (Financials)* | 1,181,026 | ||||||
| 79,673 | Hang Seng Bank Ltd. (Financials) | 909,816 | ||||||
| 1,303,757 | HKT Trust & HKT Ltd. (Communication Services) | 1,590,394 | ||||||
| 1,011,446 | Hong Kong & China Gas Co. Ltd. (Utilities) | 782,925 | ||||||
| 173,667 | Hong Kong Exchanges & Clearing Ltd. (Financials) | 5,386,055 | ||||||
| 471,068 | Hongkong Land Holdings Ltd. (Real Estate) | 1,592,210 | ||||||
| 75,235 | Jardine Matheson Holdings Ltd. (Industrials) | 3,153,099 | ||||||
| 222,905 | MTR Corp. Ltd. (Industrials) | 740,283 | ||||||
| 270,001 | Power Assets Holdings Ltd. (Utilities) | 1,624,393 | ||||||
| 126,615 | Sun Hung Kai Properties Ltd. (Real Estate) | 1,276,857 | ||||||
| 175,647 | Swire Pacific Ltd., Class A (Real Estate) | 1,456,097 | ||||||
| 412,355 | Techtronic Industries Co. Ltd. (Industrials) | 4,463,914 | ||||||
| The accompanying notes are an integral part of these financial statements. | 53 |
GOLDMAN SACHS ACTIVEBETA® INTERNATIONAL EQUITY ETF
|
Schedule of Investments (continued)
February 29, 2024 (Unaudited) |
|
Shares |
Description | Value | ||||||
| Common Stocks – (continued) |
| |||||||
| Hong Kong – (continued) |
| |||||||
| 13,946,596 | WH Group Ltd. (Consumer Staples)(b) | $ | 8,408,432 | |||||
|
|
|
|||||||
| 40,884,818 | ||||||||
|
|
||||||||
| Ireland – 0.3% |
| |||||||
| 17,509 | AerCap Holdings NV (Industrials)* | 1,351,345 | ||||||
| 17,083 | Kerry Group PLC, Class A (Consumer Staples) | 1,499,984 | ||||||
| 25,977 | Kingspan Group PLC (Industrials) | 2,346,708 | ||||||
| 84,719 | Smurfit Kappa Group PLC (Materials) | 3,614,891 | ||||||
|
|
|
|||||||
| 8,812,928 | ||||||||
|
|
||||||||
| Israel – 0.9% |
| |||||||
| 209,371 | Bank Hapoalim BM (Financials) | 2,003,668 | ||||||
| 200,258 | Bank Leumi Le-Israel BM (Financials) | 1,677,601 | ||||||
| 29,301 | Check Point Software Technologies Ltd. (Information Technology)* | 4,700,466 | ||||||
| 4,659 | Elbit Systems Ltd. (Industrials) | 1,035,739 | ||||||
| 219,037 | ICL Group Ltd. (Materials) | 1,158,475 | ||||||
| 301,282 | Israel Discount Bank Ltd., Class A (Financials) | 1,570,688 | ||||||
| 27,438 | Mizrahi Tefahot Bank Ltd. (Financials) | 1,085,505 | ||||||
| 814,545 | Teva Pharmaceutical Industries Ltd. ADR (Health Care)* | 10,711,267 | ||||||
| 50,250 | Wix.com Ltd. (Information Technology)* | 7,044,045 | ||||||
|
|
|
|||||||
| 30,987,454 | ||||||||
|
|
||||||||
| Italy – 2.9% |
| |||||||
| 437,439 | Assicurazioni Generali SpA (Financials) | 10,376,375 | ||||||
| 333,698 | Banco BPM SpA (Financials) | 1,940,613 | ||||||
| 115,298 | Coca-Cola HBC AG (Consumer Staples)* | 3,595,112 | ||||||
| 116,191 | Davide Campari-Milano NV (Consumer Staples) | 1,178,399 | ||||||
| 8,713 | DiaSorin SpA (Health Care) | 880,459 | ||||||
| 818,153 | Enel SpA (Utilities) | 5,208,600 | ||||||
| 564,003 | Eni SpA (Energy) | 8,696,068 | ||||||
| 31,212 | Ferrari NV (Consumer Discretionary) | 13,169,292 | ||||||
| 284,768 | FinecoBank Banca Fineco SpA (Financials) | 3,938,308 | ||||||
| 94,561 | Infrastrutture Wireless Italiane SpA
(Communication Services)(b) |
1,047,340 | ||||||
| 1,468,877 | Intesa Sanpaolo SpA (Financials) | 4,670,085 | ||||||
| 489,500 | Leonardo SpA (Industrials) | 10,464,472 | ||||||
| 175,437 | Mediobanca Banca di Credito Finanziario SpA (Financials) | 2,391,151 | ||||||
|
Shares |
Description | Value | ||||||
| Common Stocks – (continued) |
| |||||||
| Italy – (continued) |
| |||||||
| 119,916 | Moncler SpA (Consumer Discretionary) | $ | 8,650,278 | |||||
| 395,428 | Poste Italiane SpA (Financials)(b) | 4,638,572 | ||||||
| 101,112 | Prysmian SpA (Industrials) | 5,038,717 | ||||||
| 89,818 | Recordati Industria Chimica e Farmaceutica SpA (Health Care) | 5,030,895 | ||||||
| 342,040 | Snam SpA (Utilities) | 1,599,369 | ||||||
| 199,814 | Terna - Rete Elettrica Nazionale (Utilities) | 1,566,361 | ||||||
| 275,508 | UniCredit SpA (Financials) | 9,215,541 | ||||||
|
|
|
|||||||
| 103,296,007 | ||||||||
|
|
||||||||
| Japan – 20.7% |
| |||||||
| 257,407 | Advantest Corp. (Information Technology) | 11,884,027 | ||||||
| 111,161 | Aeon Co. Ltd. (Consumer Staples)(a) | 2,655,179 | ||||||
| 32,665 | AGC, Inc. (Industrials) | 1,168,275 | ||||||
| 101,879 | Aisin Corp. (Consumer Discretionary) | 3,843,861 | ||||||
| 79,742 | Ajinomoto Co., Inc. (Consumer Staples) | 2,931,918 | ||||||
| 58,908 | ANA Holdings, Inc. (Industrials)*(a) | 1,284,664 | ||||||
| 116,408 | Asahi Group Holdings Ltd. (Consumer Staples) | 3,992,265 | ||||||
| 46,017 | Asahi Intecc Co. Ltd. (Health Care) | 956,497 | ||||||
| 148,897 | Asahi Kasei Corp. (Materials) | 1,036,121 | ||||||
| 559,607 | Astellas Pharma, Inc. (Health Care) | 6,174,858 | ||||||
| 42,399 | Azbil Corp. (Information Technology) | 1,243,897 | ||||||
| 197,726 | Bandai Namco Holdings, Inc. (Consumer Discretionary) | 3,821,884 | ||||||
| 86,055 | Bridgestone Corp. (Consumer Discretionary) | 3,706,224 | ||||||
| 235,004 | Brother Industries Ltd. (Information Technology) | 3,940,286 | ||||||
| 146,824 | Canon, Inc. (Information Technology) | 4,293,771 | ||||||
| 167,618 | Capcom Co. Ltd. (Communication Services) | 6,751,980 | ||||||
| 54,035 | Central Japan Railway Co. (Industrials) | 1,360,713 | ||||||
| 144,103 | Chubu Electric Power Co., Inc. (Utilities) | 1,797,075 | ||||||
| 113,508 | Chugai Pharmaceutical Co. Ltd. (Health Care) | 4,550,331 | ||||||
| 259,807 | Concordia Financial Group Ltd. (Financials) | 1,315,786 | ||||||
| 23,096 | Dai Nippon Printing Co. Ltd. (Industrials) | 673,884 | ||||||
| 92,444 | Dai-ichi Life Holdings, Inc. (Financials) | 2,104,959 | ||||||
| 194,582 | Daiichi Sankyo Co. Ltd. (Health Care) | 6,466,566 | ||||||
| 54 | The accompanying notes are an integral part of these financial statements. |
GOLDMAN SACHS ACTIVEBETA® INTERNATIONAL EQUITY ETF
|
Shares |
Description | Value | ||||||
| Common Stocks – (continued) |
| |||||||
| Japan – (continued) |
| |||||||
| 17,789 | Daikin Industries Ltd. (Industrials) | $ | 2,516,751 | |||||
| 28,491 | Daito Trust Construction Co. Ltd. (Real Estate) | 3,381,724 | ||||||
| 93,388 | Daiwa House Industry Co. Ltd. (Real Estate) | 2,701,744 | ||||||
| 257,531 | Daiwa Securities Group, Inc. (Financials) | 1,896,166 | ||||||
| 128,522 | Denso Corp. (Consumer Discretionary) | 2,364,867 | ||||||
| 98,747 | Dentsu Group, Inc. (Communication Services) | 2,736,704 | ||||||
| 15,238 | Disco Corp. (Information Technology) | 4,913,382 | ||||||
| 41,305 | East Japan Railway Co. (Industrials) | 2,446,508 | ||||||
| 112,204 | Eisai Co. Ltd. (Health Care) | 4,688,473 | ||||||
| 1,107,663 | ENEOS Holdings, Inc. (Energy) | 4,783,073 | ||||||
| 32,025 | FANUC Corp. (Industrials) | 935,480 | ||||||
| 27,336 | Fast Retailing Co. Ltd. (Consumer Discretionary) | 7,901,085 | ||||||
| 56,753 | FUJIFILM Holdings Corp. (Information Technology) | 3,611,003 | ||||||
| 44,765 | Fujitsu Ltd. (Information Technology) | 6,994,251 | ||||||
| 1,253 | GLP J REIT (Real Estate) | 995,401 | ||||||
| 26,561 | Hamamatsu Photonics KK (Information Technology) | 953,335 | ||||||
| 77,884 | Hankyu Hanshin Holdings, Inc. (Industrials) | 2,246,444 | ||||||
| 9,470 | Hikari Tsushin, Inc. (Industrials) | 1,712,787 | ||||||
| 9,937 | Hirose Electric Co. Ltd. (Information Technology) | 1,056,640 | ||||||
| 119,007 | Hitachi Ltd. (Industrials) | 10,070,312 | ||||||
| 701,766 | Honda Motor Co. Ltd. (Consumer Discretionary) | 8,355,362 | ||||||
| 29,465 | Hoshizaki Corp. (Industrials) | 1,005,200 | ||||||
| 97,625 | Hoya Corp. (Health Care) | 12,709,448 | ||||||
| 201,901 | Hulic Co. Ltd. (Real Estate) | 2,014,019 | ||||||
| 20,148 | Ibiden Co. Ltd. (Information Technology) | 928,986 | ||||||
| 510,585 | Idemitsu Kosan Co. Ltd. (Energy) | 3,234,012 | ||||||
| 86,550 | Iida Group Holdings Co. Ltd. (Consumer Discretionary) | 1,116,933 | ||||||
| 435,523 | Inpex Corp. (Energy) | 5,851,786 | ||||||
| 181,795 | Isuzu Motors Ltd. (Consumer Discretionary) | 2,589,610 | ||||||
| 245,244 | ITOCHU Corp. (Industrials) | 10,676,888 | ||||||
| 306,859 | Japan Airlines Co. Ltd. (Industrials) | 5,732,463 | ||||||
| 123,081 | Japan Exchange Group, Inc. (Financials) | 3,218,675 | ||||||
| 1,791 | Japan Metropolitan Fund Invest REIT (Real Estate) | 1,056,627 | ||||||
| 270,209 | Japan Post Bank Co. Ltd. (Financials) | 2,884,071 | ||||||
|
Shares |
Description | Value | ||||||
| Common Stocks – (continued) |
| |||||||
| Japan – (continued) |
| |||||||
| 890,329 | Japan Post Holdings Co. Ltd. (Financials) | $ | 8,604,670 | |||||
| 277,811 | Japan Post Insurance Co. Ltd. (Financials) | 5,126,705 | ||||||
| 280 | Japan Real Estate Investment Corp. REIT (Real Estate) | 1,010,222 | ||||||
| 198,064 | Japan Tobacco, Inc. (Consumer Staples) | 5,150,432 | ||||||
| 152,468 | JFE Holdings, Inc. (Materials) | 2,500,895 | ||||||
| 122,209 | Kajima Corp. (Industrials) | 2,267,893 | ||||||
| 304,775 | Kansai Electric Power Co., Inc. (The) (Utilities) | 3,910,740 | ||||||
| 83,796 | Kao Corp. (Consumer Staples) | 3,189,029 | ||||||
| 38,503 | Kawasaki Kisen Kaisha Ltd. (Industrials) | 1,840,128 | ||||||
| 207,668 | KDDI Corp. (Communication Services) | 6,318,702 | ||||||
| 976 | KDX Realty Investment Corp. REIT (Real Estate) | 977,500 | ||||||
| 51,671 | Keisei Electric Railway Co. Ltd. (Industrials) | 2,414,904 | ||||||
| 15,331 | Keyence Corp. (Information Technology) | 7,174,338 | ||||||
| 45,811 | Kikkoman Corp. (Consumer Staples) | 2,999,890 | ||||||
| 63,132 | Kintetsu Group Holdings Co. Ltd. (Industrials) | 1,942,848 | ||||||
| 131,647 | Kirin Holdings Co. Ltd. (Consumer Staples) | 1,833,488 | ||||||
| 80,612 | Komatsu Ltd. (Industrials) | 2,340,748 | ||||||
| 10,736 | Konami Group Corp. (Communication Services) | 723,050 | ||||||
| 153,668 | Kyocera Corp. (Information Technology) | 2,263,387 | ||||||
| 44,046 | Kyowa Kirin Co. Ltd. (Health Care) | 874,475 | ||||||
| 5,063 | Lasertec Corp. (Information Technology) | 1,351,419 | ||||||
| 61,575 | M3, Inc. (Health Care) | 883,081 | ||||||
| 487,717 | Marubeni Corp. (Industrials) | 8,055,298 | ||||||
| 248,071 | MatsukiyoCocokara & Co. (Consumer Staples) | 4,112,141 | ||||||
| 657,073 | Mazda Motor Corp. (Consumer Discretionary) | 7,717,875 | ||||||
| 63,335 | McDonald’s Holdings Co. Japan Ltd. (Consumer Discretionary) | 2,949,455 | ||||||
| 63,203 | MEIJI Holdings Co. Ltd. (Consumer Staples) | 1,426,047 | ||||||
| 205,294 | MISUMI Group, Inc. (Industrials) | 3,135,579 | ||||||
| 391,213 | Mitsubishi Chemical Group Corp. (Materials) | 2,243,979 | ||||||
| 673,940 | Mitsubishi Corp. (Industrials) | 14,431,601 | ||||||
| 223,325 | Mitsubishi Electric Corp. (Industrials) | 3,553,474 | ||||||
| 103,479 | Mitsubishi Estate Co. Ltd. (Real Estate) | 1,590,522 | ||||||
| The accompanying notes are an integral part of these financial statements. | 55 |
GOLDMAN SACHS ACTIVEBETA® INTERNATIONAL EQUITY ETF
|
Schedule of Investments (continued)
February 29, 2024 (Unaudited) |
|
Shares |
Description | Value | ||||||
| Common Stocks – (continued) |
| |||||||
| Japan – (continued) |
| |||||||
| 482,217 | Mitsubishi HC Capital, Inc. (Financials) | $ | 3,328,190 | |||||
| 27,870 | Mitsubishi Heavy Industries Ltd. (Industrials) | 2,201,929 | ||||||
| 1,200,694 | Mitsubishi UFJ Financial Group, Inc. (Financials) | 12,370,349 | ||||||
| 301,393 | Mitsui & Co. Ltd. (Industrials) | 13,195,886 | ||||||
| 58,797 | Mitsui Fudosan Co. Ltd. (Real Estate) | 1,595,341 | ||||||
| 83,387 | Mitsui OSK Lines Ltd. (Industrials) | 2,859,238 | ||||||
| 411,216 | Mizuho Financial Group, Inc. (Financials) | 7,695,704 | ||||||
| 708,354 | MonotaRO Co. Ltd. (Industrials) | 6,779,696 | ||||||
| 93,585 | MS&AD Insurance Group Holdings, Inc. (Financials) | 4,633,292 | ||||||
| 165,582 | Murata Manufacturing Co. Ltd. (Information Technology) | 3,344,387 | ||||||
| 141,628 | NEC Corp. (Information Technology) | 9,547,849 | ||||||
| 116,261 | Nintendo Co. Ltd. (Communication Services) | 6,524,971 | ||||||
| 355 | Nippon Building Fund, Inc. REIT (Real Estate) | 1,368,578 | ||||||
| 54,783 | NIPPON EXPRESS HOLDINGS, Inc. (Industrials) | 2,898,554 | ||||||
| 618 | Nippon Prologis REIT, Inc. REIT (Real Estate) | 1,034,748 | ||||||
| 50,349 | Nippon Sanso Holdings Corp. (Materials) | 1,459,304 | ||||||
| 116,803 | Nippon Steel Corp. (Materials)(a) | 2,899,199 | ||||||
| 11,627,811 | Nippon Telegraph & Telephone Corp. (Communication Services) | 14,162,824 | ||||||
| 193,863 | Nippon Yusen KK (Industrials) | 6,181,026 | ||||||
| 23,824 | Nissan Chemical Corp. (Materials) | 995,333 | ||||||
| 69,087 | Nissin Foods Holdings Co. Ltd. (Consumer Staples) | 2,020,404 | ||||||
| 35,375 | Nitori Holdings Co. Ltd. (Consumer Discretionary) | 5,195,046 | ||||||
| 20,670 | Nitto Denko Corp. (Materials) | 1,898,928 | ||||||
| 196,069 | Nomura Holdings, Inc. (Financials) | 1,114,555 | ||||||
| 67,165 | Nomura Real Estate Holdings, Inc. (Real Estate) | 1,670,711 | ||||||
| 1,404 | Nomura Real Estate Master Fund, Inc. REIT (Real Estate) | 1,396,777 | ||||||
| 66,312 | Nomura Research Institute Ltd. (Information Technology) | 1,862,602 | ||||||
| 72,110 | NTT Data Group Corp. (Information Technology) | 1,172,926 | ||||||
| 393,387 | Obayashi Corp. (Industrials) | 3,809,811 | ||||||
| 5,807 | Obic Co. Ltd. (Information Technology) | 908,859 | ||||||
| 290,105 | Olympus Corp. (Health Care) | 4,132,450 | ||||||
|
Shares |
Description | Value | ||||||
| Common Stocks – (continued) |
| |||||||
| Japan – (continued) |
| |||||||
| 30,298 | Omron Corp. (Information Technology) | $ | 1,123,903 | |||||
| 188,755 | Ono Pharmaceutical Co. Ltd. (Health Care) | 3,137,719 | ||||||
| 48,403 | Oracle Corp. Japan (Information Technology) | 3,709,377 | ||||||
| 107,097 | Oriental Land Co. Ltd. (Consumer Discretionary) | 3,837,517 | ||||||
| 123,358 | ORIX Corp. (Financials) | 2,585,515 | ||||||
| 76,794 | Osaka Gas Co. Ltd. (Utilities) | 1,536,188 | ||||||
| 24,117 | Otsuka Corp. (Information Technology) | 1,060,265 | ||||||
| 163,123 | Otsuka Holdings Co. Ltd. (Health Care) | 6,628,677 | ||||||
| 72,118 | Pan Pacific International Holdings Corp. (Consumer Discretionary) | 1,698,510 | ||||||
| 339,712 | Panasonic Holdings Corp. (Consumer Discretionary) | 3,224,166 | ||||||
| 328,524 | Recruit Holdings Co. Ltd. (Industrials) | 13,266,513 | ||||||
| 323,641 | Renesas Electronics Corp. (Information Technology) | 5,307,522 | ||||||
| 491,877 | Resona Holdings, Inc. (Financials) | 2,681,711 | ||||||
| 751,377 | Ricoh Co. Ltd. (Information Technology) | 6,250,179 | ||||||
| 55,726 | SBI Holdings, Inc. (Financials) | 1,498,611 | ||||||
| 8,715 | SCREEN Holdings Co. Ltd. (Information Technology) | 1,090,903 | ||||||
| 76,394 | SCSK Corp. (Information Technology) | 1,408,749 | ||||||
| 27,839 | Secom Co. Ltd. (Industrials) | 2,031,148 | ||||||
| 178,773 | Seiko Epson Corp. (Information Technology)(a) | 2,891,758 | ||||||
| 89,859 | Sekisui Chemical Co. Ltd. (Consumer Discretionary) | 1,266,203 | ||||||
| 108,151 | Sekisui House Ltd. (Consumer Discretionary) | 2,413,472 | ||||||
| 491,259 | Seven & i Holdings Co. Ltd. (Consumer Staples) | 7,319,487 | ||||||
| 61,614 | Shimadzu Corp. (Information Technology) | 1,680,831 | ||||||
| 214,779 | Shimizu Corp. (Industrials) | 1,246,743 | ||||||
| 134,395 | Shin-Etsu Chemical Co. Ltd. (Materials) | 5,735,156 | ||||||
| 32,968 | Shionogi & Co. Ltd. (Health Care) | 1,648,510 | ||||||
| 293,631 | Shiseido Co. Ltd. (Consumer Staples) | 7,939,632 | ||||||
| 239,692 | Shizuoka Financial Group, Inc. (Financials) | 2,346,153 | ||||||
| 386,693 | SoftBank Corp. (Communication Services) | 5,096,225 | ||||||
| 43,324 | SoftBank Group Corp. (Communication Services) | 2,544,384 | ||||||
| 39,860 | Sompo Holdings, Inc. (Financials) | 2,338,815 | ||||||
| 56 | The accompanying notes are an integral part of these financial statements. |
GOLDMAN SACHS ACTIVEBETA® INTERNATIONAL EQUITY ETF
|
Shares |
Description | Value | ||||||
| Common Stocks – (continued) |
| |||||||
| Japan – (continued) |
| |||||||
| 75,426 | Sony Group Corp. (Consumer Discretionary) | $ | 6,523,616 | |||||
| 48,000 | Square Enix Holdings Co. Ltd. (Communication Services) | 2,034,556 | ||||||
| 347,595 | Subaru Corp. (Consumer Discretionary) | 7,905,481 | ||||||
| 76,149 | SUMCO Corp. (Information Technology) | 1,192,579 | ||||||
| 286,720 | Sumitomo Corp. (Industrials) | 6,718,294 | ||||||
| 288,996 | Sumitomo Electric Industries Ltd. (Consumer Discretionary) | 4,287,537 | ||||||
| 185,524 | Sumitomo Mitsui Financial Group, Inc. (Financials) | 10,342,836 | ||||||
| 136,654 | Sumitomo Mitsui Trust Holdings, Inc. (Financials) | 2,774,714 | ||||||
| 79,713 | Suntory Beverage & Food Ltd. (Consumer Staples) | 2,621,416 | ||||||
| 19,337 | Suzuki Motor Corp. (Consumer Discretionary) | 849,732 | ||||||
| 65,604 | Sysmex Corp. (Health Care) | 3,690,691 | ||||||
| 83,738 | T&D Holdings, Inc. (Financials) | 1,456,337 | ||||||
| 110,001 | Taisei Corp. (Industrials) | 3,459,442 | ||||||
| 426,580 | Takeda Pharmaceutical Co. Ltd. (Health Care) | 12,503,551 | ||||||
| 28,702 | TDK Corp. (Information Technology) | 1,493,110 | ||||||
| 56,051 | Terumo Corp. (Health Care) | 2,185,566 | ||||||
| 54,608 | TIS, Inc. (Information Technology) | 1,231,389 | ||||||
| 88,054 | Tobu Railway Co. Ltd. (Industrials) | 2,251,504 | ||||||
| 30,542 | Toho Co. Ltd. (Communication Services) | 992,151 | ||||||
| 232,963 | Tokio Marine Holdings, Inc. (Financials) | 6,811,292 | ||||||
| 65,486 | Tokyo Electron Ltd. (Information Technology) | 16,131,949 | ||||||
| 226,958 | Tokyo Gas Co. Ltd. (Utilities) | 4,972,241 | ||||||
| 133,543 | Tokyu Corp. (Industrials) | 1,662,707 | ||||||
| 111,960 | TOPPAN Holdings, Inc. (Industrials) | 2,665,287 | ||||||
| 220,066 | Toray Industries, Inc. (Materials) | 1,015,271 | ||||||
| 27,690 | TOTO Ltd. (Industrials) | 749,093 | ||||||
| 17,422 | Toyota Industries Corp. (Industrials) | 1,733,237 | ||||||
| 824,736 | Toyota Motor Corp. (Consumer Discretionary) | 19,953,024 | ||||||
| 97,330 | Toyota Tsusho Corp. (Industrials) | 6,290,976 | ||||||
| 68,466 | Trend Micro, Inc. (Information Technology) | 3,396,997 | ||||||
| 60,790 | Unicharm Corp. (Consumer Staples) | 2,021,053 | ||||||
| 99,300 | USS Co. Ltd. (Consumer Discretionary) | 1,728,644 | ||||||
| 43,422 | West Japan Railway Co. (Industrials) | 1,807,727 | ||||||
|
Shares |
Description | Value | ||||||
| Common Stocks – (continued) |
| |||||||
| Japan – (continued) |
| |||||||
| 80,939 | Yakult Honsha Co. Ltd. (Consumer Staples) | $ | 1,745,648 | |||||
| 116,772 | Yamaha Motor Co. Ltd. (Consumer Discretionary) | 1,045,073 | ||||||
| 65,761 | Yamato Holdings Co. Ltd. (Industrials) | 999,574 | ||||||
| 107,777 | Yokogawa Electric Corp. (Information Technology) | 2,278,389 | ||||||
| 221,537 | Zensho Holdings Co. Ltd. (Consumer Discretionary) | 9,699,552 | ||||||
| 428,474 | ZOZO, Inc. (Consumer Discretionary) | 9,716,314 | ||||||
|
|
|
|||||||
| 730,892,305 | ||||||||
|
|
||||||||
| Jordan – 0.1% |
| |||||||
| 140,844 | Hikma Pharmaceuticals PLC (Health Care) | 3,504,422 | ||||||
|
|
||||||||
| Luxembourg – 0.4% |
| |||||||
| 460,398 | ArcelorMittal (Materials) | 12,017,063 | ||||||
| 37,056 | Eurofins Scientific SE (Health Care) | 2,215,133 | ||||||
|
|
|
|||||||
| 14,232,196 | ||||||||
|
|
||||||||
| Macau – 0.0% |
| |||||||
| 356,138 | Sands China Ltd. (Consumer Discretionary)* | 1,014,444 | ||||||
|
|
||||||||
| Netherlands – 4.7% |
| |||||||
| 130,693 | ABN AMRO Bank NV (Financials)(b) |
2,100,228 | ||||||
| 444 | Adyen NV (Financials)*(b) | 701,493 | ||||||
| 185,831 | Aegon Ltd. (Financials) | 1,115,285 | ||||||
| 22,820 | Akzo Nobel NV (Materials) | 1,662,939 | ||||||
| 8,528 | ASM International NV (Information Technology) | 5,202,150 | ||||||
| 54,424 | ASML Holding NV (Information Technology) | 51,268,055 | ||||||
| 25,512 | ASR Nederland NV (Financials) | 1,176,921 | ||||||
| 16,590 | BE Semiconductor Industries NV (Information Technology) | 3,000,823 | ||||||
| 14,855 | Euronext NV (Financials)(b) | 1,370,423 | ||||||
| 75,534 | EXOR NV (Financials) | 8,157,567 | ||||||
| 57,775 | Heineken Holding NV (Consumer Staples) | 4,464,016 | ||||||
| 34,934 | Heineken NV (Consumer Staples) | 3,229,204 | ||||||
| 7,370 | IMCD NV (Industrials) | 1,123,741 | ||||||
| 400,823 | ING Groep NV (Financials) | 5,504,297 | ||||||
| 103,004 | JDE Peet’s NV (Consumer Staples) | 2,356,387 | ||||||
| 509,176 | Koninklijke Ahold Delhaize NV (Consumer Staples) | 15,163,657 | ||||||
| 744,754 | Koninklijke KPN NV (Communication Services) | 2,726,481 | ||||||
| 96,863 | Koninklijke Philips NV (Health Care) | 1,939,386 | ||||||
| 110,671 | Randstad NV (Industrials) | 6,100,710 | ||||||
| 884,735 | Shell PLC (Energy) | 27,497,426 | ||||||
| The accompanying notes are an integral part of these financial statements. | 57 |
GOLDMAN SACHS ACTIVEBETA® INTERNATIONAL EQUITY ETF
|
Schedule of Investments (continued)
February 29, 2024 (Unaudited) |
|
Shares |
Description | Value | ||||||
| Common Stocks – (continued) |
| |||||||
| Netherlands – (continued) |
| |||||||
| 69,837 | Universal Music Group NV (Communication Services) | $ | 2,106,251 | |||||
| 99,954 | Wolters Kluwer NV (Industrials) | 15,775,903 | ||||||
|
|
|
|||||||
| 163,743,343 | ||||||||
|
|
||||||||
| New Zealand – 0.2% |
| |||||||
| 193,966 | Fisher & Paykel Healthcare Corp. Ltd. (Health Care) | 2,895,257 | ||||||
| 363,460 | Spark New Zealand Ltd. (Communication Services) | 1,122,691 | ||||||
| 49,928 | Xero Ltd. (Information Technology)* | 4,138,928 | ||||||
|
|
|
|||||||
| 8,156,876 | ||||||||
|
|
||||||||
| Norway – 0.7% |
| |||||||
| 54,798 | Aker BP ASA (Energy) | 1,332,306 | ||||||
| 154,869 | DNB Bank ASA (Financials) | 3,101,982 | ||||||
| 269,606 | Equinor ASA (Energy) | 6,655,415 | ||||||
| 226,068 | Gjensidige Forsikring ASA (Financials) | 3,574,687 | ||||||
| 42,060 | Kongsberg Gruppen ASA (Industrials) | 2,684,491 | ||||||
| 37,834 | Mowi ASA (Consumer Staples) | 731,390 | ||||||
| 351,076 | Orkla ASA (Consumer Staples) | 2,519,314 | ||||||
| 29,176 | Salmar ASA (Consumer Staples) | 1,853,633 | ||||||
| 193,942 | Telenor ASA (Communication Services) | 2,126,194 | ||||||
|
|
|
|||||||
| 24,579,412 | ||||||||
|
|
||||||||
| Portugal – 0.3% |
| |||||||
| 250,310 | EDP – Energias de Portugal SA (Utilities) | 996,542 | ||||||
| 81,056 | Galp Energia SGPS SA (Energy) | 1,278,004 | ||||||
| 384,289 | Jeronimo Martins SGPS SA (Consumer Staples) | 9,198,790 | ||||||
|
|
|
|||||||
| 11,473,336 | ||||||||
|
|
||||||||
| Singapore – 1.4% |
| |||||||
| 585,015 | CapitaLand Integrated Commercial Trust REIT (Real Estate) | 852,766 | ||||||
| 397,544 | DBS Group Holdings Ltd. (Financials) | 9,854,337 | ||||||
| 2,281,172 | Genting Singapore Ltd. (Consumer Discretionary) | 1,543,854 | ||||||
| 58,870 | Jardine Cycle & Carriage Ltd. (Industrials) | 1,114,266 | ||||||
| 398,454 | Keppel Ltd. (Industrials) | 2,145,476 | ||||||
| 908,159 | Oversea-Chinese Banking Corp. Ltd. (Financials) | 8,766,848 | ||||||
| 339,768 | Sembcorp Industries Ltd. (Utilities) | 1,288,723 | ||||||
| 400,157 | Singapore Airlines Ltd. (Industrials) | 1,925,491 | ||||||
| 1,372,733 | Singapore Exchange Ltd. (Financials) | 9,647,722 | ||||||
|
Shares |
Description | Value | ||||||
| Common Stocks – (continued) |
| |||||||
| Singapore – (continued) |
| |||||||
| 668,952 | Singapore Telecommunications Ltd. (Communication Services) | $ | 1,169,149 | |||||
| 134,300 | STMicroelectronics NV (Information Technology) | 6,064,011 | ||||||
| 256,720 | United Overseas Bank Ltd. (Financials) | 5,336,400 | ||||||
|
|
|
|||||||
| 49,709,043 | ||||||||
|
|
||||||||
| Spain – 2.4% |
| |||||||
| 9,401 | Acciona SA (Utilities) | 1,052,427 | ||||||
| 229,477 | ACS Actividades de Construccion y Servicios SA (Industrials) | 9,421,588 | ||||||
| 4,354 | Aena SME SA (Industrials)(b) | 825,251 | ||||||
| 47,197 | Amadeus IT Group SA (Consumer Discretionary) | 2,777,418 | ||||||
| 1,022,328 | Banco Bilbao Vizcaya Argentaria SA (Financials) | 10,162,588 | ||||||
| 2,649,107 | Banco Santander SA (Financials) | 11,024,018 | ||||||
| 553,655 | CaixaBank SA (Financials) | 2,498,405 | ||||||
| 78,221 | Enagas SA (Utilities) | 1,129,613 | ||||||
| 75,548 | Endesa SA (Utilities) | 1,360,391 | ||||||
| 765,626 | Iberdrola SA (Utilities) | 8,798,908 | ||||||
| 402,990 | Industria de Diseno Textil SA (Consumer Discretionary) | 17,884,288 | ||||||
| 101,052 | Redeia Corp. SA (Utilities) | 1,607,496 | ||||||
| 638,642 | Repsol SA (Energy) | 10,176,546 | ||||||
| 1,041,160 | Telefonica SA (Communication Services) | 4,273,542 | ||||||
|
|
|
|||||||
| 82,992,479 | ||||||||
|
|
||||||||
| Sweden – 2.2% |
| |||||||
| 51,709 | Alfa Laval AB (Industrials) | 1,947,436 | ||||||
| 81,200 | Assa Abloy AB, Class B (Industrials) | 2,318,105 | ||||||
| 382,808 | Atlas Copco AB, Class A (Industrials) | 6,649,922 | ||||||
| 271,988 | Atlas Copco AB, Class B (Industrials) | 4,070,311 | ||||||
| 74,883 | Epiroc AB, Class A (Industrials) | 1,358,720 | ||||||
| 55,641 | Epiroc AB, Class B (Industrials) | 918,437 | ||||||
| 118,131 | Essity AB, Class B (Consumer Staples) | 2,759,352 | ||||||
| 11,885 | Evolution AB (Consumer Discretionary)(b) | 1,540,721 | ||||||
| 581,154 | H & M Hennes & Mauritz AB, Class B (Consumer Discretionary)(a) | 7,888,793 | ||||||
| 88,770 | Hexagon AB, Class B (Information Technology) | 1,041,053 | ||||||
| 31,198 | Holmen AB, Class B (Materials) | 1,253,655 | ||||||
| 132,024 | Husqvarna AB, Class B (Industrials)(a) |
1,018,941 | ||||||
| 51,592 | Industrivarden AB, Class A (Financials) | 1,761,541 | ||||||
| 62,167 | Industrivarden AB, Class C (Financials) | 2,116,602 | ||||||
| 58 | The accompanying notes are an integral part of these financial statements. |
GOLDMAN SACHS ACTIVEBETA® INTERNATIONAL EQUITY ETF
|
Shares |
Description | Value | ||||||
| Common Stocks – (continued) |
| |||||||
| Sweden – (continued) |
| |||||||
| 204,397 | Investor AB, Class B (Financials) | $ | 5,143,777 | |||||
| 23,982 | L E Lundbergforetagen AB, Class B (Financials) | 1,304,850 | ||||||
| 37,084 | Lifco AB, Class B (Industrials) | 988,434 | ||||||
| 17,949 | Saab AB, Class B (Industrials) | 1,416,152 | ||||||
| 59,544 | Sandvik AB (Industrials) | 1,340,214 | ||||||
| 193,771 | Skandinaviska Enskilda Banken AB, Class A (Financials)(a) | 2,880,128 | ||||||
| 35,836 | SKF AB, Class B (Industrials) | 782,006 | ||||||
| 84,728 | Svenska Cellulosa AB SCA, Class B (Materials) | 1,200,814 | ||||||
| 261,219 | Svenska Handelsbanken AB, Class A (Financials) | 3,125,303 | ||||||
| 167,386 | Swedbank AB, Class A (Financials) | 3,678,546 | ||||||
| 102,694 | Swedish Orphan Biovitrum AB (Health Care)* | 2,526,796 | ||||||
| 118,430 | Tele2 AB, Class B (Communication Services) | 994,828 | ||||||
| 710,682 | Telefonaktiebolaget LM Ericsson, Class B (Information Technology) | 3,861,980 | ||||||
| 627,237 | Telia Co. AB (Communication Services) | 1,495,435 | ||||||
| 84,699 | Volvo AB, Class A (Industrials) | 2,363,971 | ||||||
| 182,002 | Volvo AB, Class B (Industrials) | 5,014,643 | ||||||
| 1,058,475 | Volvo Car AB, Class B (Consumer Discretionary)* | 3,862,596 | ||||||
|
|
|
|||||||
| 78,624,062 | ||||||||
|
|
||||||||
| Switzerland – 5.3% |
| |||||||
| 159,918 | ABB Ltd. (Industrials) | 7,395,220 | ||||||
| 27,798 | Adecco Group AG (Industrials) | 1,118,486 | ||||||
| 27,726 | Alcon, Inc. (Health Care) | 2,367,203 | ||||||
| 17,867 | Baloise Holding AG (Financials) | 2,893,458 | ||||||
| 29,906 | Banque Cantonale Vaudoise (Financials) | 3,596,667 | ||||||
| 1,035 | Barry Callebaut AG (Consumer Staples) | 1,459,849 | ||||||
| 14,807 | BKW AG (Utilities) | 2,085,138 | ||||||
| 384 | Chocoladefabriken Lindt & Spruengli AG (Consumer Staples) | 4,718,505 | ||||||
| 57,735 | Cie Financiere Richemont SA (Consumer Discretionary) | 9,218,717 | ||||||
| 65,246 | Clariant AG (Materials)* | 810,620 | ||||||
| 14,303 | DSM-Firmenich AG (Materials) | 1,532,322 | ||||||
| 4,031 | EMS-Chemie Holding AG (Materials) | 2,822,226 | ||||||
| 8,050 | Geberit AG (Industrials) | 4,691,681 | ||||||
| 1,026 | Givaudan SA (Materials) | 4,319,325 | ||||||
| 20,791 | Helvetia Holding AG (Financials) | 2,949,061 | ||||||
| 34,986 | Kuehne + Nagel International AG (Industrials) | 11,824,239 | ||||||
| 69,381 | Logitech International SA (Information Technology) | 6,144,263 | ||||||
|
Shares |
Description | Value | ||||||
| Common Stocks – (continued) |
| |||||||
| Switzerland – (continued) |
| |||||||
| 341,354 | Novartis AG (Health Care) | $ | 34,691,692 | |||||
| 7,431 | Partners Group Holding AG (Financials) | 10,709,147 | ||||||
| 161,965 | Sandoz Group AG (Health Care)* | 5,050,887 | ||||||
| 7,493 | Schindler Holding AG (Industrials) | 1,912,925 | ||||||
| 6,480 | Schindler Holding AG Participation Certificates (Industrials) | 1,713,920 | ||||||
| 72,259 | SGS SA (Industrials) | 6,958,791 | ||||||
| 48,931 | SIG Group AG (Materials)* | 972,452 | ||||||
| 5,233 | Sika AG (Materials) | 1,518,405 | ||||||
| 7,512 | Sonova Holding AG (Health Care) | 2,323,000 | ||||||
| 39,623 | Straumann Holding AG (Health Care) | 6,281,723 | ||||||
| 14,523 | Swatch Group AG (The) – Bearer (Consumer Discretionary) | 3,440,461 | ||||||
| 65,446 | Swatch Group AG (The) – Registered (Consumer Discretionary) | 3,006,406 | ||||||
| 6,455 | Swiss Life Holding AG (Financials) | 4,703,342 | ||||||
| 24,210 | Swiss Prime Site AG (Real Estate) | 2,323,258 | ||||||
| 4,413 | Swisscom AG (Communication Services) | 2,532,883 | ||||||
| 509,654 | UBS Group AG (Financials) | 14,591,309 | ||||||
| 5,585 | VAT Group AG (Industrials)(b) | 2,808,515 | ||||||
| 16,578 | Zurich Insurance Group AG (Financials) | 8,848,629 | ||||||
|
|
|
|||||||
| 184,334,725 | ||||||||
|
|
||||||||
| United Kingdom – 10.1% |
| |||||||
| 314,561 | 3i Group PLC (Financials) | 9,820,276 | ||||||
| 257,608 | Admiral Group PLC (Financials) | 8,687,467 | ||||||
| 14,232 | Ashtead Group PLC (Industrials) | 1,022,558 | ||||||
| 172,560 | Associated British Foods PLC (Consumer Staples) | 4,961,503 | ||||||
| 220,930 | AstraZeneca PLC (Health Care) | 27,899,052 | ||||||
| 1,248,841 | Auto Trader Group PLC (Communication Services)(b) | 11,696,266 | ||||||
| 279,021 | Aviva PLC (Financials) | 1,575,206 | ||||||
| 534,001 | BAE Systems PLC (Industrials) | 8,389,524 | ||||||
| 2,278,269 | Barclays PLC (Financials) | 4,739,570 | ||||||
| 895,613 | Barratt Developments PLC (Consumer Discretionary) | 5,285,009 | ||||||
| 61,821 | Berkeley Group Holdings PLC (Consumer Discretionary) | 3,630,851 | ||||||
| 2,737,183 | BP PLC (Energy) | 15,951,287 | ||||||
| 358,261 | British American Tobacco PLC (Consumer Staples) | 10,627,132 | ||||||
| 85,655 | Bunzl PLC (Industrials) | 3,416,256 | ||||||
| 563,924 | Burberry Group PLC (Consumer Discretionary) | 9,166,370 | ||||||
| The accompanying notes are an integral part of these financial statements. | 59 |
GOLDMAN SACHS ACTIVEBETA® INTERNATIONAL EQUITY ETF
|
Schedule of Investments (continued)
February 29, 2024 (Unaudited) |
|
Shares |
Description | Value | ||||||
| Common Stocks – (continued) |
| |||||||
| United Kingdom – (continued) |
| |||||||
| 5,026,452 | Centrica PLC (Utilities) | $ | 8,001,814 | |||||
| 934,344 | CK Hutchison Holdings Ltd. (Industrials) | 4,744,044 | ||||||
| 76,707 | Coca-Cola Europacific Partners PLC (Consumer Staples) | 5,264,401 | ||||||
| 304,368 | Compass Group PLC (Consumer Discretionary) | 8,354,730 | ||||||
| 73,163 | DCC PLC (Industrials) | 5,197,473 | ||||||
| 205,797 | Diageo PLC (Consumer Staples) | 7,710,770 | ||||||
| 45,543 | Halma PLC (Information Technology) | 1,326,174 | ||||||
| 690,978 | Hargreaves Lansdown PLC (Financials) | 6,366,604 | ||||||
| 2,577,159 | HSBC Holdings PLC (Financials) | 20,032,575 | ||||||
| 275,551 | Imperial Brands PLC (Consumer Staples) | 5,941,180 | ||||||
| 302,100 | Informa PLC (Communication Services) | 3,096,112 | ||||||
| 40,375 | InterContinental Hotels Group PLC (Consumer Discretionary) | 4,279,867 | ||||||
| 28,657 | Intertek Group PLC (Industrials) | 1,675,461 | ||||||
| 2,124,623 | J Sainsbury PLC (Consumer Staples) | 6,708,109 | ||||||
| 4,903,705 | JD Sports Fashion PLC (Consumer Discretionary) | 7,313,274 | ||||||
| 1,438,929 | Kingfisher PLC (Consumer Discretionary) | 4,268,309 | ||||||
| 98,340 | Land Securities Group PLC REIT (Real Estate) | 770,753 | ||||||
| 1,983,162 | Legal & General Group PLC (Financials) | 6,073,327 | ||||||
| 4,854,558 | Lloyds Banking Group PLC (Financials) | 2,859,760 | ||||||
| 55,069 | London Stock Exchange Group PLC (Financials) | 6,182,985 | ||||||
| 247,800 | M&G PLC (Financials) | 704,333 | ||||||
| 301,652 | Melrose Industries PLC (Industrials) | 2,423,001 | ||||||
| 246,678 | National Grid PLC (Utilities) | 3,237,369 | ||||||
| 822,710 | NatWest Group PLC (Financials) | 2,488,284 | ||||||
| 86,779 | Next PLC (Consumer Discretionary) | 9,126,376 | ||||||
| 102,927 | Pearson PLC (Consumer Discretionary) | 1,250,678 | ||||||
| 251,150 | Phoenix Group Holdings PLC (Financials) | 1,579,884 | ||||||
| 77,916 | Reckitt Benckiser Group PLC (Consumer Staples) | 4,926,025 | ||||||
| 326,465 | RELX PLC (Industrials) | 14,292,622 | ||||||
| 969,627 | Rolls-Royce Holdings PLC (Industrials)* | 4,527,124 | ||||||
| 841,267 | Sage Group PLC (The) (Information Technology) | 13,243,490 | ||||||
| 57,886 | Severn Trent PLC (Utilities) | 1,830,574 | ||||||
|
Shares |
Description | Value | ||||||
| Common Stocks – (continued) |
| |||||||
| United Kingdom – (continued) |
| |||||||
| 237,088 | Smith & Nephew PLC (Health Care) | $ | 3,120,508 | |||||
| 123,131 | Smiths Group PLC (Industrials) | 2,504,535 | ||||||
| 9,428 | Spirax-Sarco Engineering PLC (Industrials) | 1,231,355 | ||||||
| 159,673 | SSE PLC (Utilities) | 3,283,161 | ||||||
| 463,601 | St James’s Place PLC (Financials) | 2,949,756 | ||||||
| 333,628 | Standard Chartered PLC (Financials) | 2,817,426 | ||||||
| 1,136,322 | Taylor Wimpey PLC (Consumer Discretionary) | 1,981,444 | ||||||
| 2,526,990 | Tesco PLC (Consumer Staples) | 8,911,893 | ||||||
| 194,252 | Unilever PLC (Consumer Staples) | 9,500,735 | ||||||
| 150,841 | United Utilities Group PLC (Utilities) | 1,955,766 | ||||||
| 7,658,578 | Vodafone Group PLC (Communication Services) | 6,696,156 | ||||||
| 69,339 | Whitbread PLC (Consumer Discretionary) | 2,897,076 | ||||||
| 352,415 | Wise PLC, Class A (Financials)* | 4,091,439 | ||||||
| 82,956 | WPP PLC (Communication Services) | 742,102 | ||||||
|
|
|
|||||||
| 355,349,161 | ||||||||
|
|
||||||||
| United States – 5.5% |
| |||||||
| 44,224 | BRP, Inc. (Consumer Discretionary) | 2,920,770 | ||||||
| 81,618 | CRH PLC (Materials) | 6,787,179 | ||||||
| 29,669 | CSL Ltd. (Health Care) | 5,529,863 | ||||||
| 4,324 | CyberArk Software Ltd. (Information Technology)* | 1,140,498 | ||||||
| 81,482 | Experian PLC (Industrials) | 3,488,944 | ||||||
| 89,891 | Ferrovial SE (Industrials) | 3,370,599 | ||||||
| 775,195 | GSK PLC (Health Care) | 16,322,795 | ||||||
| 801,354 | Haleon PLC (Consumer Staples) | 3,359,821 | ||||||
| 100,365 | Holcim AG (Materials)* | 8,217,951 | ||||||
| 95,462 | James Hardie Industries PLC CDI (Materials)* | 3,776,226 | ||||||
| 20,476 | Monday.com Ltd. (Information Technology)* | 4,566,353 | ||||||
| 394,477 | Nestle SA (Consumer Staples) | 41,107,500 | ||||||
| 59,698 | QIAGEN NV (Health Care)* | 2,560,509 | ||||||
| 14,434 | Roche Holding AG (Health Care) | 4,022,604 | ||||||
| 122,261 | Roche Holding AG (Health Care) | 32,205,371 | ||||||
| 182,888 | Sanofi SA (Health Care) | 17,394,513 | ||||||
| 69,715 | Schneider Electric SE (Industrials) | 15,827,755 | ||||||
| 439,019 | Stellantis NV (Consumer Discretionary) | 11,466,166 | ||||||
| 43,370 | Swiss Re AG (Financials) | 5,250,403 | ||||||
| 60 | The accompanying notes are an integral part of these financial statements. |
GOLDMAN SACHS ACTIVEBETA® INTERNATIONAL EQUITY ETF
|
Shares |
Description | Value | ||||||
| Common Stocks – (continued) |
| |||||||
| United States – (continued) |
| |||||||
| 150,856 | Tenaris SA (Energy) | $ | 2,680,547 | |||||
|
|
|
|||||||
| 191,996,367 | ||||||||
|
|
||||||||
|
TOTAL COMMON STOCKS (Cost $2,897,481,214) |
3,501,301,805 | |||||||
|
|
||||||||
| Shares | Description | Rate | Value | |||||||||
| Preferred Stocks – 0.3% |
| |||||||||||
| Germany – 0.3% |
| |||||||||||
| 50,211 | Bayerische Motoren Werke AG (Consumer Discretionary) | 8.33% | 5,504,222 | |||||||||
| 37,719 | Henkel AG & Co. KGaA (Consumer Staples) | 2.66 | 2,839,275 | |||||||||
| 16,467 | Porsche Automobil Holding SE (Consumer Discretionary) | 5.18 | 879,940 | |||||||||
| 9,274 | Volkswagen AG (Consumer Discretionary) | 7.00 | 1,257,895 | |||||||||
|
|
||||||||||||
|
TOTAL PREFERRED STOCKS (Cost $10,438,791) |
|
10,481,332 | ||||||||||
|
|
||||||||||||
| Units | Description | Expiration Month | Value | |||||||||
| Warrant – 0.0% |
| |||||||||||
| Canada – 0.0% |
| |||||||||||
| 8,722 | Constellation Software, Inc. (Information Technology)*(c) | |||||||||||
| (Cost $0) | 08/28 | — | ||||||||||
|
|
||||||||||||
|
Shares |
Dividend Rate | Value | ||||||
| Investment Company – 0.2%(d) |
| |||||||
|
Goldman Sachs Financial Square Treasury Obligations Fund – Institutional Shares |
||||||||
| 8,698,821 | 5.195% | $ | 8,698,821 | |||||
| (Cost $8,698,821) | ||||||||
|
|
||||||||
|
TOTAL INVESTMENTS BEFORE SECURITIES LENDING
REINVESTMENT VEHICLE |
3,520,481,958 | |||||||
|
|
||||||||
| Securities Lending Reinvestment Vehicle – 1.7%(d) |
| |||||||
|
Goldman
Sachs Financial Square Government |
||||||||
| 59,012,449 | 5.219% | 59,012,449 | ||||||
| (Cost $59,012,449) | ||||||||
|
|
||||||||
|
TOTAL INVESTMENTS – 101.6% (Cost $2,975,631,275) |
$ | 3,579,494,407 | ||||||
|
|
||||||||
|
LIABILITIES IN EXCESS OF OTHER ASSETS – (1.6)% |
(55,670,163 | ) | ||||||
|
|
||||||||
| NET ASSETS – 100.0% | $ | 3,523,824,244 | ||||||
|
|
||||||||
| The percentage shown for each investment category reflects the value of investments in that category as a percentage of net assets. | ||
| * | Non-income producing security. | |
| (a) | All or a portion of security is on loan. | |
| (b) | Exempt from registration under Rule 144A of the Securities Act of 1933. | |
| (c) | Significant unobservable inputs were used in the valuation of this portfolio security; i.e. Level 3. | |
| (d) | Represents an affiliated issuer. | |
|
| ||
| Investment Abbreviations: | ||
| ADR | —American Depositary Receipt | |
| PLC | —Public Limited Company | |
| REIT | —Real Estate Investment Trust | |
|
| ||
| The accompanying notes are an integral part of these financial statements. | 61 |
GOLDMAN SACHS ACTIVEBETA® INTERNATIONAL EQUITY ETF
|
Schedule of Investments (continued)
February 29, 2024 (Unaudited) |
|
ADDITIONAL INVESTMENT INFORMATION |
FUTURES CONTRACTS — At February 29, 2024, the Fund had the following futures contracts:
| Description | Number of Contracts |
Expiration Date |
Notional Amount |
Unrealized Appreciation/ (Depreciation) |
||||||||
|
|
||||||||||||
|
Long position contracts: |
||||||||||||
|
E-Mini MSCI EAFE Index Future |
77 | 03/15/24 | $ | 8,808,415 | $ | 461,846 | ||||||
|
|
||||||||||||
| Sector Name |
% of Market | |||||
|
|
||||||
|
Financials |
19.3% | |||||
|
Industrials |
16.4 | |||||
|
Consumer Discretionary |
13.1 | |||||
|
Health Care |
11.5 | |||||
|
Consumer Staples |
10.5 | |||||
|
Information Technology |
9.4 | |||||
|
Energy |
5.3 | |||||
|
Materials |
5.2 | |||||
|
Communication Services |
3.7 | |||||
|
Utilities |
2.6 | |||||
|
Real Estate |
1.2 | |||||
|
Investment Company |
0.2 | |||||
|
Securities Lending Reinvestment Vehicle |
1.6 | |||||
|
|
||||||
|
TOTAL INVESTMENTS |
100.0% | |||||
|
|
||||||
| 62 | The accompanying notes are an integral part of these financial statements. |
GOLDMAN SACHS ACTIVEBETA® JAPAN EQUITY ETF
|
Schedule of Investments
February 29, 2024 (Unaudited) |
| Shares | Description | Value | ||||||
| Common Stocks – 99.7% |
| |||||||
| Communication Services – 5.5% | ||||||||
| 1,710 | Capcom Co. Ltd. (Japan) | $ | 68,882 | |||||
| 1,565 | Dentsu Group, Inc. (Japan) | 43,373 | ||||||
| 5,670 | KDDI Corp. (Japan) | 172,521 | ||||||
| 506 | Konami Group Corp. (Japan) | 34,078 | ||||||
| 3,756 | LY Corp. (Japan) | 10,362 | ||||||
| 1,035 | Nexon Co. Ltd. (Japan) | 16,776 | ||||||
| 4,527 | Nintendo Co. Ltd. (Japan) | 254,071 | ||||||
| 166,579 | Nippon Telegraph & Telephone Corp. (Japan) | 202,895 | ||||||
| 15,366 | SoftBank Corp. (Japan) | 202,509 | ||||||
| 2,992 | SoftBank Group Corp. (Japan) | 175,718 | ||||||
| 1,027 | Square Enix Holdings Co. Ltd. (Japan) | 43,531 | ||||||
| 603 | Toho Co. Ltd. (Japan) | 19,588 | ||||||
|
|
|
|||||||
| 1,244,304 | ||||||||
|
|
||||||||
| Consumer Discretionary – 18.8% |
| |||||||
| 3,936 | Aisin Corp. (Japan) | 148,504 | ||||||
| 3,378 | Bandai Namco Holdings, Inc. (Japan) | 65,294 | ||||||
| 3,141 | Bridgestone Corp. (Japan) | 135,277 | ||||||
| 6,108 | Denso Corp. (Japan) | 112,390 | ||||||
| 850 | Fast Retailing Co. Ltd. (Japan) | 245,681 | ||||||
| 22,336 | Honda Motor Co. Ltd. (Japan) | 265,937 | ||||||
| 1,551 | Iida Group Holdings Co. Ltd. (Japan) | 20,016 | ||||||
| 3,120 | Isuzu Motors Ltd. (Japan) | 44,443 | ||||||
| 3,473 | Koito Manufacturing Co. Ltd. (Japan) | 43,961 | ||||||
| 18,293 | Mazda Motor Corp. (Japan) | 214,867 | ||||||
| 1,475 | McDonald’s Holdings Co. Japan Ltd. (Japan) | 68,689 | ||||||
| 4,589 | Nissan Motor Co. Ltd. (Japan) | 18,053 | ||||||
| 615 | Nitori Holdings Co. Ltd. (Japan) | 90,317 | ||||||
| 4,168 | Oriental Land Co. Ltd. (Japan) | 149,349 | ||||||
| 2,730 | Pan Pacific International Holdings Corp. (Japan) | 64,296 | ||||||
| 17,665 | Panasonic Holdings Corp. (Japan) | 167,656 | ||||||
| 2,564 | Rakuten Group, Inc. (Japan)* | 14,047 | ||||||
| 2,959 | Sekisui Chemical Co. Ltd. (Japan) | 41,695 | ||||||
| 3,414 | Sekisui House Ltd. (Japan) | 76,186 | ||||||
| 1,436 | Sharp Corp. (Japan)* | 7,824 | ||||||
| 291 | Shimano, Inc. (Japan) | 40,558 | ||||||
| 5,298 | Sony Group Corp. (Japan) | 458,226 | ||||||
| 7,422 | Subaru Corp. (Japan) | 168,801 | ||||||
| 10,552 | Sumitomo Electric Industries Ltd. (Japan) | 156,549 | ||||||
| 1,311 | Suzuki Motor Corp. (Japan) | 57,610 | ||||||
| 48,669 | Toyota Motor Corp. (Japan) | 1,177,460 | ||||||
| 1,489 | USS Co. Ltd. (Japan) | 25,921 | ||||||
| 610 | Yamaha Corp. (Japan) | 13,331 | ||||||
| 4,767 | Yamaha Motor Co. Ltd. (Japan) | 42,663 | ||||||
| 1,990 | Zensho Holdings Co. Ltd. (Japan) | 87,128 | ||||||
| 2,828 | ZOZO, Inc. (Japan) | 64,129 | ||||||
|
|
|
|||||||
| 4,286,858 | ||||||||
|
|
||||||||
| Shares | Description | Value | ||||||
| Common Stocks – (continued) |
| |||||||
| Consumer Staples – 6.2% |
| |||||||
| 4,786 | Aeon Co. Ltd. (Japan) | $ | 114,318 | |||||
| 2,952 | Ajinomoto Co., Inc. (Japan) | 108,538 | ||||||
| 3,043 | Asahi Group Holdings Ltd. (Japan) | 104,361 | ||||||
| 7,394 | Japan Tobacco, Inc. (Japan) | 192,273 | ||||||
| 2,272 | Kao Corp. (Japan) | 86,466 | ||||||
| 874 | Kikkoman Corp. (Japan) | 57,233 | ||||||
| 5,614 | Kirin Holdings Co. Ltd. (Japan) | 78,188 | ||||||
| 550 | Kobe Bussan Co. Ltd. (Japan) | 14,809 | ||||||
| 5,018 | MatsukiyoCocokara & Co. (Japan) | 83,181 | ||||||
| 1,519 | MEIJI Holdings Co. Ltd. (Japan) | 34,273 | ||||||
| 2,486 | Nissin Foods Holdings Co. Ltd. (Japan) | 72,701 | ||||||
| 15,441 | Seven & i Holdings Co. Ltd. (Japan) | 230,062 | ||||||
| 2,065 | Shiseido Co. Ltd. (Japan) | 55,836 | ||||||
| 1,764 | Suntory Beverage & Food Ltd. (Japan) | 58,010 | ||||||
| 1,878 | Unicharm Corp. (Japan) | 62,437 | ||||||
| 2,742 | Yakult Honsha Co. Ltd. (Japan) | 59,138 | ||||||
|
|
|
|||||||
| 1,411,824 | ||||||||
|
|
||||||||
| Energy – 1.9% | ||||||||
| 47,066 | ENEOS Holdings, Inc. (Japan) | 203,239 | ||||||
| 23,185 | Idemitsu Kosan Co. Ltd. (Japan) | 146,852 | ||||||
| 6,608 | Inpex Corp. (Japan) | 88,787 | ||||||
|
|
|
|||||||
| 438,878 | ||||||||
|
|
||||||||
| Financials – 13.2% | ||||||||
| 2,148 | Chiba Bank Ltd. (The) (Japan) | 17,480 | ||||||
| 6,536 | Concordia Financial Group Ltd. (Japan) | 33,101 | ||||||
| 3,323 | Dai-ichi Life Holdings, Inc. (Japan) | 75,665 | ||||||
| 9,236 | Daiwa Securities Group, Inc. (Japan) | 68,003 | ||||||
| 5,326 | Japan Exchange Group, Inc. (Japan) | 139,280 | ||||||
| 7,589 | Japan Post Bank Co. Ltd. (Japan) | 81,001 | ||||||
| 12,144 | Japan Post Holdings Co. Ltd. (Japan) | 117,367 | ||||||
| 9,594 | Japan Post Insurance Co. Ltd. (Japan) | 177,047 | ||||||
| 15,389 | Mitsubishi HC Capital, Inc. (Japan) | 106,213 | ||||||
| 60,118 | Mitsubishi UFJ Financial Group, Inc. (Japan) | 619,376 | ||||||
| 16,344 | Mizuho Financial Group, Inc. (Japan) | 305,870 | ||||||
| 2,988 | MS&AD Insurance Group Holdings, Inc. (Japan) | 147,933 | ||||||
| 8,415 | Nomura Holdings, Inc. (Japan) | 47,835 | ||||||
| 4,857 | ORIX Corp. (Japan) | 101,800 | ||||||
| 8,085 | Resona Holdings, Inc. (Japan) | 44,079 | ||||||
| 1,054 | SBI Holdings, Inc. (Japan) | 28,345 | ||||||
| 3,320 | Shizuoka Financial Group, Inc. (Japan) | 32,497 | ||||||
| 2,056 | Sompo Holdings, Inc. (Japan) | 120,637 | ||||||
| The accompanying notes are an integral part of these financial statements. | 63 |
GOLDMAN SACHS ACTIVEBETA® JAPAN EQUITY ETF
|
Schedule of Investments (continued)
February 29, 2024 (Unaudited) |
| Shares | Description | Value | ||||||
| Common Stocks – (continued) |
| |||||||
| Financials – (continued) |
| |||||||
| 6,749 | Sumitomo Mitsui Financial Group, Inc. (Japan) | $ | 376,252 | |||||
| 3,146 | Sumitomo Mitsui Trust Holdings, Inc. (Japan) | 63,879 | ||||||
| 2,731 | T&D Holdings, Inc. (Japan) | 47,496 | ||||||
| 8,769 | Tokio Marine Holdings, Inc. (Japan) | 256,385 | ||||||
|
|
|
|||||||
| 3,007,541 | ||||||||
|
|
||||||||
| Health Care – 8.4% |
| |||||||
| 1,909 | Asahi Intecc Co. Ltd. (Japan) | 39,680 | ||||||
| 13,002 | Astellas Pharma, Inc. (Japan) | 143,468 | ||||||
| 3,962 | Chugai Pharmaceutical Co. Ltd. (Japan) | 158,829 | ||||||
| 8,747 | Daiichi Sankyo Co. Ltd. (Japan) | 290,690 | ||||||
| 1,788 | Eisai Co. Ltd. (Japan) | 74,712 | ||||||
| 1,859 | Hoya Corp. (Japan) | 242,017 | ||||||
| 2,692 | Kyowa Kirin Co. Ltd. (Japan) | 53,446 | ||||||
| 1,791 | M3, Inc. (Japan) | 25,686 | ||||||
| 6,701 | Olympus Corp. (Japan) | 95,454 | ||||||
| 4,534 | Ono Pharmaceutical Co. Ltd. (Japan) | 75,370 | ||||||
| 4,376 | Otsuka Holdings Co. Ltd. (Japan) | 177,823 | ||||||
| 1,601 | Shionogi & Co. Ltd. (Japan) | 80,055 | ||||||
| 1,023 | Sysmex Corp. (Japan) | 57,551 | ||||||
| 9,804 | Takeda Pharmaceutical Co. Ltd. (Japan) | 287,366 | ||||||
| 2,539 | Terumo Corp. (Japan) | 99,002 | ||||||
|
|
|
|||||||
| 1,901,149 | ||||||||
|
|
||||||||
| Industrials – 19.8% |
| |||||||
| 707 | AGC, Inc. (Japan) | 25,286 | ||||||
| 1,245 | ANA Holdings, Inc. (Japan)* | 27,151 | ||||||
| 1,929 | Central Japan Railway Co. (Japan) | 48,576 | ||||||
| 836 | Dai Nippon Printing Co. Ltd. (Japan) | 24,392 | ||||||
| 396 | Daifuku Co. Ltd. (Japan) | 9,382 | ||||||
| 947 | Daikin Industries Ltd. (Japan) | 133,980 | ||||||
| 924 | East Japan Railway Co. (Japan) | 54,729 | ||||||
| 2,687 | FANUC Corp. (Japan) | 78,490 | ||||||
| 428 | Fuji Electric Co. Ltd. (Japan) | 26,023 | ||||||
| 1,038 | Hankyu Hanshin Holdings, Inc. (Japan) | 29,939 | ||||||
| 111 | Hikari Tsushin, Inc. (Japan) | 20,076 | ||||||
| 825 | Hitachi Construction Machinery Co. Ltd. (Japan) | 23,834 | ||||||
| 4,932 | Hitachi Ltd. (Japan) | 417,343 | ||||||
| 823 | Hoshizaki Corp. (Japan) | 28,077 | ||||||
| 6,878 | ITOCHU Corp. (Japan) | 299,439 | ||||||
| 3,046 | Japan Airlines Co. Ltd. (Japan) | 56,903 | ||||||
| 3,563 | Kajima Corp. (Japan) | 66,120 | ||||||
| 1,387 | Kawasaki Kisen Kaisha Ltd. (Japan) | 66,287 | ||||||
| 1,206 | Keisei Electric Railway Co. Ltd. (Japan) | 56,364 | ||||||
| 781 | Kintetsu Group Holdings Co. Ltd. (Japan) | 24,035 | ||||||
| 3,575 | Komatsu Ltd. (Japan) | 103,808 | ||||||
| Shares | Description | Value | ||||||
| Common Stocks – (continued) |
| |||||||
| Industrials – (continued) |
| |||||||
| 1,797 | Kubota Corp. (Japan) | $ | 26,342 | |||||
| 965 | Makita Corp. (Japan) | 25,190 | ||||||
| 9,563 | Marubeni Corp. (Japan) | 157,946 | ||||||
| 604 | MINEBEA MITSUMI, Inc. (Japan) | 12,490 | ||||||
| 2,800 | MISUMI Group, Inc. (Japan) | 42,766 | ||||||
| 20,942 | Mitsubishi Corp. (Japan) | 448,447 | ||||||
| 9,501 | Mitsubishi Electric Corp. (Japan) | 151,177 | ||||||
| 1,222 | Mitsubishi Heavy Industries Ltd. (Japan) | 96,547 | ||||||
| 7,433 | Mitsui & Co. Ltd. (Japan) | 325,439 | ||||||
| 1,413 | Mitsui OSK Lines Ltd. (Japan) | 48,450 | ||||||
| 3,978 | MonotaRO Co. Ltd. (Japan) | 38,074 | ||||||
| 828 | NIDEC Corp. (Japan) | 31,428 | ||||||
| 2,852 | NIPPON EXPRESS HOLDINGS, Inc. (Japan) | 150,899 | ||||||
| 3,468 | Nippon Yusen KK (Japan) | 110,572 | ||||||
| 8,423 | Obayashi Corp. (Japan) | 81,574 | ||||||
| 1,201 | Odakyu Electric Railway Co. Ltd. (Japan) | 16,891 | ||||||
| 6,235 | Recruit Holdings Co. Ltd. (Japan) | 251,783 | ||||||
| 917 | Secom Co. Ltd. (Japan) | 66,905 | ||||||
| 1,262 | SG Holdings Co. Ltd. (Japan) | 15,835 | ||||||
| 6,827 | Shimizu Corp. (Japan) | 39,629 | ||||||
| 175 | SMC Corp. (Japan) | 105,407 | ||||||
| 6,605 | Sumitomo Corp. (Japan) | 154,765 | ||||||
| 1,743 | Taisei Corp. (Japan) | 54,816 | ||||||
| 1,120 | Tobu Railway Co. Ltd. (Japan) | 28,638 | ||||||
| 2,080 | Tokyu Corp. (Japan) | 25,897 | ||||||
| 1,776 | TOPPAN Holdings, Inc. (Japan) | 42,279 | ||||||
| 1,070 | TOTO Ltd. (Japan) | 28,947 | ||||||
| 578 | Toyota Industries Corp. (Japan) | 57,503 | ||||||
| 2,785 | Toyota Tsusho Corp. (Japan) | 180,010 | ||||||
| 624 | West Japan Railway Co. (Japan) | 25,978 | ||||||
| 1,139 | Yamato Holdings Co. Ltd. (Japan) | 17,313 | ||||||
| 871 | Yaskawa Electric Corp. (Japan) | 35,609 | ||||||
|
|
|
|||||||
| 4,515,780 | ||||||||
|
|
||||||||
| Information Technology – 16.8% |
| |||||||
| 4,773 | Advantest Corp. (Japan) | 220,361 | ||||||
| 1,304 | Azbil Corp. (Japan) | 38,257 | ||||||
| 7,444 | Brother Industries Ltd. (Japan) | 124,813 | ||||||
| 6,829 | Canon, Inc. (Japan) | 199,710 | ||||||
| 594 | Disco Corp. (Japan) | 191,531 | ||||||
| 1,752 | FUJIFILM Holdings Corp. (Japan) | 111,474 | ||||||
| 1,089 | Fujitsu Ltd. (Japan) | 170,149 | ||||||
| 1,203 | Hamamatsu Photonics KK (Japan) | 43,178 | ||||||
| 207 | Hirose Electric Co. Ltd. (Japan) | 22,011 | ||||||
| 257 | Ibiden Co. Ltd. (Japan) | 11,850 | ||||||
| 870 | Keyence Corp. (Japan) | 407,128 | ||||||
| 5,668 | Kyocera Corp. (Japan) | 83,484 | ||||||
| 348 | Lasertec Corp. (Japan) | 92,888 | ||||||
| 7,586 | Murata Manufacturing Co. Ltd. (Japan) | 153,220 | ||||||
| 2,406 | NEC Corp. (Japan) | 162,200 | ||||||
| 64 | The accompanying notes are an integral part of these financial statements. |
GOLDMAN SACHS ACTIVEBETA® JAPAN EQUITY ETF
| Shares | Description | Value | ||||||
| Common Stocks – (continued) |
| |||||||
| Information Technology – (continued) |
| |||||||
| 2,393 | Nomura Research Institute Ltd. (Japan) | $ | 67,216 | |||||
| 2,514 | NTT Data Group Corp. (Japan) | 40,892 | ||||||
| 227 | Obic Co. Ltd. (Japan) | 35,528 | ||||||
| 812 | Omron Corp. (Japan) | 30,121 | ||||||
| 801 | Oracle Corp. Japan (Japan) | 61,385 | ||||||
| 1,784 | Otsuka Corp. (Japan) | 78,431 | ||||||
| 8,183 | Renesas Electronics Corp. (Japan) | 134,196 | ||||||
| 18,252 | Ricoh Co. Ltd. (Japan) | 151,826 | ||||||
| 692 | Rohm Co. Ltd. (Japan) | 11,755 | ||||||
| 587 | SCREEN Holdings Co. Ltd. (Japan) | 73,478 | ||||||
| 4,247 | SCSK Corp. (Japan) | 78,317 | ||||||
| 4,606 | Seiko Epson Corp. (Japan) | 74,505 | ||||||
| 1,730 | Shimadzu Corp. (Japan) | 47,194 | ||||||
| 1,515 | SUMCO Corp. (Japan) | 23,727 | ||||||
| 1,952 | TDK Corp. (Japan) | 101,545 | ||||||
| 2,397 | TIS, Inc. (Japan) | 54,051 | ||||||
| 2,373 | Tokyo Electron Ltd. (Japan) | 584,570 | ||||||
| 1,459 | Trend Micro, Inc. (Japan) | 72,390 | ||||||
| 3,396 | Yokogawa Electric Corp. (Japan) | 71,791 | ||||||
|
|
|
|||||||
| 3,825,172 | ||||||||
|
|
||||||||
| Materials – 4.6% |
| |||||||
| 4,306 | Asahi Kasei Corp. (Japan) | 29,964 | ||||||
| 9,161 | JFE Holdings, Inc. (Japan) | 150,266 | ||||||
| 298 | JSR Corp. (Japan) | 8,008 | ||||||
| 20,674 | Mitsubishi Chemical Group Corp. (Japan) | 118,585 | ||||||
| 533 | Mitsui Chemicals, Inc. (Japan) | 14,772 | ||||||
| 2,104 | Nippon Paint Holdings Co. Ltd. (Japan) | 15,611 | ||||||
| 1,568 | Nippon Sanso Holdings Corp. (Japan) | 45,446 | ||||||
| 6,136 | Nippon Steel Corp. (Japan)(a) | 152,303 | ||||||
| 963 | Nissan Chemical Corp. (Japan) | 40,233 | ||||||
| 775 | Nitto Denko Corp. (Japan) | 71,198 | ||||||
| 7,304 | Shin-Etsu Chemical Co. Ltd. (Japan) | 311,690 | ||||||
| 392 | Sumitomo Metal Mining Co. Ltd. (Japan) | 10,225 | ||||||
| 16,421 | Toray Industries, Inc. (Japan) | 75,758 | ||||||
|
|
|
|||||||
| 1,044,059 | ||||||||
|
|
||||||||
| Real Estate – 2.3% |
| |||||||
| 560 | Daito Trust Construction Co. Ltd. (Japan) | 66,469 | ||||||
| 3,223 | Daiwa House Industry Co. Ltd. (Japan) | 93,242 | ||||||
| 28 | GLP J REIT (Japan) | 22,244 | ||||||
| 6,239 | Hulic Co. Ltd. (Japan) | 62,236 | ||||||
| 39 | Japan Metropolitan Fund Invest REIT (Japan) | 23,009 | ||||||
| 7 | Japan Real Estate Investment Corp. REIT (Japan) | 25,256 | ||||||
| 19 | KDX Realty Investment Corp. REIT (Japan) | 19,029 | ||||||
| Shares | Description | Value | ||||||
| Common Stocks – (continued) |
| |||||||
| Real Estate – (continued) |
| |||||||
| 1,797 | Mitsubishi Estate Co. Ltd. (Japan) | $ | 27,621 | |||||
| 2,424 | Mitsui Fudosan Co. Ltd. (Japan) | 65,770 | ||||||
| 6 | Nippon Building Fund, Inc. REIT (Japan) | 23,131 | ||||||
| 10 | Nippon Prologis REIT, Inc. REIT (Japan) | 16,743 | ||||||
| 1,318 | Nomura Real Estate Holdings, Inc. (Japan) | 32,785 | ||||||
| 24 | Nomura Real Estate Master Fund, Inc. REIT (Japan) | 23,876 | ||||||
| 498 | Sumitomo Realty & Development Co. Ltd. (Japan) | 14,767 | ||||||
|
|
|
|||||||
| 516,178 | ||||||||
|
|
||||||||
| Utilities – 2.2% |
| |||||||
| 3,493 | Chubu Electric Power Co., Inc. (Japan) | 43,561 | ||||||
| 13,428 | Kansai Electric Power Co., Inc. (The) (Japan) | 172,302 | ||||||
| 4,257 | Osaka Gas Co. Ltd. (Japan) | 85,157 | ||||||
| 2,880 | Tokyo Electric Power Co. Holdings, Inc. (Japan)* | 15,586 | ||||||
| 8,103 | Tokyo Gas Co. Ltd. (Japan) | 177,522 | ||||||
|
|
|
|||||||
| 494,128 | ||||||||
|
|
||||||||
|
TOTAL COMMON STOCKS (Cost $19,114,941) |
22,685,871 | |||||||
|
|
||||||||
| Shares | Dividend Rate | Value | ||||||
| Investment Company – 0.2%(b) |
| |||||||
|
Goldman
Sachs Financial Square Treasury |
||||||||
| 48,147 | 5.195% | 48,147 | ||||||
| (Cost $48,147) | ||||||||
|
|
||||||||
| TOTAL INVESTMENTS BEFORE SECURITIES LENDING REINVESTMENT VEHICLE | ||||||||
| (Cost $19,163,088) | 22,734,018 | |||||||
|
|
||||||||
| Shares | Dividend Rate | Value | ||||||
| Securities Lending Reinvestment Vehicle – 0.7%(b) |
| |||||||
|
Goldman Sachs Financial Square Government Fund - Institutional Shares |
||||||||
| 152,374 | 5.219% | 152,374 | ||||||
| (Cost $152,374) | ||||||||
|
|
||||||||
|
TOTAL INVESTMENTS – 100.6% (Cost $19,315,462) |
$ | 22,886,392 | ||||||
|
|
||||||||
|
LIABILITIES IN EXCESS OF OTHER ASSETS – (0.6)% |
(126,265 | ) | ||||||
|
|
||||||||
|
NET ASSETS – 100.0% |
$ | 22,760,127 | ||||||
|
|
||||||||
The percentage shown for each investment category reflects the value of investments in that category as a percentage of net assets.
| * |
Non-income producing security. |
| The accompanying notes are an integral part of these financial statements. | 65 |
GOLDMAN SACHS ACTIVEBETA® JAPAN EQUITY ETF
|
Schedule of Investments (continued)
February 29, 2024 (Unaudited) |
| (a) |
All or a portion of security is on loan. |
| (b) |
Represents an affiliated issuer. |
| Investment Abbreviations: | ||
| REIT | —Real Estate Investment Trust | |
|
ADDITIONAL INVESTMENT INFORMATION |
FUTURES CONTRACTS — At February 29, 2024, the Fund had the following futures contracts:
| Description | Number of Contracts |
Expiration Date |
Notional Amount |
Unrealized Appreciation/ (Depreciation) |
||||||||
|
|
||||||||||||
|
Long position contracts: |
||||||||||||
|
E-Mini Topix Index Future |
3 | 03/07/24 | $ | 53,738 | $ | 6,702 | ||||||
|
|
||||||||||||
| 66 | The accompanying notes are an integral part of these financial statements. |
GOLDMAN SACHS ACTIVEBETA® U.S. LARGE CAP EQUITY ETF
|
Schedule of Investments
February 29, 2024 (Unaudited) |
| Shares | Description | Value | ||||||
| Common Stocks – 99.8% | ||||||||
| Communication Services – 8.1% | ||||||||
| 1,475,663 | Alphabet, Inc., Class A* | $ | 204,320,299 | |||||
| 1,393,025 | Alphabet, Inc., Class C* | 194,717,035 | ||||||
| 1,663,816 | AT&T, Inc. | 28,168,405 | ||||||
| 30,945 | Charter Communications, Inc., Class A* |
9,095,664 | ||||||
| 1,317,195 | Comcast Corp., Class A | 56,441,806 | ||||||
| 161,469 | Electronic Arts, Inc. | 22,521,696 | ||||||
| 239,406 | Interpublic Group of Cos., Inc. (The) | 7,517,349 | ||||||
| 621,141 | Meta Platforms, Inc., Class A | 304,439,838 | ||||||
| 53,860 | Netflix, Inc.* | 32,473,271 | ||||||
| 121,429 | Omnicom Group, Inc. | 10,733,109 | ||||||
| 348,804 | Pinterest, Inc., Class A* | 12,801,107 | ||||||
| 45,424 | Take-Two Interactive Software, Inc.* | 6,674,148 | ||||||
| 128,857 | T-Mobile US, Inc. | 21,042,348 | ||||||
| 481,987 | Verizon Communications, Inc. | 19,289,120 | ||||||
| 153,973 | Walt Disney Co. (The) | 17,180,307 | ||||||
| 4,596,824 | Warner Bros Discovery, Inc.* | 40,406,083 | ||||||
|
|
|
|||||||
| 987,821,585 | ||||||||
|
|
||||||||
| Consumer Discretionary – 12.2% | ||||||||
| 18,173 | Airbnb, Inc., Class A* | 2,861,702 | ||||||
| 2,110,667 | Amazon.com, Inc.* | 373,081,499 | ||||||
| 14,387 | AutoZone, Inc.* | 43,247,610 | ||||||
| 305,992 | Best Buy Co., Inc. | 24,748,633 | ||||||
| 12,443 | Booking Holdings, Inc.* | 43,162,652 | ||||||
| 558,499 | Carnival Corp.* | 8,857,794 | ||||||
| 5,115 | Chipotle Mexican Grill, Inc.* | 13,753,059 | ||||||
| 209,930 | D.R. Horton, Inc. | 31,371,939 | ||||||
| 70,669 | Darden Restaurants, Inc. | 12,063,905 | ||||||
| 33,954 | Deckers Outdoor Corp.* | 30,408,863 | ||||||
| 30,795 | Domino’s Pizza, Inc. | 13,806,938 | ||||||
| 74,563 | DoorDash, Inc., Class A* | 9,288,313 | ||||||
| 189,486 | DraftKings, Inc., Class A* | 8,208,534 | ||||||
| 367,337 | eBay, Inc. | 17,367,693 | ||||||
| 173,004 | Expedia Group, Inc.* | 23,670,407 | ||||||
| 863,056 | Ford Motor Co. | 10,736,417 | ||||||
| 103,472 | Garmin Ltd. | 14,211,879 | ||||||
| 171,873 | Genuine Parts Co. | 25,653,764 | ||||||
| 52,077 | Hilton Worldwide Holdings, Inc. | 10,640,373 | ||||||
| 298,779 | Home Depot, Inc. (The) | 113,718,275 | ||||||
| 97,299 | Las Vegas Sands Corp. | 5,304,742 | ||||||
| 342,138 | Lennar Corp., Class A | 54,232,294 | ||||||
| 767,700 | LKQ Corp. | 40,143,033 | ||||||
| 224,727 | Lowe’s Cos., Inc. | 54,085,047 | ||||||
| 52,202 | Marriott International, Inc., Class A | 13,043,714 | ||||||
| 145,396 | McDonald’s Corp. | 42,496,343 | ||||||
| 576,003 | MGM Resorts International* | 24,929,410 | ||||||
| 324,223 | NIKE, Inc., Class B | 33,696,496 | ||||||
| 1,592 | NVR, Inc.* | 12,139,907 | ||||||
| 47,168 | O’Reilly Automotive, Inc.* | 51,291,427 | ||||||
| 48,315 | Pool Corp. | 19,235,168 | ||||||
| 468,979 | PulteGroup, Inc. | 50,827,944 | ||||||
| 85,094 | Ross Stores, Inc. | 12,675,602 | ||||||
| 120,771 | Royal Caribbean Cruises Ltd.* | 14,897,103 | ||||||
| 180,746 | Starbucks Corp. | 17,152,795 | ||||||
| 388,667 | Tesla, Inc.* | 78,464,094 | ||||||
| Shares | Description | Value | ||||||
| Common Stocks – (continued) | ||||||||
| Consumer Discretionary – (continued) | ||||||||
| 398,736 | TJX Cos., Inc. (The) | $ | 39,530,687 | |||||
| 143,626 | Tractor Supply Co. | 36,526,964 | ||||||
| 60,440 | Ulta Beauty, Inc.* | 33,154,966 | ||||||
| 215,500 | Yum! Brands, Inc. | 29,829,510 | ||||||
|
|
|
|||||||
| 1,494,517,495 | ||||||||
|
|
||||||||
| Consumer Staples – 7.8% | ||||||||
| 484,377 | Altria Group, Inc. | 19,815,863 | ||||||
| 234,793 | Archer-Daniels-Midland Co. | 12,469,856 | ||||||
| 207,195 | Brown-Forman Corp., Class B | 12,479,355 | ||||||
| 88,836 | Bunge Global SA | 8,383,453 | ||||||
| 146,885 | Church & Dwight Co., Inc. | 14,706,126 | ||||||
| 136,477 | Clorox Co. (The) | 20,923,289 | ||||||
| 633,158 | Coca-Cola Co. (The) | 38,002,143 | ||||||
| 376,838 | Colgate-Palmolive Co. | 32,604,024 | ||||||
| 713,103 | Conagra Brands, Inc. | 20,023,932 | ||||||
| 49,315 | Constellation Brands, Inc., Class A | 12,255,764 | ||||||
| 141,703 | Costco Wholesale Corp. | 105,411,445 | ||||||
| 111,769 | Dollar General Corp. | 16,241,153 | ||||||
| 141,313 | Dollar Tree, Inc.* | 20,727,791 | ||||||
| 117,795 | Estee Lauder Cos., Inc. (The), Class A |
17,501,981 | ||||||
| 220,437 | General Mills, Inc. | 14,147,647 | ||||||
| 134,945 | Hershey Co. (The) | 25,358,864 | ||||||
| 146,891 | J M Smucker Co. (The) | 17,651,892 | ||||||
| 162,300 | Kellanova | 8,950,845 | ||||||
| 720,072 | Kenvue, Inc. | 13,681,368 | ||||||
| 488,236 | Keurig Dr Pepper, Inc. | 14,603,139 | ||||||
| 148,812 | Kimberly-Clark Corp. | 18,031,550 | ||||||
| 509,176 | Kraft Heinz Co. (The) | 17,963,729 | ||||||
| 1,156,788 | Kroger Co. (The) | 57,388,253 | ||||||
| 99,460 | Lamb Weston Holdings, Inc. | 10,165,807 | ||||||
| 90,099 | McCormick & Co., Inc. | 6,204,217 | ||||||
| 312,485 | Mondelez International, Inc., Class A |
22,833,279 | ||||||
| 421,688 | Monster Beverage Corp.* | 24,921,761 | ||||||
| 359,445 | PepsiCo, Inc. | 59,430,636 | ||||||
| 432,392 | Philip Morris International, Inc. | 38,897,984 | ||||||
| 490,991 | Procter & Gamble Co. (The) | 78,038,110 | ||||||
| 282,907 | Sysco Corp. | 22,906,980 | ||||||
| 174,891 | Target Corp. | 26,744,332 | ||||||
| 305,360 | Tyson Foods, Inc., Class A | 16,562,726 | ||||||
| 329,636 | Walgreens Boots Alliance, Inc. | 7,008,061 | ||||||
| 1,654,943 | Walmart, Inc. | 96,996,209 | ||||||
|
|
|
|||||||
| 950,033,564 | ||||||||
|
|
||||||||
| Energy – 2.8% | ||||||||
| 224,962 | APA Corp. | 6,701,618 | ||||||
| 59,631 | Cheniere Energy, Inc. | 9,254,731 | ||||||
| 185,253 | Chevron Corp. | 28,160,309 | ||||||
| 172,944 | ConocoPhillips | 19,463,118 | ||||||
| 182,302 | Devon Energy Corp. | 8,032,226 | ||||||
| 17,681 | Diamondback Energy, Inc. | 3,227,136 | ||||||
| 114,930 | EOG Resources, Inc. | 13,154,888 | ||||||
| 315,857 | EQT Corp. | 11,734,088 | ||||||
| 831,642 | Exxon Mobil Corp. | 86,923,222 | ||||||
| 488,441 | Kinder Morgan, Inc. | 8,493,989 | ||||||
| 314,276 | Marathon Oil Corp. | 7,621,193 | ||||||
| The accompanying notes are an integral part of these financial statements. | 67 |
GOLDMAN SACHS ACTIVEBETA® U.S. LARGE CAP EQUITY ETF
|
Schedule of Investments (continued)
February 29, 2024 (Unaudited) |
| Shares | Description | Value | ||||||
| Common Stocks – (continued) | ||||||||
| Energy – (continued) | ||||||||
| 261,589 | Marathon Petroleum Corp. | $ | 44,268,706 | |||||
| 54,173 | Occidental Petroleum Corp. | 3,283,426 | ||||||
| 120,682 | ONEOK, Inc. | 9,065,632 | ||||||
| 195,767 | Phillips 66 | 27,898,755 | ||||||
| 35,481 | Pioneer Natural Resources Co. | 8,344,776 | ||||||
| 40,531 | Targa Resources Corp. | 3,981,765 | ||||||
| 260,538 | Valero Energy Corp. | 36,855,706 | ||||||
| 281,944 | Williams Cos., Inc. (The) | 10,133,067 | ||||||
|
|
|
|||||||
| 346,598,351 | ||||||||
|
|
||||||||
| Financials – 10.6% | ||||||||
| 217,200 | Aflac, Inc. | 17,536,728 | ||||||
| 37,756 | Allstate Corp. (The) | 6,022,837 | ||||||
| 103,586 | American Express Co. | 22,728,840 | ||||||
| 460,769 | American International Group, Inc. | 33,585,452 | ||||||
| 53,126 | Ameriprise Financial, Inc. | 21,641,407 | ||||||
| 36,465 | Aon PLC, Class A | 11,522,575 | ||||||
| 178,536 | Apollo Global Management, Inc. | 19,960,325 | ||||||
| 242,339 | Arch Capital Group Ltd.* | 21,226,473 | ||||||
| 53,823 | Ares Management Corp., Class A | 7,138,544 | ||||||
| 99,294 | Arthur J Gallagher & Co. | 24,220,785 | ||||||
| 1,183,306 | Bank of America Corp. | 40,847,723 | ||||||
| 498,214 | Bank of New York Mellon Corp. (The) | 27,944,823 | ||||||
| 284,017 | Berkshire Hathaway, Inc., Class B* | 116,276,560 | ||||||
| 10,187 | BlackRock, Inc. | 8,265,121 | ||||||
| 29,587 | Blackstone, Inc. | 3,781,810 | ||||||
| 102,684 | Brown & Brown, Inc. | 8,647,020 | ||||||
| 349,726 | Capital One Financial Corp. | 48,125,795 | ||||||
| 81,034 | Cboe Global Markets, Inc. | 15,558,528 | ||||||
| 173,920 | Charles Schwab Corp. (The) | 11,614,378 | ||||||
| 69,849 | Chubb Ltd. | 17,578,898 | ||||||
| 28,543 | Cincinnati Financial Corp. | 3,253,902 | ||||||
| 635,298 | Citigroup, Inc. | 35,252,686 | ||||||
| 253,318 | Citizens Financial Group, Inc. | 7,951,652 | ||||||
| 75,811 | CME Group, Inc. | 16,704,954 | ||||||
| 192,422 | Discover Financial Services | 23,225,335 | ||||||
| 27,556 | Everest Group Ltd. | 10,164,857 | ||||||
| 26,862 | FactSet Research Systems, Inc. | 12,425,824 | ||||||
| 7,812 | First Citizens BancShares, Inc., Class A |
12,294,604 | ||||||
| 113,306 | Fiserv, Inc.* | 16,913,187 | ||||||
| 25,519 | FleetCor Technologies, Inc.* | 7,126,691 | ||||||
| 169,101 | Hartford Financial Services Group, Inc. (The) | 16,206,640 | ||||||
| 108,983 | Intercontinental Exchange, Inc. | 15,085,427 | ||||||
| 56,923 | Jack Henry & Associates, Inc. | 9,891,510 | ||||||
| 577,865 | JPMorgan Chase & Co. | 107,517,562 | ||||||
| 265,450 | KeyCorp | 3,787,972 | ||||||
| 70,155 | KKR & Co., Inc. | 6,893,430 | ||||||
| 119,959 | Loews Corp. | 9,012,520 | ||||||
| 38,945 | LPL Financial Holdings, Inc. | 10,432,976 | ||||||
| 27,042 | M&T Bank Corp. | 3,778,849 | ||||||
| 6,938 | Markel Group, Inc.* | 10,354,826 | ||||||
| 157,766 | Marsh & McLennan Cos., Inc. | 31,911,329 | ||||||
| 181,212 | Mastercard, Inc., Class A | 86,032,209 | ||||||
| 61,318 | MetLife, Inc. | 4,276,317 | ||||||
| Shares | Description | Value | ||||||
| Common Stocks – (continued) | ||||||||
| Financials – (continued) | ||||||||
| 80,845 | Moody’s Corp. | $ | 30,674,210 | |||||
| 133,325 | Morgan Stanley | 11,471,283 | ||||||
| 113,462 | Nasdaq, Inc. | 6,376,564 | ||||||
| 30,893 | Northern Trust Corp. | 2,537,242 | ||||||
| 41,467 | PNC Financial Services Group, Inc. (The) | 6,103,942 | ||||||
| 334,079 | Principal Financial Group, Inc. | 27,013,628 | ||||||
| 119,194 | Progressive Corp. (The) | 22,594,415 | ||||||
| 64,439 | Prudential Financial, Inc. | 7,023,207 | ||||||
| 30,494 | Raymond James Financial, Inc. | 3,669,038 | ||||||
| 31,030 | S&P Global, Inc. | 13,292,631 | ||||||
| 300,778 | State Street Corp. | 22,176,362 | ||||||
| 1,106,839 | Synchrony Financial | 45,712,451 | ||||||
| 53,655 | Travelers Cos., Inc. (The) | 11,855,609 | ||||||
| 312,223 | Visa, Inc., Class A | 88,246,709 | ||||||
| 126,925 | W R Berkley Corp. | 10,610,930 | ||||||
| 588,664 | Wells Fargo & Co. | 32,723,832 | ||||||
| 27,829 | Willis Towers Watson PLC | 7,586,464 | ||||||
|
|
|
|||||||
| 1,294,388,398 | ||||||||
|
|
||||||||
| Health Care – 12.8% | ||||||||
| 307,729 | Abbott Laboratories | 36,508,969 | ||||||
| 444,622 | AbbVie, Inc. | 78,275,703 | ||||||
| 115,569 | Agilent Technologies, Inc. | 15,874,558 | ||||||
| 35,592 | Align Technology, Inc.* | 10,763,733 | ||||||
| 153,270 | Amgen, Inc. | 41,969,924 | ||||||
| 352,111 | Avantor, Inc.* | 8,676,015 | ||||||
| 37,282 | Becton Dickinson & Co. | 8,781,775 | ||||||
| 60,957 | Biogen, Inc.* | 13,227,059 | ||||||
| 365,647 | Boston Scientific Corp.* | 24,209,488 | ||||||
| 663,776 | Bristol-Myers Squibb Co. | 33,686,632 | ||||||
| 188,845 | Cardinal Health, Inc. | 21,146,863 | ||||||
| 90,593 | Cencora, Inc. | 21,343,711 | ||||||
| 507,410 | Centene Corp.* | 39,796,166 | ||||||
| 135,245 | Cigna Group (The) | 45,461,254 | ||||||
| 53,260 | Cooper Cos., Inc. (The) | 4,985,136 | ||||||
| 648,608 | CVS Health Corp. | 48,236,977 | ||||||
| 122,010 | Danaher Corp. | 30,885,611 | ||||||
| 67,178 | Dexcom, Inc.* | 7,730,173 | ||||||
| 291,951 | Edwards Lifesciences Corp.* | 24,777,881 | ||||||
| 61,911 | Elevance Health, Inc. | 31,032,889 | ||||||
| 229,767 | Eli Lilly & Co. | 173,170,793 | ||||||
| 57,696 | GE HealthCare Technologies, Inc. | 5,266,491 | ||||||
| 371,149 | Gilead Sciences, Inc. | 26,759,843 | ||||||
| 48,639 | HCA Healthcare, Inc. | 15,160,776 | ||||||
| 135,723 | Hologic, Inc.* | 10,016,357 | ||||||
| 56,144 | Humana, Inc. | 19,668,366 | ||||||
| 63,457 | IDEXX Laboratories, Inc.* | 36,502,370 | ||||||
| 276,504 | Incyte Corp.* | 16,136,773 | ||||||
| 29,212 | Insulet Corp.* | 4,790,768 | ||||||
| 47,695 | Intuitive Surgical, Inc.* | 18,391,192 | ||||||
| 54,379 | IQVIA Holdings, Inc.* | 13,440,314 | ||||||
| 588,759 | Johnson & Johnson | 95,013,927 | ||||||
| 54,715 | Laboratory Corp. of America Holdings | 11,809,139 | ||||||
| 53,408 | McKesson Corp. | 27,847,465 | ||||||
| 116,131 | Medtronic PLC | 9,680,680 | ||||||
| 625,999 | Merck & Co., Inc. | 79,595,773 | ||||||
| 68 | The accompanying notes are an integral part of these financial statements. |
GOLDMAN SACHS ACTIVEBETA® U.S. LARGE CAP EQUITY ETF
| Shares | Description | Value | ||||||
| Common Stocks – (continued) | ||||||||
| Health Care – (continued) | ||||||||
| 23,120 | Mettler-Toledo International, Inc.* | $ | 28,835,726 | |||||
| 23,212 | Molina Healthcare, Inc.* | 9,143,439 | ||||||
| 854,536 | Pfizer, Inc. | 22,696,476 | ||||||
| 76,725 | Quest Diagnostics, Inc. | 9,582,185 | ||||||
| 40,972 | Regeneron Pharmaceuticals, Inc.* | 39,582,640 | ||||||
| 377,119 | Royalty Pharma PLC, Class A | 11,441,791 | ||||||
| 18,818 | STERIS PLC | 4,382,900 | ||||||
| 61,590 | Stryker Corp. | 21,499,221 | ||||||
| 59,853 | Thermo Fisher Scientific, Inc. | 34,126,984 | ||||||
| 216,392 | UnitedHealth Group, Inc. | 106,811,091 | ||||||
| 17,097 | Veeva Systems, Inc., Class A* | 3,855,545 | ||||||
| 94,796 | Vertex Pharmaceuticals, Inc.* | 39,884,469 | ||||||
| 5,383,659 | Viatris, Inc. | 66,595,862 | ||||||
| 51,306 | Waters Corp.* | 17,311,671 | ||||||
| 24,200 | West Pharmaceutical Services, Inc. | 8,672,312 | ||||||
| 73,775 | Zimmer Biomet Holdings, Inc. | 9,174,659 | ||||||
| 136,968 | Zoetis, Inc. | 27,164,863 | ||||||
|
|
|
|||||||
| 1,571,383,378 | ||||||||
|
|
||||||||
| Industrials – 9.9% | ||||||||
| 133,604 | 3M Co. | 12,307,600 | ||||||
| 98,714 | AMETEK, Inc. | 17,786,289 | ||||||
| 41,080 | Automatic Data Processing, Inc. | 10,316,420 | ||||||
| 37,449 | Axon Enterprise, Inc.* | 11,510,699 | ||||||
| 60,862 | Boeing Co. (The)* | 12,398,807 | ||||||
| 115,079 | Booz Allen Hamilton Holding Corp. | 16,998,319 | ||||||
| 58,066 | Broadridge Financial Solutions, Inc. | 11,821,076 | ||||||
| 377,757 | Builders FirstSource, Inc.* | 73,730,611 | ||||||
| 33,546 | Carlisle Cos., Inc. | 11,741,100 | ||||||
| 301,182 | Carrier Global Corp. | 16,739,696 | ||||||
| 60,730 | Caterpillar, Inc. | 20,281,391 | ||||||
| 58,966 | Cintas Corp. | 37,066,617 | ||||||
| 275,955 | Copart, Inc.* | 14,667,008 | ||||||
| 215,479 | CSX Corp. | 8,175,273 | ||||||
| 35,521 | Cummins, Inc. | 9,541,296 | ||||||
| 36,821 | Deere & Co. | 13,441,506 | ||||||
| 376,931 | Delta Air Lines, Inc. | 15,932,873 | ||||||
| 67,182 | Dover Corp. | 11,110,559 | ||||||
| 79,552 | Eaton Corp. PLC | 22,990,528 | ||||||
| 122,401 | Emerson Electric Co. | 13,078,547 | ||||||
| 103,855 | Expeditors International of Washington, Inc. | 12,421,058 | ||||||
| 623,765 | Fastenal Co. | 45,541,083 | ||||||
| 114,485 | FedEx Corp. | 28,503,330 | ||||||
| 127,201 | Fortive Corp. | 10,828,621 | ||||||
| 79,530 | General Dynamics Corp. | 21,731,573 | ||||||
| 241,461 | General Electric Co. | 37,882,816 | ||||||
| 52,345 | Graco, Inc. | 4,777,005 | ||||||
| 100,254 | Honeywell International, Inc. | 19,923,477 | ||||||
| 238,761 | Howmet Aerospace, Inc. | 15,889,545 | ||||||
| 45,586 | Hubbell, Inc. | 17,353,223 | ||||||
| 34,533 | IDEX Corp. | 8,146,335 | ||||||
| 96,171 | Illinois Tool Works, Inc. | 25,211,228 | ||||||
| 119,750 | Ingersoll Rand, Inc. | 10,936,767 | ||||||
| Shares | Description | Value | ||||||
| Common Stocks – (continued) | ||||||||
| Industrials – (continued) | ||||||||
| 16,619 | J.B. Hunt Transport Services, Inc. | $ | 3,428,666 | |||||
| 52,403 | Jacobs Solutions, Inc. | 7,684,900 | ||||||
| 117,720 | Johnson Controls International PLC | 6,977,264 | ||||||
| 69,600 | L3Harris Technologies, Inc. | 14,731,536 | ||||||
| 181,846 | Leidos Holdings, Inc. | 23,250,830 | ||||||
| 33,361 | Lennox International, Inc. | 15,720,037 | ||||||
| 42,595 | Lockheed Martin Corp. | 18,240,883 | ||||||
| 205,307 | Masco Corp. | 15,759,365 | ||||||
| 28,160 | Norfolk Southern Corp. | 7,135,181 | ||||||
| 29,917 | Northrop Grumman Corp. | 13,792,335 | ||||||
| 31,848 | Old Dominion Freight Line, Inc. | 14,092,103 | ||||||
| 95,873 | Otis Worldwide Corp. | 9,136,697 | ||||||
| 172,019 | PACCAR, Inc. | 19,075,187 | ||||||
| 53,559 | Parker-Hannifin Corp. | 28,678,167 | ||||||
| 96,788 | Paychex, Inc. | 11,868,145 | ||||||
| 55,775 | Quanta Services, Inc. | 13,470,220 | ||||||
| 126,022 | Republic Services, Inc. | 23,137,639 | ||||||
| 232,101 | RTX Corp. | 20,812,497 | ||||||
| 31,193 | Snap-on, Inc. | 8,598,662 | ||||||
| 408,768 | SS&C Technologies Holdings, Inc. | 26,063,048 | ||||||
| 397,263 | Stanley Black & Decker, Inc. | 35,471,613 | ||||||
| 345,543 | Textron, Inc. | 30,777,515 | ||||||
| 61,555 | Trane Technologies PLC | 17,356,663 | ||||||
| 14,616 | TransDigm Group, Inc. | 17,213,848 | ||||||
| 227,043 | Uber Technologies, Inc.* | 18,049,918 | ||||||
| 40,379 | Union Pacific Corp. | 10,243,749 | ||||||
| 59,298 | United Parcel Service, Inc., Class B | 8,791,521 | ||||||
| 11,946 | United Rentals, Inc. | 8,281,803 | ||||||
| 84,737 | Veralto Corp. | 7,322,972 | ||||||
| 55,694 | Verisk Analytics, Inc. | 13,472,379 | ||||||
| 169,779 | Vertiv Holdings Co., Class A | 11,480,456 | ||||||
| 50,420 | W.W. Grainger, Inc. | 49,081,853 | ||||||
| 98,265 | Waste Management, Inc. | 20,208,197 | ||||||
| 18,401 | Watsco, Inc. | 7,252,202 | ||||||
| 196,500 | Westinghouse Air Brake Technologies Corp. | 27,763,485 | ||||||
| 68,511 | Xylem, Inc. | 8,704,323 | ||||||
|
|
|
|||||||
| 1,213,908,135 | ||||||||
|
|
||||||||
| Information Technology – 29.8% | ||||||||
| 243,847 | Accenture PLC, Class A | 91,388,979 | ||||||
| 134,305 | Adobe, Inc.* | 75,248,405 | ||||||
| 304,221 | Advanced Micro Devices, Inc.* | 58,571,669 | ||||||
| 127,514 | Akamai Technologies, Inc.* | 14,143,853 | ||||||
| 155,965 | Amphenol Corp., Class A | 17,037,617 | ||||||
| 108,120 | Analog Devices, Inc. | 20,739,578 | ||||||
| 13,537 | ANSYS, Inc.* | 4,523,659 | ||||||
| 3,742,061 | Apple, Inc. | 676,377,526 | ||||||
| 296,357 | Applied Materials, Inc. | 59,751,498 | ||||||
| 94,977 | Arista Networks, Inc.* | 26,359,917 | ||||||
| 79,551 | Atlassian Corp., Class A* | 16,500,468 | ||||||
| 97,814 | Autodesk, Inc.* | 25,252,640 | ||||||
| 93,346 | Broadcom, Inc. | 121,395,540 | ||||||
| 184,873 | Cadence Design Systems, Inc.* | 56,271,644 | ||||||
| 43,999 | CDW Corp. | 10,832,994 | ||||||
| 1,020,641 | Cisco Systems, Inc. | 49,368,405 | ||||||
| The accompanying notes are an integral part of these financial statements. | 69 |
GOLDMAN SACHS ACTIVEBETA® U.S. LARGE CAP EQUITY ETF
|
Schedule of Investments (continued)
February 29, 2024 (Unaudited) |
| Shares | Description | Value | ||||||
| Common Stocks – (continued) | ||||||||
| Information Technology – (continued) | ||||||||
| 297,002 | Cognizant Technology Solutions Corp., Class A | $ | 23,469,098 | |||||
| 184,357 | Corning, Inc. | 5,943,670 | ||||||
| 37,677 | Crowdstrike Holdings, Inc., Class A* | 12,213,000 | ||||||
| 46,111 | Datadog, Inc., Class A* | 6,061,752 | ||||||
| 121,432 | Dell Technologies, Inc., Class C | 11,494,753 | ||||||
| 53,599 | Enphase Energy, Inc.* | 6,807,609 | ||||||
| 37,715 | EPAM Systems, Inc.* | 11,480,446 | ||||||
| 24,648 | Fair Isaac Corp.* | 31,300,742 | ||||||
| 510,635 | Fortinet, Inc.* | 35,289,985 | ||||||
| 65,941 | Gartner, Inc.* | 30,699,492 | ||||||
| 564,595 | Gen Digital, Inc. | 12,133,147 | ||||||
| 149,425 | GoDaddy, Inc., Class A* | 17,056,864 | ||||||
| 2,472,396 | Hewlett Packard Enterprise Co. | 37,654,591 | ||||||
| 379,120 | HP, Inc. | 10,740,470 | ||||||
| 28,517 | HubSpot, Inc.* | 17,646,605 | ||||||
| 562,837 | Intel Corp. | 24,230,133 | ||||||
| 286,801 | International Business Machines Corp. | 53,066,789 | ||||||
| 66,181 | Intuit, Inc. | 43,870,723 | ||||||
| 64,312 | Jabil, Inc. | 9,266,716 | ||||||
| 78,134 | Keysight Technologies, Inc.* | 12,056,076 | ||||||
| 43,524 | KLA Corp. | 29,696,425 | ||||||
| 63,798 | Lam Research Corp. | 59,858,473 | ||||||
| 176,870 | Lattice Semiconductor Corp.* | 13,550,011 | ||||||
| 88,158 | Manhattan Associates, Inc.* | 22,333,066 | ||||||
| 145,099 | Microchip Technology, Inc. | 12,208,630 | ||||||
| 129,774 | Micron Technology, Inc. | 11,758,822 | ||||||
| 1,835,114 | Microsoft Corp. | 759,076,555 | ||||||
| 10,858 | MongoDB, Inc.* | 4,859,824 | ||||||
| 16,006 | Monolithic Power Systems, Inc. | 11,524,960 | ||||||
| 87,192 | Motorola Solutions, Inc. | 28,807,365 | ||||||
| 174,762 | NetApp, Inc. | 15,574,789 | ||||||
| 564,310 | NVIDIA Corp. | 446,436,927 | ||||||
| 55,361 | Okta, Inc.* | 5,940,235 | ||||||
| 264,504 | ON Semiconductor Corp.* | 20,874,656 | ||||||
| 278,010 | Oracle Corp. | 31,048,157 | ||||||
| 216,818 | Palantir Technologies, Inc., Class A* | 5,437,795 | ||||||
| 105,769 | Palo Alto Networks, Inc.* | 32,846,563 | ||||||
| 60,026 | PTC, Inc.* | 10,985,358 | ||||||
| 266,416 | QUALCOMM, Inc. | 42,037,781 | ||||||
| 41,589 | Roper Technologies, Inc. | 22,654,776 | ||||||
| 203,642 | Salesforce, Inc.* | 62,888,722 | ||||||
| 46,643 | Seagate Technology Holdings PLC | 4,340,131 | ||||||
| 50,586 | ServiceNow, Inc.* | 39,019,005 | ||||||
| 186,508 | Skyworks Solutions, Inc. | 19,568,419 | ||||||
| 11,754 | Snowflake, Inc., Class A* | 2,213,043 | ||||||
| 55,582 | Splunk, Inc.* | 8,683,020 | ||||||
| 26,926 | Super Micro Computer, Inc.* | 23,321,147 | ||||||
| 71,374 | Synopsys, Inc.* | 40,949,405 | ||||||
| 21,637 | Teledyne Technologies, Inc.* | 9,244,841 | ||||||
| 132,129 | Teradyne, Inc. | 13,687,243 | ||||||
| 216,559 | Texas Instruments, Inc. | 36,236,817 | ||||||
| 82,346 | Trimble, Inc.* | 5,038,752 | ||||||
| 8,374 | Tyler Technologies, Inc.* | 3,660,610 | ||||||
| Shares | Description | Value | ||||||
| Common Stocks – (continued) | ||||||||
| Information Technology – (continued) | ||||||||
| 100,830 | VeriSign, Inc.* | $ | 19,691,091 | |||||
| 66,484 | Western Digital Corp.* | 3,953,803 | ||||||
| 36,666 | Workday, Inc., Class A* | 10,804,004 | ||||||
| 19,770 | Zebra Technologies Corp., Class A* | 5,525,320 | ||||||
| 255,491 | Zoom Video Communications, Inc., Class A* | 18,070,878 | ||||||
| 9,872 | Zscaler, Inc.* | 2,388,728 | ||||||
|
|
|
|||||||
| 3,653,043,200 | ||||||||
|
|
||||||||
| Materials – 1.9% | ||||||||
| 37,347 | Air Products and Chemicals, Inc. | 8,740,692 | ||||||
| 22,263 | Avery Dennison Corp. | 4,820,607 | ||||||
| 77,730 | CF Industries Holdings, Inc. | 6,274,366 | ||||||
| 137,519 | Dow, Inc. | 7,684,562 | ||||||
| 40,471 | DuPont de Nemours, Inc. | 2,800,188 | ||||||
| 59,857 | Ecolab, Inc. | 13,458,248 | ||||||
| 320,482 | International Paper Co. | 11,332,244 | ||||||
| 69,656 | Linde PLC | 31,263,006 | ||||||
| 33,107 | LyondellBasell Industries NV, Class A |
3,319,970 | ||||||
| 11,397 | Martin Marietta Materials, Inc. | 6,584,161 | ||||||
| 714,777 | Mosaic Co. (The) | 22,272,451 | ||||||
| 95,725 | Nucor Corp. | 18,407,918 | ||||||
| 35,013 | Packaging Corp. of America | 6,344,005 | ||||||
| 40,469 | PPG Industries, Inc. | 5,730,410 | ||||||
| 43,260 | Reliance, Inc. | 13,895,977 | ||||||
| 64,392 | RPM International, Inc. | 7,427,617 | ||||||
| 77,491 | Sherwin-Williams Co. (The) | 25,729,337 | ||||||
| 145,149 | Steel Dynamics, Inc. | 19,423,839 | ||||||
| 39,892 | Vulcan Materials Co. | 10,605,288 | ||||||
|
|
|
|||||||
| 226,114,886 | ||||||||
|
|
||||||||
| Real Estate – 1.6% | ||||||||
| 49,381 | Alexandria Real Estate Equities, Inc. REIT | 6,159,292 | ||||||
| 30,776 | American Tower Corp. REIT | 6,120,115 | ||||||
| 30,863 | AvalonBay Communities, Inc. REIT | 5,463,677 | ||||||
| 90,248 | Camden Property Trust REIT | 8,526,631 | ||||||
| 146,559 | CBRE Group, Inc., Class A* | 13,467,306 | ||||||
| 29,173 | Crown Castle, Inc. REIT | 3,207,280 | ||||||
| 10,510 | Equinix, Inc. REIT | 9,341,498 | ||||||
| 34,684 | Equity LifeStyle Properties, Inc. REIT | 2,334,927 | ||||||
| 117,206 | Equity Residential REIT | 7,056,973 | ||||||
| 29,643 | Essex Property Trust, Inc. REIT | 6,859,390 | ||||||
| 187,954 | Gaming and Leisure Properties, Inc. REIT | 8,548,148 | ||||||
| 1,094,423 | Host Hotels & Resorts, Inc. REIT | 22,698,333 | ||||||
| 150,598 | Invitation Homes, Inc. REIT | 5,130,874 | ||||||
| 87,278 | Iron Mountain, Inc. REIT | 6,863,542 | ||||||
| 116,570 | Kimco Realty Corp. REIT | 2,303,423 | ||||||
| 44,267 | Mid-America Apartment Communities, Inc. REIT | 5,563,477 | ||||||
| 44,412 | Prologis, Inc. REIT | 5,918,787 | ||||||
| 21,767 | Public Storage REIT | 6,178,998 | ||||||
| 145,791 | Realty Income Corp. REIT | 7,597,169 | ||||||
| 70 | The accompanying notes are an integral part of these financial statements. |
GOLDMAN SACHS ACTIVEBETA® U.S. LARGE CAP EQUITY ETF
| Shares | Description | Value | ||||||
| Common Stocks – (continued) | ||||||||
| Real Estate – (continued) | ||||||||
| 30,706 | Simon Property Group, Inc. REIT | $ | 4,548,787 | |||||
| 86,025 | Sun Communities, Inc. REIT | 11,506,704 | ||||||
| 118,244 | UDR, Inc. REIT | 4,197,662 | ||||||
| 133,796 | Ventas, Inc. REIT | 5,658,233 | ||||||
| 383,901 | VICI Properties, Inc. REIT | 11,490,157 | ||||||
| 98,307 | W.P. Carey, Inc. REIT | 5,537,633 | ||||||
| 87,635 | Welltower, Inc. REIT | 8,076,442 | ||||||
| 175,152 | Weyerhaeuser Co. REIT | 6,021,726 | ||||||
|
|
|
|||||||
| 196,377,184 | ||||||||
|
|
||||||||
| Utilities – 2.3% | ||||||||
| 171,720 | Alliant Energy Corp. | 8,199,630 | ||||||
| 120,240 | Ameren Corp. | 8,559,886 | ||||||
| 142,930 | American Electric Power Co., Inc. | 12,176,207 | ||||||
| 40,814 | American Water Works Co., Inc. | 4,838,091 | ||||||
| 85,935 | Atmos Energy Corp. | 9,702,921 | ||||||
| 367,261 | CenterPoint Energy, Inc. | 10,099,677 | ||||||
| 116,056 | CMS Energy Corp. | 6,658,133 | ||||||
| 164,988 | Consolidated Edison, Inc. | 14,388,603 | ||||||
| 122,265 | Constellation Energy Corp. | 20,595,539 | ||||||
| 149,810 | Dominion Energy, Inc. | 7,165,412 | ||||||
| 82,357 | DTE Energy Co. | 8,923,381 | ||||||
| 138,161 | Duke Energy Corp. | 12,687,325 | ||||||
| 185,651 | Edison International | 12,627,981 | ||||||
| 75,675 | Entergy Corp. | 7,686,310 | ||||||
| 176,000 | Evergy, Inc. | 8,719,040 | ||||||
| 85,119 | Eversource Energy | 4,996,485 | ||||||
| 409,807 | Exelon Corp. | 14,687,483 | ||||||
| 256,724 | FirstEnergy Corp. | 9,398,666 | ||||||
| 256,113 | NextEra Energy, Inc. | 14,134,876 | ||||||
| 135,155 | NiSource, Inc. | 3,522,139 | ||||||
| 763,684 | PG&E Corp. | 12,745,886 | ||||||
| Shares | Description | Value | ||||||
| Common Stocks – (continued) | ||||||||
| Utilities – (continued) | ||||||||
| 217,798 | PPL Corp. | $ | 5,743,333 | |||||
| 152,410 | Public Service Enterprise Group, Inc. | 9,510,384 | ||||||
| 195,851 | Sempra | 13,827,081 | ||||||
| 231,836 | Southern Co. (The) | 15,590,971 | ||||||
| 172,977 | WEC Energy Group, Inc. | 13,576,965 | ||||||
| 152,230 | Xcel Energy, Inc. | 8,020,999 | ||||||
|
|
|
|||||||
| 278,783,404 | ||||||||
|
|
||||||||
|
TOTAL COMMON STOCKS (Cost $8,161,888,538) |
12,212,969,580 | |||||||
|
|
||||||||
| Shares | Dividend Rate | Value | ||||||
| Investment Company – 0.1%(a) | ||||||||
|
Goldman Sachs Financial Square Treasury Obligations Fund – Institutional Shares |
||||||||
|
13,171,145 |
5.195% | 13,171,145 | ||||||
| (Cost $13,171,145) | ||||||||
|
|
||||||||
| TOTAL INVESTMENTS – 99.9% |
| |||||||
| (Cost $8,175,059,683) | $ | 12,226,140,725 | ||||||
|
|
||||||||
|
OTHER ASSETS IN EXCESS OF LIABILITIES – 0.1% |
14,823,354 | |||||||
|
|
||||||||
| NET ASSETS – 100.0% | $ | 12,240,964,079 | ||||||
|
|
||||||||
The percentage shown for each investment category reflects the value of investments in that category as a percentage of net assets.
| * |
Non-income producing security. |
| (a) |
Represents an affiliated issuer. |
|
| ||
| Investment Abbreviations: | ||
| PLC | —Public Limited Company | |
| REIT | —Real Estate Investment Trust | |
|
| ||
|
ADDITIONAL INVESTMENT INFORMATION |
FUTURES CONTRACTS — At February 29, 2024, the Fund had the following futures contracts:
| Description | Number of Contracts |
Expiration Date |
Notional Amount |
Unrealized Appreciation/ (Depreciation) |
||||||||
|
|
||||||||||||
|
Long position contracts: |
||||||||||||
|
S&P 500 E-Mini Index |
24 | 03/15/24 | $ | 6,124,500 | $ | 532,826 | ||||||
|
|
||||||||||||
| The accompanying notes are an integral part of these financial statements. | 71 |
GOLDMAN SACHS ACTIVEBETA® U.S. SMALL CAP EQUITY ETF
|
Schedule of Investments
February 29, 2024 (Unaudited) |
|
Shares |
Description | Value | ||||||
| Common Stocks – 99.2% |
| |||||||
| Communication Services – 2.0% |
| |||||||
| 9,087 | AMC Networks, Inc., Class A* | $ | 117,586 | |||||
| 17,648 | AST SpaceMobile, Inc.* | 55,944 | ||||||
| 3,176 | Atlanta Braves Holdings, Inc., Class A*(a) | 133,233 | ||||||
| 4,331 | Atlanta Braves Holdings, Inc., Class C* | 169,429 | ||||||
| 11,291 | Cardlytics, Inc.* | 93,602 | ||||||
| 22,285 | Cargurus, Inc.* | 493,390 | ||||||
| 26,694 | Cars.com, Inc.* | 489,568 | ||||||
| 10,231 | Cinemark Holdings, Inc.* | 178,122 | ||||||
| 6,277 | Cogent Communications Holdings, Inc. | 507,872 | ||||||
| 30,530 | DHI Group, Inc.* | 86,400 | ||||||
| 13,254 | EchoStar Corp., Class A* | 173,760 | ||||||
| 17,821 | EverQuote, Inc., Class A* | 285,492 | ||||||
| 18,048 | EW Scripps Co. (The), Class A* | 72,734 | ||||||
| 29,640 | fuboTV, Inc.* | 61,355 | ||||||
| 88,080 | Gannett Co., Inc.* | 187,610 | ||||||
| 14,776 | Gogo, Inc.* | 120,572 | ||||||
| 18,713 | Gray Television, Inc. | 109,284 | ||||||
| 13,723 | IDT Corp., Class B* | 510,633 | ||||||
| 34,604 | iHeartMedia, Inc., Class A* | 95,853 | ||||||
| 7,936 | IMAX Corp.* | 135,944 | ||||||
| 8,469 | Integral Ad Science Holding Corp.* | 87,739 | ||||||
| 12,758 | John Wiley & Sons, Inc., Class A | 425,479 | ||||||
| 7,256 | Liberty Latin America Ltd., Class A (Puerto Rico)* | 46,656 | ||||||
| 34,769 | Liberty Latin America Ltd., Class C (Puerto Rico)* | 226,694 | ||||||
| 8,693 | Lions Gate Entertainment Corp., Class A*(a) | 84,409 | ||||||
| 9,216 | Lions Gate Entertainment Corp., Class B* | 83,681 | ||||||
| 27,070 | Loop Media, Inc.* | 13,535 | ||||||
| 4,282 | Madison Square Garden Entertainment Corp.* | 164,814 | ||||||
| 15,079 | Magnite, Inc.* | 181,250 | ||||||
| 8,852 | Marcus Corp. (The) | 129,859 | ||||||
| 20,250 | Ooma, Inc.* | 206,550 | ||||||
| 24,438 | Playstudios, Inc.*(a) | 57,918 | ||||||
| 2,410 | QuinStreet, Inc.* | 35,258 | ||||||
| 12,266 | Scholastic Corp. | 483,771 | ||||||
| 7,580 | Shutterstock, Inc. | 369,601 | ||||||
| 4,059 | Sphere Entertainment Co.* | 175,755 | ||||||
| 10,553 | Spok Holdings, Inc. | 189,637 | ||||||
| 25,618 | Stagwell, Inc.* | 136,800 | ||||||
| 40,107 | TEGNA, Inc. | 561,899 | ||||||
| 5,028 | Telephone and Data Systems, Inc. | 76,928 | ||||||
| 11,573 | Thryv Holdings, Inc.* | 242,339 | ||||||
| 118,595 | Tingo Group, Inc.*(b) | — | ||||||
| 84,826 | TrueCar, Inc.* | 295,195 | ||||||
| 21,616 | Yelp, Inc.* | 830,919 | ||||||
| 6,378 | Ziff Davis, Inc.* | 438,551 | ||||||
| 7,670 | ZipRecruiter, Inc., Class A* | 97,562 | ||||||
|
|
|
|||||||
| 9,721,182 | ||||||||
|
|
||||||||
|
Shares |
Description | Value | ||||||
| Common Stocks – (continued) |
| |||||||
| Consumer Discretionary – 11.8% |
| |||||||
| 19,792 | 1-800-Flowers.com, Inc., Class A* | $ | 206,233 | |||||
| 26,696 | 2U, Inc.* | 12,029 | ||||||
| 19,030 | Aaron’s Co., Inc. (The) | 147,483 | ||||||
| 15,184 | Abercrombie & Fitch Co., Class A* | 1,939,908 | ||||||
| 12,905 | Academy Sports & Outdoors, Inc. | 964,262 | ||||||
| 9,949 | Acushnet Holdings Corp. | 640,915 | ||||||
| 13,396 | Adient PLC* | 454,660 | ||||||
| 12,027 | Adtalem Global Education, Inc.* | 595,337 | ||||||
| 35,416 | American Axle & Manufacturing Holdings, Inc.* | 245,079 | ||||||
| 27,633 | American Eagle Outfitters, Inc. | 656,284 | ||||||
| 4,439 | Asbury Automotive Group, Inc.* | 926,996 | ||||||
| 7,229 | Atmus Filtration Technologies, Inc.*(a) | 172,556 | ||||||
| 9,490 | Beazer Homes USA, Inc.* | 297,322 | ||||||
| 7,456 | Beyond, Inc.* | 250,000 | ||||||
| 4,348 | BJ’s Restaurants, Inc.* | 152,267 | ||||||
| 13,939 | Bloomin’ Brands, Inc. | 378,862 | ||||||
| 4,788 | Boot Barn Holdings, Inc.* | 442,890 | ||||||
| 7,236 | Brinker International, Inc.* | 335,316 | ||||||
| 10,176 | Buckle, Inc. (The) | 416,605 | ||||||
| 6,546 | Build-A-Bear Workshop, Inc. | 156,711 | ||||||
| 15,533 | Caleres, Inc. | 599,729 | ||||||
| 5,376 | Camping World Holdings, Inc., Class A | 143,485 | ||||||
| 31,422 | CarParts.com, Inc.* | 80,126 | ||||||
| 5,792 | Carriage Services, Inc. | 143,757 | ||||||
| 33,125 | Carrols Restaurant Group, Inc. | 313,694 | ||||||
| 5,685 | Carvana Co.* | 431,662 | ||||||
| 1,469 | Cavco Industries, Inc.* | 547,305 | ||||||
| 3,998 | Century Communities, Inc. | 344,987 | ||||||
| 5,196 | Cheesecake Factory, Inc. (The) | 183,834 | ||||||
| 19,255 | Chegg, Inc.* | 172,140 | ||||||
| 4,528 | Chuy’s Holdings, Inc.* | 153,182 | ||||||
| 6,933 | Cooper-Standard Holdings, Inc.* | 97,478 | ||||||
| 16,203 | Coursera, Inc.* | 260,382 | ||||||
| 1,791 | Cracker Barrel Old Country Store, Inc. | 118,439 | ||||||
| 24,535 | Dana, Inc. | 306,688 | ||||||
| 5,128 | Dave & Buster’s Entertainment, Inc.* | 316,603 | ||||||
| 16,905 | Denny’s Corp.* | 156,033 | ||||||
| 11,868 | Designer Brands, Inc., Class A | 125,326 | ||||||
| 28,077 | Destination XL Group, Inc.* | 112,027 | ||||||
| 1,993 | Dillard’s, Inc., Class A | 826,557 | ||||||
| 5,764 | Dorman Products, Inc.* | 543,084 | ||||||
| 3,175 | Dream Finders Homes, Inc., Class A* | 124,238 | ||||||
| 2,377 | Duolingo, Inc.* | 568,103 | ||||||
| 11,685 | El Pollo Loco Holdings, Inc.* | 105,866 | ||||||
| 19,475 | Ethan Allen Interiors, Inc. | 651,049 | ||||||
| 12,305 | Everi Holdings, Inc.* | 145,937 | ||||||
| 49,437 | Figs, Inc., Class A*(a) | 258,556 | ||||||
| 5,595 | Foot Locker, Inc. | 192,636 | ||||||
| 26,732 | Fossil Group, Inc.* | 28,336 | ||||||
| 72 | The accompanying notes are an integral part of these financial statements. |
GOLDMAN SACHS ACTIVEBETA® U.S. SMALL CAP EQUITY ETF
|
Shares |
Description | Value | ||||||
| Common Stocks – (continued) | ||||||||
| Consumer Discretionary – (continued) | ||||||||
| 6,683 | Fox Factory Holding Corp.* | $ | 338,093 | |||||
| 20,679 | Frontdoor, Inc.* | 648,493 | ||||||
| 9,364 | Genesco, Inc.* | 298,899 | ||||||
| 6,996 | Gentherm, Inc.* | 397,793 | ||||||
| 11,027 | G-III Apparel Group Ltd.* | 366,868 | ||||||
| 5,068 | Golden Entertainment, Inc. | 187,820 | ||||||
| 45,501 | Goodyear Tire & Rubber Co. (The)* | 540,552 | ||||||
| 37,801 | GoPro, Inc., Class A* | 88,454 | ||||||
| 832 | Graham Holdings Co., Class B | 584,339 | ||||||
| 6,759 | Green Brick Partners, Inc.* | 395,402 | ||||||
| 3,964 | Group 1 Automotive, Inc. | 1,072,857 | ||||||
| 8,445 | Guess?, Inc. | 214,334 | ||||||
| 14,079 | Haverty Furniture Cos., Inc. | 482,910 | ||||||
| 3,325 | Helen of Troy Ltd.* | 415,625 | ||||||
| 6,216 | Hibbett, Inc. | 509,401 | ||||||
| 10,835 | Hilton Grand Vacations, Inc.* | 486,275 | ||||||
| 2,162 | Hovnanian Enterprises, Inc., Class A* | 338,699 | ||||||
| 20,127 | Inspired Entertainment, Inc.* | 199,257 | ||||||
| 4,304 | Installed Building Products, Inc. | 1,028,355 | ||||||
| 15,870 | International Game Technology PLC | 431,188 | ||||||
| 3,164 | iRobot Corp.*(a) | 36,101 | ||||||
| 3,665 | Jack in the Box, Inc. | 267,545 | ||||||
| 6,750 | JAKKS Pacific, Inc.* | 236,992 | ||||||
| 3,825 | Johnson Outdoors, Inc., Class A | 175,797 | ||||||
| 10,284 | KB Home | 683,166 | ||||||
| 10,764 | Kontoor Brands, Inc. | 636,260 | ||||||
| 9,714 | Krispy Kreme, Inc. | 125,699 | ||||||
| 23,593 | Laureate Education, Inc. | 316,382 | ||||||
| 15,345 | La-Z-Boy, Inc. | 582,957 | ||||||
| 6,989 | LCI Industries | 880,474 | ||||||
| 17,351 | Leslie’s, Inc.* | 137,073 | ||||||
| 1,431 | LGI Homes, Inc.* | 163,263 | ||||||
| 7,297 | Life Time Group Holdings, Inc.* | 100,261 | ||||||
| 10,637 | Light & Wonder, Inc.* | 1,069,125 | ||||||
| 22,146 | Lincoln Educational Services Corp.* | 222,789 | ||||||
| 8,716 | Lovesac Co. (The)* | 200,817 | ||||||
| 6,488 | M/I Homes, Inc.* | 823,911 | ||||||
| 5,500 | Malibu Boats, Inc., Class A* | 240,020 | ||||||
| 5,417 | MarineMax, Inc.* | 179,844 | ||||||
| 14,759 | MasterCraft Boat Holdings, Inc.* | 323,665 | ||||||
| 8,751 | MDC Holdings, Inc. | 548,688 | ||||||
| 6,158 | Meritage Homes Corp. | 970,870 | ||||||
| 14,340 | Modine Manufacturing Co.* | 1,286,441 | ||||||
| 3,699 | Monarch Casino & Resort, Inc. | 260,225 | ||||||
| 4,005 | Monro, Inc. | 134,448 | ||||||
| 8,715 | Movado Group, Inc. | 250,208 | ||||||
| 2,177 | Nathan’s Famous, Inc. | 152,934 | ||||||
| 9,387 | National Vision Holdings, Inc.* | 219,656 | ||||||
| 35,216 | Nerdy, Inc.* | 102,126 | ||||||
| 9,520 | ODP Corp. (The)* | 537,690 | ||||||
| 11,799 | OneSpaWorld Holdings Ltd. (Bahamas)* | 153,859 | ||||||
| 6,573 | Oxford Industries, Inc. | 666,436 | ||||||
| 7,889 | Papa John’s International, Inc. | 567,140 | ||||||
|
Shares |
Description | Value | ||||||
| Common Stocks – (continued) | ||||||||
| Consumer Discretionary – (continued) | ||||||||
| 8,263 | Patrick Industries, Inc. | $ | 991,064 | |||||
| 61,627 | Perdoceo Education Corp. | 1,097,577 | ||||||
| 16,874 | PlayAGS, Inc.* | 156,591 | ||||||
| 22,043 | Potbelly Corp.* | 305,957 | ||||||
| 968 | Purple Innovation, Inc. | 1,800 | ||||||
| 3,312 | RCI Hospitality Holdings, Inc. | 186,664 | ||||||
| 8,262 | Red Rock Resorts, Inc., Class A | 479,113 | ||||||
| 8,210 | Revolve Group, Inc.*(a) | 180,045 | ||||||
| 40,871 | Rush Street Interactive, Inc.* | 239,095 | ||||||
| 22,718 | Sabre Corp.* | 60,203 | ||||||
| 24,806 | Sally Beauty Holdings, Inc.* | 313,300 | ||||||
| 2,384 | Shake Shack, Inc., Class A* | 253,467 | ||||||
| 14,665 | Shoe Carnival, Inc. | 480,572 | ||||||
| 8,942 | Signet Jewelers Ltd. | 909,938 | ||||||
| 4,924 | Six Flags Entertainment Corp.* | 124,774 | ||||||
| 7,704 | Skyline Champion Corp.* | 645,518 | ||||||
| 9,216 | Sleep Number Corp.* | 152,248 | ||||||
| 22,687 | Smith & Wesson Brands, Inc. | 311,493 | ||||||
| 5,008 | Sonic Automotive, Inc., Class A | 262,920 | ||||||
| 24,370 | Sonos, Inc.* | 462,055 | ||||||
| 10,481 | Standard Motor Products, Inc. | 332,877 | ||||||
| 17,697 | Steven Madden Ltd. | 757,786 | ||||||
| 32,920 | Stitch Fix, Inc., Class A* | 106,332 | ||||||
| 14,592 | Stoneridge, Inc.* | 256,381 | ||||||
| 4,169 | Strategic Education, Inc. | 461,884 | ||||||
| 18,937 | Stride, Inc.* | 1,131,486 | ||||||
| 6,373 | Sturm Ruger & Co., Inc. | 276,078 | ||||||
| 8,933 | Sweetgreen, Inc., Class A* | 113,806 | ||||||
| 20,867 | Target Hospitality Corp.*(a) | 201,993 | ||||||
| 21,857 | Taylor Morrison Home Corp.* | 1,237,325 | ||||||
| 7,906 | Topgolf Callaway Brands Corp.* | 112,581 | ||||||
| 23,092 | Tri Pointe Homes, Inc.* | 816,995 | ||||||
| 23,240 | Udemy, Inc.* | 262,612 | ||||||
| 5,599 | United Parks & Resorts, Inc.* | 287,509 | ||||||
| 21,850 | Upbound Group, Inc. | 737,656 | ||||||
| 8,044 | Urban Outfitters, Inc.* | 334,228 | ||||||
| 22,093 | Vera Bradley, Inc.* | 172,325 | ||||||
| 13,648 | Vista Outdoor, Inc.* | 425,818 | ||||||
| 2,773 | Visteon Corp.* | 313,682 | ||||||
| 1,652 | Winmark Corp. | 627,017 | ||||||
| 9,910 | Winnebago Industries, Inc. | 710,844 | ||||||
| 13,660 | Wolverine World Wide, Inc. | 138,922 | ||||||
| 6,916 | Worthington Enterprises, Inc. | 429,622 | ||||||
| 42,228 | WW International, Inc.* | 131,751 | ||||||
| 10,425 | XPEL, Inc.* | 548,147 | ||||||
| 11,831 | Zumiez, Inc.* | 208,462 | ||||||
|
|
|
|||||||
| 58,469,943 | ||||||||
|
|
||||||||
| Consumer Staples – 3.7% |
| |||||||
| 5,510 | Andersons, Inc. (The) | 304,593 | ||||||
| 10,828 | B&G Foods, Inc. | 125,063 | ||||||
| 31,553 | Beauty Health Co. (The)* | 105,072 | ||||||
| 18,709 | BellRing Brands, Inc.* | 1,065,478 | ||||||
| 13,075 | Cal-Maine Foods, Inc. | 751,682 | ||||||
| 5,152 | Central Garden & Pet Co.* | 226,018 | ||||||
| 12,201 | Central Garden & Pet Co., Class A* | 459,856 | ||||||
| 3,923 | Chefs’ Warehouse, Inc. (The)* | 149,113 | ||||||
| 1,761 | Coca-Cola Consolidated, Inc. | 1,480,649 | ||||||
| The accompanying notes are an integral part of these financial statements. | 73 |
GOLDMAN SACHS ACTIVEBETA® U.S. SMALL CAP EQUITY ETF
|
Schedule of Investments (continued)
February 29, 2024 (Unaudited) |
|
Shares |
Description | Value | ||||||
| Common Stocks – (continued) |
| |||||||
| Consumer Staples – (continued) |
| |||||||
| 8,716 | Dole PLC | $ | 102,936 | |||||
| 11,622 | Edgewell Personal Care Co. | 443,844 | ||||||
| 6,812 | elf Beauty, Inc.* | 1,420,506 | ||||||
| 10,429 | Energizer Holdings, Inc. | 297,748 | ||||||
| 10,275 | Fresh Del Monte Produce, Inc. | 245,881 | ||||||
| 19,383 | Hain Celestial Group, Inc. (The)* | 193,830 | ||||||
| 21,327 | Herbalife Ltd.* | 188,317 | ||||||
| 8,030 | Ingles Markets, Inc., Class A | 618,390 | ||||||
| 3,948 | Inter Parfums, Inc. | 579,251 | ||||||
| 2,346 | J & J Snack Foods Corp. | 340,358 | ||||||
| 4,561 | John B. Sanfilippo & Son, Inc. | 466,910 | ||||||
| 3,535 | Lancaster Colony Corp. | 731,462 | ||||||
| 3,110 | Medifast, Inc. | 124,680 | ||||||
| 1,395 | MGP Ingredients, Inc. | 118,826 | ||||||
| 11,872 | National Beverage Corp.* | 624,942 | ||||||
| 10,402 | Nu Skin Enterprises, Inc., Class A | 130,025 | ||||||
| 2,491 | PriceSmart, Inc. | 209,593 | ||||||
| 36,559 | Primo Water Corp. | 592,621 | ||||||
| 11,752 | Simply Good Foods Co. (The)* | 416,961 | ||||||
| 6,143 | Sovos Brands, Inc.* | 139,999 | ||||||
| 18,184 | SpartanNash Co. | 383,137 | ||||||
| 24,203 | Sprouts Farmers Market, Inc.* | 1,511,235 | ||||||
| 10,957 | TreeHouse Foods, Inc.* | 392,151 | ||||||
| 7,324 | Turning Point Brands, Inc. | 185,297 | ||||||
| 16,836 | United Natural Foods, Inc.* | 262,810 | ||||||
| 6,765 | Universal Corp. | 324,788 | ||||||
| 5,547 | USANA Health Sciences, Inc.* | 267,698 | ||||||
| 7,432 | Utz Brands, Inc. | 131,472 | ||||||
| 39,933 | Vector Group Ltd. | 445,652 | ||||||
| 7,787 | Village Super Market, Inc., Class A | 212,975 | ||||||
| 4,873 | Vita Coco Co., Inc. (The)* | 127,185 | ||||||
| 17,300 | Vital Farms, Inc.* | 310,881 | ||||||
| 3,039 | WD-40 Co. | 815,637 | ||||||
| 5,694 | Weis Markets, Inc. | 369,768 | ||||||
|
|
|
|||||||
| 18,395,290 | ||||||||
|
|
||||||||
| Energy – 6.6% | ||||||||
| 32,793 | Amplify Energy Corp.* | 198,070 | ||||||
| 27,739 | Archrock, Inc. | 506,792 | ||||||
| 24,657 | Ardmore Shipping Corp. (Ireland) | 400,183 | ||||||
| 20,882 | Berry Corp. | 147,218 | ||||||
| 20,764 | Borr Drilling Ltd. (Mexico)*(a) | 124,999 | ||||||
| 6,786 | Bristow Group, Inc.* | 182,883 | ||||||
| 6,763 | Cactus, Inc., Class A | 310,422 | ||||||
| 18,366 | California Resources Corp. | 958,154 | ||||||
| 10,180 | Callon Petroleum Co.* | 317,209 | ||||||
| 3,103 | Centrus Energy Corp., Class A* | 126,571 | ||||||
| 25,470 | ChampionX Corp. | 791,098 | ||||||
| 6,955 | Chord Energy Corp. | 1,129,840 | ||||||
| 9,245 | Civitas Resources, Inc. | 634,947 | ||||||
| 25,027 | CNX Resources Corp.* | 524,316 | ||||||
| 12,682 | CONSOL Energy, Inc. | 1,088,369 | ||||||
| 11,813 | CVR Energy, Inc. | 391,955 | ||||||
| 9,608 | Delek US Holdings, Inc. | 245,100 | ||||||
| 33,886 | DHT Holdings, Inc. | 366,647 | ||||||
| 16,875 | Diamond Offshore Drilling, Inc.* | 187,144 | ||||||
|
Shares |
Description | Value | ||||||
| Common Stocks – (continued) | ||||||||
| Energy – (continued) | ||||||||
| 10,600 | Dorian LPG Ltd. | $ | 383,190 | |||||
| 5,269 | Dril-Quip, Inc.* | 119,079 | ||||||
| 3,984 | Empire Petroleum Corp.* | 23,625 | ||||||
| 19,302 | Energy Fuels, Inc.*(a) | 122,182 | ||||||
| 43,040 | Equitrans Midstream Corp. | 460,098 | ||||||
| 29,487 | Evolution Petroleum Corp. | 172,794 | ||||||
| 7,868 | Expro Group Holdings NV* | 140,759 | ||||||
| 3,480 | FLEX LNG Ltd. (Norway)(a) | 87,835 | ||||||
| 6,633 | Golar LNG Ltd. (Cameroon) | 134,584 | ||||||
| 4,261 | Green Plains, Inc.* | 90,759 | ||||||
| 5,806 | Gulfport Energy Corp.* | 824,394 | ||||||
| 43,898 | Helix Energy Solutions Group, Inc.* | 395,082 | ||||||
| 11,572 | Helmerich & Payne, Inc. | 444,249 | ||||||
| 10,469 | International Seaways, Inc. | 554,124 | ||||||
| 2,698 | Kinetik Holdings, Inc. | 95,293 | ||||||
| 11,843 | KLX Energy Services Holdings, Inc.* | 96,165 | ||||||
| 48,037 | Kosmos Energy Ltd. (Ghana)* | 294,947 | ||||||
| 51,438 | Liberty Energy, Inc. | 1,099,744 | ||||||
| 56,984 | Magnolia Oil & Gas Corp., Class A | 1,292,397 | ||||||
| 22,851 | Matador Resources Co. | 1,443,041 | ||||||
| 22,514 | Murphy Oil Corp. | 893,130 | ||||||
| 2,109 | Nabors Industries Ltd.* | 165,282 | ||||||
| 3,727 | NACCO Industries, Inc., Class A | 123,848 | ||||||
| 11,863 | Noble Corp. PLC | 495,992 | ||||||
| 23,554 | Nordic American Tankers Ltd. | 95,865 | ||||||
| 16,864 | Northern Oil & Gas, Inc. | 602,551 | ||||||
| 20,124 | Oceaneering International, Inc.* | 397,650 | ||||||
| 25,629 | Oil States International, Inc.* | 138,140 | ||||||
| 23,183 | Overseas Shipholding Group, Inc., Class A | 140,953 | ||||||
| 9,202 | Par Pacific Holdings, Inc.* | 332,376 | ||||||
| 51,774 | Patterson-UTI Energy, Inc. | 599,025 | ||||||
| 23,085 | PBF Energy, Inc., Class A | 1,078,070 | ||||||
| 21,661 | Peabody Energy Corp. | 536,543 | ||||||
| 62,059 | Permian Resources Corp. | 965,638 | ||||||
| 22,439 | ProFrac Holding Corp., Class A* | 183,551 | ||||||
| 39,915 | ProPetro Holding Corp.* | 295,371 | ||||||
| 7,003 | REX American Resources Corp.* | 307,992 | ||||||
| 21,555 | Ring Energy, Inc.* | 30,824 | ||||||
| 71,337 | RPC, Inc. | 527,180 | ||||||
| 12,552 | SandRidge Energy, Inc. | 163,678 | ||||||
| 9,783 | Scorpio Tankers, Inc. (Monaco) | 656,733 | ||||||
| 4,623 | Seadrill Ltd. (Norway)* | 195,091 | ||||||
| 20,706 | SFL Corp. Ltd. (Norway) | 276,632 | ||||||
| 7,906 | SilverBow Resources, Inc.* | 224,451 | ||||||
| 10,173 | Sitio Royalties Corp., Class A | 232,148 | ||||||
| 37,780 | SM Energy Co. | 1,653,631 | ||||||
| 387 | Solaris Oilfield Infrastructure, Inc., Class A | 3,278 | ||||||
| 22,741 | Talos Energy, Inc.* | 299,954 | ||||||
| 39,557 | Teekay Corp. (Bermuda)* | 299,446 | ||||||
| 10,677 | Teekay Tankers Ltd., Class A (Canada) | 585,313 | ||||||
| 77,880 | TETRA Technologies, Inc.* | 303,732 | ||||||
| 3,883 | Tidewater, Inc.* | 271,926 | ||||||
| 74 | The accompanying notes are an integral part of these financial statements. |
GOLDMAN SACHS ACTIVEBETA® U.S. SMALL CAP EQUITY ETF
|
Shares |
Description | Value | ||||||
| Common Stocks – (continued) |
| |||||||
| Energy – (continued) |
| |||||||
| 25,720 | Uranium Energy Corp.* | $ | 166,666 | |||||
| 19,108 | US Silica Holdings, Inc.* | 219,742 | ||||||
| 46,774 | VAALCO Energy, Inc. | 208,612 | ||||||
| 6,907 | Valaris Ltd.* | 435,486 | ||||||
| 30,420 | Vertex Energy, Inc.* | 41,067 | ||||||
| 5,259 | Vital Energy, Inc.* | 264,685 | ||||||
| 85,409 | W&T Offshore, Inc. | 257,935 | ||||||
| 9,496 | Weatherford International PLC* | 974,385 | ||||||
| 14,498 | World Kinect Corp. | 353,171 | ||||||
|
|
|
|||||||
| 32,904,001 | ||||||||
|
|
||||||||
| Financials – 17.0% | ||||||||
| 3,638 | 1st Source Corp. | 181,100 | ||||||
| 1,267 | ACNB Corp. | 44,649 | ||||||
| 5,489 | Amalgamated Financial Corp. | 126,686 | ||||||
| 12,788 | A-Mark Precious Metals, Inc. | 328,524 | ||||||
| 25,926 | Ambac Financial Group, Inc.* | 424,149 | ||||||
| 4,786 | Amerant Bancorp, Inc. | 101,415 | ||||||
| 24,530 | American Equity Investment Life Holding Co.* | 1,362,396 | ||||||
| 4,166 | American National Bankshares, Inc. | 187,970 | ||||||
| 13,978 | Ameris Bancorp | 647,601 | ||||||
| 6,680 | AMERISAFE, Inc. | 352,437 | ||||||
| 4,466 | Ames National Corp. | 84,720 | ||||||
| 28,851 | Apollo Commercial Real Estate Finance, Inc. REIT | 323,420 | ||||||
| 33,358 | Arbor Realty Trust, Inc. REIT | 446,997 | ||||||
| 861 | Ares Commercial Real Estate Corp. REIT | 6,492 | ||||||
| 8,515 | Arrow Financial Corp. | 204,190 | ||||||
| 18,203 | Artisan Partners Asset Management, Inc., Class A | 784,003 | ||||||
| 4,686 | AssetMark Financial Holdings, Inc.* | 165,650 | ||||||
| 23,242 | Associated Banc-Corp. | 484,363 | ||||||
| 12,303 | Atlantic Union Bankshares Corp. | 409,198 | ||||||
| 2,168 | Atlanticus Holdings Corp.* | 71,869 | ||||||
| 12,862 | AvidXchange Holdings, Inc.* | 170,936 | ||||||
| 19,002 | Axos Financial, Inc.* | 990,384 | ||||||
| 8,183 | Banc of California, Inc. | 119,717 | ||||||
| 6,601 | BancFirst Corp. | 579,172 | ||||||
| 11,130 | Banco Latinoamericano de Comercio Exterior SA, Class E (Panama) | 311,306 | ||||||
| 14,602 | Bancorp, Inc. (The)* | 651,833 | ||||||
| 2,391 | Bank First Corp. | 206,821 | ||||||
| 5,910 | Bank of Hawaii Corp. | 356,255 | ||||||
| 20,569 | Bank of NT Butterfield & Son Ltd. (The) (Bermuda) | 614,807 | ||||||
| 15,500 | BankUnited, Inc. | 415,710 | ||||||
| 5,182 | Bankwell Financial Group, Inc. | 131,986 | ||||||
| 5,765 | Banner Corp. | 252,738 | ||||||
| 672 | BayCom Corp. | 13,453 | ||||||
| 11,760 | BCB Bancorp, Inc. | 123,362 | ||||||
| 6,238 | Berkshire Hills Bancorp, Inc. | 134,055 | ||||||
| 29,160 | BGC Group, Inc., Class A | 202,662 | ||||||
| 20,500 | Blackstone Mortgage Trust, Inc., Class A REIT | 417,585 | ||||||
|
Shares |
Description | Value | ||||||
| Common Stocks – (continued) | ||||||||
| Financials – (continued) | ||||||||
| 2,483 | Blue Ridge Bankshares, Inc. | $ | 6,083 | |||||
| 7,813 | Bread Financial Holdings, Inc. | 299,082 | ||||||
| 13,249 | Brightsphere Investment Group, Inc. | 300,222 | ||||||
| 22,740 | Brookline Bancorp, Inc. | 222,170 | ||||||
| 5,376 | Byline Bancorp, Inc. | 112,036 | ||||||
| 31,468 | Cadence Bank | 871,034 | ||||||
| 583 | Cambridge Bancorp | 36,881 | ||||||
| 8,642 | Camden National Corp. | 274,643 | ||||||
| 5,836 | Cannae Holdings, Inc.* | 127,342 | ||||||
| 8,265 | Capital City Bank Group, Inc. | 234,313 | ||||||
| 4,588 | Cass Information Systems, Inc. | 221,692 | ||||||
| 16,858 | Cathay General Bancorp | 658,305 | ||||||
| 11,175 | Central Pacific Financial Corp. | 208,526 | ||||||
| 5,410 | Central Valley Community Bancorp | 101,113 | ||||||
| 3,276 | Chemung Financial Corp. | 139,558 | ||||||
| 21,701 | Chimera Investment Corp. REIT | 94,616 | ||||||
| 3,673 | ChoiceOne Financial Services, Inc.(a) | 97,739 | ||||||
| 6,284 | City Holding Co. | 631,416 | ||||||
| 10,303 | Civista Bancshares, Inc. | 154,751 | ||||||
| 15,319 | Claros Mortgage Trust, Inc. | 148,288 | ||||||
| 7,025 | CNB Financial Corp. | 140,430 | ||||||
| 33,615 | CNO Financial Group, Inc. | 897,184 | ||||||
| 4,240 | Codorus Valley Bancorp, Inc. | 97,605 | ||||||
| 8,895 | Cohen & Steers, Inc. | 654,227 | ||||||
| 1,084 | Colony Bankcorp, Inc. | 12,293 | ||||||
| 6,589 | Columbia Financial, Inc.* | 110,234 | ||||||
| 5,684 | Community Bank System, Inc. | 257,485 | ||||||
| 5,085 | Community Trust Bancorp, Inc. | 202,180 | ||||||
| 294 | Compass Diversified Holdings | 6,762 | ||||||
| 6,688 | ConnectOne Bancorp, Inc. | 132,356 | ||||||
| 8,371 | Consumer Portfolio Services, Inc.* | 73,916 | ||||||
| 16,065 | Customers Bancorp, Inc.* | 872,490 | ||||||
| 18,213 | CVB Financial Corp. | 309,985 | ||||||
| 1,805 | Diamond Hill Investment Group, Inc. | 261,147 | ||||||
| 10,823 | Dime Community Bancshares, Inc. | 202,823 | ||||||
| 11,861 | Donnelley Financial Solutions, Inc.* | 765,746 | ||||||
| 8,546 | Dynex Capital, Inc. REIT | 105,458 | ||||||
| 8,950 | Eagle Bancorp, Inc. | 213,189 | ||||||
| 8,868 | Eastern Bankshares, Inc. | 114,575 | ||||||
| 11,156 | Ellington Financial, Inc. REIT | 126,397 | ||||||
| 8,370 | Employers Holdings, Inc. | 382,593 | ||||||
| 11,724 | Enact Holdings, Inc. | 324,989 | ||||||
| 5,436 | Encore Capital Group, Inc.* | 260,928 | ||||||
| 17,309 | Enova International, Inc.* | 1,094,794 | ||||||
| 1,781 | Enstar Group Ltd.* | 548,441 | ||||||
| 7,022 | Enterprise Financial Services Corp. | 280,318 | ||||||
| 3,670 | Esquire Financial Holdings, Inc. | 186,363 | ||||||
| 23,708 | Essent Group Ltd. | 1,270,038 | ||||||
| 3,535 | Evans Bancorp, Inc. | 104,990 | ||||||
| 15,735 | EVERTEC, Inc. (Puerto Rico) | 568,506 | ||||||
| The accompanying notes are an integral part of these financial statements. | 75 |
GOLDMAN SACHS ACTIVEBETA® U.S. SMALL CAP EQUITY ETF
|
Schedule of Investments (continued)
February 29, 2024 (Unaudited) |
|
Shares |
Description | Value | ||||||
| Common Stocks – (continued) |
| |||||||
| Financials – (continued) |
| |||||||
| 2,232 | Farmers & Merchants Bancorp, Inc. | $ | 45,086 | |||||
| 11,625 | Farmers National Banc Corp. | 156,705 | ||||||
| 9,045 | FB Financial Corp. | 322,364 | ||||||
| 5,942 | Federal Agricultural Mortgage Corp., Class C | 1,062,846 | ||||||
| 2,153 | Fidelity D&D Bancorp, Inc. | 107,521 | ||||||
| 9,989 | Financial Institutions, Inc. | 183,398 | ||||||
| 8,142 | First Bancorp | 277,805 | ||||||
| 5,875 | First Bancorp, Inc. (The) | 138,767 | ||||||
| 47,347 | First BanCorp. (Puerto Rico) | 803,952 | ||||||
| 4,134 | First Bancshares, Inc. (The) | 102,647 | ||||||
| 9,477 | First Busey Corp. | 218,540 | ||||||
| 7,558 | First Business Financial Services, Inc. | 266,646 | ||||||
| 22,136 | First Commonwealth Financial Corp. | 288,432 | ||||||
| 4,785 | First Community Corp/SC | 78,618 | ||||||
| 19,681 | First Financial Bancorp | 427,078 | ||||||
| 23,712 | First Financial Bankshares, Inc. | 733,649 | ||||||
| 4,044 | First Financial Corp. | 150,558 | ||||||
| 10,575 | First Interstate BancSystem, Inc., Class A | 278,334 | ||||||
| 13,598 | First Merchants Corp. | 451,454 | ||||||
| 4,564 | First Mid Bancshares, Inc. | 138,289 | ||||||
| 8,888 | First of Long Island Corp. (The) | 99,012 | ||||||
| 1,205 | First Western Financial, Inc.* | 17,051 | ||||||
| 5,507 | FirstCash Holdings, Inc. | 630,551 | ||||||
| 12,621 | Flushing Financial Corp. | 162,054 | ||||||
| 5,441 | Flywire Corp.* | 154,470 | ||||||
| 12,581 | Franklin BSP Realty Trust, Inc. REIT | 162,421 | ||||||
| 3,044 | FS Bancorp, Inc. | 101,578 | ||||||
| 31,571 | Fulton Financial Corp. | 486,193 | ||||||
| 2,286 | FVCBankcorp, Inc.* | 27,683 | ||||||
| 110,236 | Genworth Financial, Inc., Class A* | 677,951 | ||||||
| 10,190 | German American Bancorp, Inc. | 320,577 | ||||||
| 12,470 | Glacier Bancorp, Inc. | 466,627 | ||||||
| 4,990 | Goosehead Insurance, Inc., Class A* | 377,494 | ||||||
| 6,460 | Great Southern Bancorp, Inc. | 336,824 | ||||||
| 6,228 | Greene County Bancorp, Inc. | 177,872 | ||||||
| 8,400 | Hamilton Lane, Inc., Class A | 964,740 | ||||||
| 14,185 | Hancock Whitney Corp. | 618,466 | ||||||
| 11,519 | Hanmi Financial Corp. | 174,052 | ||||||
| 14,614 | HarborOne Bancorp, Inc. | 148,771 | ||||||
| 8,312 | Heartland Financial USA, Inc. | 282,608 | ||||||
| 17,837 | Heritage Commerce Corp. | 147,869 | ||||||
| 6,156 | Heritage Financial Corp. | 112,963 | ||||||
| 13,488 | Hilltop Holdings, Inc. | 416,509 | ||||||
| 623 | Hingham Institution For Savings (The)(a) | 104,652 | ||||||
| 3,692 | Home Bancorp, Inc. | 135,681 | ||||||
| 29,106 | Home BancShares, Inc. | 682,827 | ||||||
| 5,818 | HomeTrust Bancshares, Inc. | 152,723 | ||||||
| 27,171 | Hope Bancorp, Inc. | 298,066 | ||||||
| 8,235 | Horace Mann Educators Corp. | 298,025 | ||||||
|
Shares |
Description | Value | ||||||
| Common Stocks – (continued) |
| |||||||
| Financials – (continued) |
| |||||||
| 12,683 | Horizon Bancorp, Inc. | $ | 152,703 | |||||
| 1,970 | I3 Verticals, Inc., Class A* | 41,981 | ||||||
| 13,416 | Independent Bank Corp. | 328,021 | ||||||
| 7,244 | Independent Bank Corp. | 377,920 | ||||||
| 5,333 | Independent Bank Group, Inc. | 233,212 | ||||||
| 11,652 | International Bancshares Corp. | 604,622 | ||||||
| 14,250 | International Money Express, Inc.* | 280,725 | ||||||
| 1,143 | Investors Title Co. | 177,645 | ||||||
| 19,392 | Jackson Financial, Inc., Class A | 1,067,530 | ||||||
| 9,052 | KKR Real Estate Finance Trust, Inc. REIT | 88,257 | ||||||
| 18,869 | Ladder Capital Corp. REIT | 203,974 | ||||||
| 11,775 | Lakeland Bancorp, Inc. | 137,532 | ||||||
| 9,011 | Lakeland Financial Corp. | 574,001 | ||||||
| 29,683 | LendingClub Corp.* | 240,729 | ||||||
| 9,596 | Live Oak Bancshares, Inc. | 381,153 | ||||||
| 19,904 | Macatawa Bank Corp. | 195,059 | ||||||
| 5,761 | MainStreet Bancshares, Inc. | 103,784 | ||||||
| 26,160 | Marqeta, Inc., Class A* | 170,825 | ||||||
| 33,081 | MBIA, Inc.* | 216,019 | ||||||
| 7,206 | Mercantile Bank Corp. | 265,469 | ||||||
| 3,523 | Metropolitan Bank Holding Corp.* | 138,137 | ||||||
| 10,097 | MFA Financial, Inc. REIT | 113,288 | ||||||
| 2,995 | Middlefield Banc Corp. | 73,497 | ||||||
| 5,460 | Midland States Bancorp, Inc. | 132,951 | ||||||
| 4,499 | MidWestOne Financial Group, Inc. | 103,117 | ||||||
| 8,659 | Moelis & Co., Class A | 467,932 | ||||||
| 14,935 | Mr Cooper Group, Inc.* | 1,064,567 | ||||||
| 5,443 | National Bank Holdings Corp., Class A | 184,191 | ||||||
| 5,357 | National Bankshares, Inc. | 167,513 | ||||||
| 818 | National Western Life Group, Inc., Class A | 397,204 | ||||||
| 46,526 | Navient Corp. | 756,513 | ||||||
| 8,786 | NBT Bancorp, Inc. | 302,151 | ||||||
| 4,525 | Nelnet, Inc., Class A | 388,562 | ||||||
| 505 | New York Mortgage Trust, Inc. REIT | 3,641 | ||||||
| 3,620 | NewtekOne, Inc.(a) | 41,775 | ||||||
| 7,204 | Nexpoint Real Estate Finance, Inc. REIT | 101,144 | ||||||
| 2,806 | Nicolet Bankshares, Inc. | 221,478 | ||||||
| 21,716 | NMI Holdings, Inc., Class A* | 653,217 | ||||||
| 6,357 | Northeast Bank | 339,400 | ||||||
| 5,949 | Northeast Community Bancorp, Inc. | 92,745 | ||||||
| 16,531 | Northwest Bancshares, Inc. | 189,445 | ||||||
| 4,228 | Norwood Financial Corp. | 116,735 | ||||||
| 6,291 | Oak Valley Bancorp | 156,835 | ||||||
| 8,287 | OceanFirst Financial Corp. | 125,962 | ||||||
| 16,937 | OFG Bancorp (Puerto Rico) | 613,458 | ||||||
| 42,920 | Old National Bancorp | 705,176 | ||||||
| 15,702 | Old Second Bancorp, Inc. | 210,878 | ||||||
| 18,313 | Open Lending Corp.* | 132,952 | ||||||
| 3,170 | Origin Bancorp, Inc. | 94,593 | ||||||
| 76 | The accompanying notes are an integral part of these financial statements. |
GOLDMAN SACHS ACTIVEBETA® U.S. SMALL CAP EQUITY ETF
|
Shares |
Description | Value | ||||||
| Common Stocks – (continued) |
| |||||||
| Financials – (continued) |
| |||||||
| 11,949 | Oscar Health, Inc., Class A* | $ | 194,291 | |||||
| 12,494 | Pacific Premier Bancorp, Inc. | 285,613 | ||||||
| 17,485 | Pagseguro Digital Ltd., Class A (Brazil)* | 243,391 | ||||||
| 3,535 | Palomar Holdings, Inc.* | 269,155 | ||||||
| 3,738 | Park National Corp. | 480,370 | ||||||
| 9,294 | Parke Bancorp, Inc. | 160,322 | ||||||
| 11,494 | Pathward Financial, Inc. | 584,355 | ||||||
| 9,209 | Patria Investments Ltd., Class A (Cayman Islands) | 137,214 | ||||||
| 21,025 | Payoneer Global, Inc.* | 102,181 | ||||||
| 10,197 | PCB Bancorp | 164,682 | ||||||
| 7,357 | Peapack-Gladstone Financial Corp. | 178,260 | ||||||
| 7,636 | PennyMac Financial Services, Inc. | 648,525 | ||||||
| 14,794 | PennyMac Mortgage Investment Trust REIT | 209,039 | ||||||
| 14,023 | Peoples Bancorp, Inc. | 393,626 | ||||||
| 3,848 | Peoples Financial Services Corp. | 155,267 | ||||||
| 2,504 | Piper Sandler Cos. | 471,428 | ||||||
| 6,747 | PJT Partners, Inc., Class A | 711,134 | ||||||
| 2,741 | Plumas Bancorp | 95,496 | ||||||
| 4,881 | PRA Group, Inc.* | 124,758 | ||||||
| 8,043 | Preferred Bank | 577,890 | ||||||
| 7,461 | Premier Financial Corp. | 144,594 | ||||||
| 6,018 | Primis Financial Corp. | 74,322 | ||||||
| 9,330 | ProAssurance Corp. | 115,039 | ||||||
| 15,233 | PROG Holdings, Inc.* | 470,243 | ||||||
| 15,577 | Provident Financial Services, Inc. | 234,901 | ||||||
| 6,448 | QCR Holdings, Inc. | 367,536 | ||||||
| 45,880 | Radian Group, Inc. | 1,336,943 | ||||||
| 36,583 | Ready Capital Corp. REIT | 323,028 | ||||||
| 6,385 | Regional Management Corp. | 149,409 | ||||||
| 10,970 | Remitly Global, Inc.* | 226,201 | ||||||
| 10,083 | Renasant Corp. | 318,724 | ||||||
| 5,948 | Republic Bancorp, Inc., Class A | 292,998 | ||||||
| 7,919 | S&T Bancorp, Inc. | 246,994 | ||||||
| 3,756 | Safety Insurance Group, Inc. | 308,593 | ||||||
| 11,193 | Sandy Spring Bancorp, Inc. | 246,022 | ||||||
| 8,293 | Seacoast Banking Corp. of Florida | 200,193 | ||||||
| 12,170 | Selective Insurance Group, Inc. | 1,271,522 | ||||||
| 12,196 | ServisFirst Bancshares, Inc. | 770,665 | ||||||
| 696 | Shore Bancshares, Inc. | 7,907 | ||||||
| 6,843 | Sierra Bancorp | 127,348 | ||||||
| 16,318 | Simmons First National Corp., Class A | 313,306 | ||||||
| 23,868 | SiriusPoint Ltd. (Bermuda)* | 292,860 | ||||||
| 4,209 | Skyward Specialty Insurance Group, Inc.* | 154,007 | ||||||
| 5,867 | Southern First Bancshares, Inc.* | 193,318 | ||||||
| 6,482 | Southern Missouri Bancorp, Inc. | 277,948 | ||||||
| 6,306 | Southside Bancshares, Inc. | 180,730 | ||||||
| 9,836 | SouthState Corp. | 826,617 | ||||||
| 7,959 | Stellar Bancorp, Inc. | 188,628 | ||||||
| 3,869 | StepStone Group, Inc., Class A | 134,370 | ||||||
|
Shares |
Description | Value | ||||||
| Common Stocks – (continued) | ||||||||
| Financials – (continued) | ||||||||
| 9,092 | Stewart Information Services Corp. | $ | 572,614 | |||||
| 7,039 | Stock Yards Bancorp, Inc. | 322,457 | ||||||
| 36,008 | StoneCo Ltd., Class A (Brazil)* | 619,698 | ||||||
| 9,337 | StoneX Group, Inc.* | 646,681 | ||||||
| 8,196 | Texas Capital Bancshares, Inc.* | 480,695 | ||||||
| 3,507 | Timberland Bancorp, Inc. | 91,883 | ||||||
| 3,549 | Tompkins Financial Corp. | 170,920 | ||||||
| 13,577 | Towne Bank | 368,072 | ||||||
| 8,896 | TriCo Bancshares | 297,215 | ||||||
| 3,781 | Triumph Financial, Inc.* | 283,575 | ||||||
| 5,505 | TrustCo Bank Corp. | 150,231 | ||||||
| 12,550 | Trustmark Corp. | 337,093 | ||||||
| 7,344 | Two Harbors Investment Corp. REIT | 93,048 | ||||||
| 8,542 | UMB Financial Corp. | 697,113 | ||||||
| 17,483 | United Bankshares, Inc. | 606,485 | ||||||
| 15,220 | United Community Banks, Inc. | 395,872 | ||||||
| 6,472 | Unity Bancorp, Inc. | 177,203 | ||||||
| 8,062 | Universal Insurance Holdings, Inc. | 162,772 | ||||||
| 6,548 | Univest Financial Corp. | 131,091 | ||||||
| 4,323 | Upstart Holdings, Inc.*(a) | 111,317 | ||||||
| 68,516 | Valley National Bancorp | 561,146 | ||||||
| 9,644 | Veritex Holdings, Inc. | 189,312 | ||||||
| 4,228 | Victory Capital Holdings, Inc., Class A | 162,482 | ||||||
| 4,413 | Virginia National Bankshares Corp. | 134,243 | ||||||
| 2,421 | Virtus Investment Partners, Inc. | 562,447 | ||||||
| 14,535 | WaFd, Inc. | 395,933 | ||||||
| 4,699 | Walker & Dunlop, Inc. | 448,191 | ||||||
| 6,473 | Washington Trust Bancorp, Inc. | 166,615 | ||||||
| 15,950 | Waterstone Financial, Inc. | 201,768 | ||||||
| 11,397 | WesBanco, Inc. | 330,285 | ||||||
| 12,359 | West BanCorp, Inc. | 215,047 | ||||||
| 7,903 | Westamerica BanCorp | 361,246 | ||||||
| 48,215 | WisdomTree, Inc. | 388,613 | ||||||
| 803 | World Acceptance Corp.* | 96,167 | ||||||
| 12,294 | WSFS Financial Corp. | 521,143 | ||||||
|
|
|
|||||||
| 84,280,716 | ||||||||
|
|
||||||||
| Health Care – 11.4% |
| |||||||
| 3,406 | 4D Molecular Therapeutics, Inc.* | 95,436 | ||||||
| 39,019 | ACADIA Pharmaceuticals, Inc.* | 906,802 | ||||||
| 18,947 | AdaptHealth Corp.* | 193,828 | ||||||
| 3,557 | Addus HomeCare Corp.* | 328,240 | ||||||
| 34,604 | ADMA Biologics, Inc.* | 185,477 | ||||||
| 16,630 | Alignment Healthcare, Inc.* | 99,780 | ||||||
| 50,461 | Alkermes PLC* | 1,498,187 | ||||||
| 17,564 | Alphatec Holdings, Inc.* | 235,885 | ||||||
| 26,680 | Amicus Therapeutics, Inc.* | 342,038 | ||||||
| 13,075 | AMN Healthcare Services, Inc.* | 735,730 | ||||||
| 116,385 | Amneal Pharmaceuticals, Inc.* | 642,445 | ||||||
| 11,228 | Amphastar Pharmaceuticals, Inc.* | 522,888 | ||||||
| 19,466 | Amylyx Pharmaceuticals, Inc.* | 366,934 | ||||||
| 14,926 | AngioDynamics, Inc.* | 81,944 | ||||||
| 5,479 | ANI Pharmaceuticals, Inc.* | 370,764 | ||||||
| The accompanying notes are an integral part of these financial statements. | 77 |
GOLDMAN SACHS ACTIVEBETA® U.S. SMALL CAP EQUITY ETF
|
Schedule of Investments (continued)
February 29, 2024 (Unaudited) |
|
Shares |
Description | Value | ||||||
| Common Stocks – (continued) |
| |||||||
| Health Care – (continued) |
| |||||||
| 12,276 | Anika Therapeutics, Inc.* | $ | 298,061 | |||||
| 4,780 | Arcellx, Inc.* | 314,620 | ||||||
| 12,742 | Arcturus Therapeutics Holdings, Inc.* | 493,880 | ||||||
| 23,933 | Ardelyx, Inc.* | 223,056 | ||||||
| 5,837 | Arrowhead Pharmaceuticals, Inc.* | 187,368 | ||||||
| 82,421 | Assertio Holdings, Inc.* | 72,852 | ||||||
| 4,355 | Astrana Health, Inc.* | 196,149 | ||||||
| 3,387 | Astria Therapeutics, Inc.* | 48,163 | ||||||
| 6,876 | AtriCure, Inc.* | 240,454 | ||||||
| 141 | Atrion Corp. | 51,887 | ||||||
| 14,909 | Aurinia Pharmaceuticals, Inc. (Canada)* | 85,279 | ||||||
| 12,462 | Avanos Medical, Inc.* | 231,419 | ||||||
| 12,956 | Avita Medical, Inc.* | 234,892 | ||||||
| 3,948 | Axonics, Inc.* | 268,227 | ||||||
| 4,756 | Axsome Therapeutics, Inc.* | 387,043 | ||||||
| 25,738 | BioCryst Pharmaceuticals, Inc.* | 144,905 | ||||||
| 4,125 | Biohaven Ltd.* | 198,577 | ||||||
| 3,489 | Blueprint Medicines Corp.* | 326,291 | ||||||
| 5,949 | Bridgebio Pharma, Inc.* | 203,158 | ||||||
| 6,804 | Cabaletta Bio, Inc.* | 155,676 | ||||||
| 41,567 | CareDx, Inc.* | 442,273 | ||||||
| 72,423 | Catalyst Pharmaceuticals, Inc.* | 1,160,941 | ||||||
| 2,250 | Cerevel Therapeutics Holdings, Inc.* | 92,250 | ||||||
| 63,662 | Cerus Corp.* | 138,783 | ||||||
| 8,296 | Codexis, Inc.* | 38,576 | ||||||
| 32,133 | Collegium Pharmaceutical, Inc.* | 1,179,602 | ||||||
| 13,110 | Computer Programs and Systems, Inc.* | 116,155 | ||||||
| 2,438 | CONMED Corp. | 195,820 | ||||||
| 48,398 | Corcept Therapeutics, Inc.* | 1,137,353 | ||||||
| 140 | CorMedix, Inc.* | 496 | ||||||
| 3,143 | CorVel Corp.* | 766,892 | ||||||
| 2,803 | Crinetics Pharmaceuticals, Inc.* | 114,755 | ||||||
| 27,695 | Cross Country Healthcare, Inc.* | 505,988 | ||||||
| 8,825 | CryoPort, Inc.* | 155,938 | ||||||
| 5,970 | CVRx, Inc.* | 117,191 | ||||||
| 10,923 | Cymabay Therapeutics, Inc.* | 351,611 | ||||||
| 3,673 | Cytokinetics, Inc.* | 265,338 | ||||||
| 1,601 | Disc Medicine, Inc.* | 109,941 | ||||||
| 62,900 | Dynavax Technologies Corp.* | 796,943 | ||||||
| 6,377 | Eagle Pharmaceuticals, Inc.* | 37,369 | ||||||
| 16,967 | Embecta Corp. | 242,289 | ||||||
| 10,759 | Emergent BioSolutions, Inc.* | 34,752 | ||||||
| 401 | Enhabit, Inc.* | 3,609 | ||||||
| 1,687 | Enliven Therapeutics, Inc.* | 26,941 | ||||||
| 9,184 | Ensign Group, Inc. (The) | 1,147,265 | ||||||
| 17,786 | Entrada Therapeutics, Inc.* | 235,309 | ||||||
| 8,644 | Evolent Health, Inc., Class A* | 293,118 | ||||||
| 31,583 | Evolus, Inc.* | 468,376 | ||||||
| 10,186 | Fulgent Genetics, Inc.* | 229,796 | ||||||
| 3,478 | Glaukos Corp.* | 308,116 | ||||||
| 5,657 | Haemonetics Corp.* | 412,848 | ||||||
| 17,906 | Halozyme Therapeutics, Inc.* | 712,838 | ||||||
|
Shares |
Description | Value | ||||||
| Common Stocks – (continued) |
| |||||||
| Health Care – (continued) |
| |||||||
| 18,969 | Harmony Biosciences Holdings, Inc.* | $ | 608,905 | |||||
| 36,572 | Harvard Bioscience, Inc.* | 158,357 | ||||||
| 8,750 | HealthEquity, Inc.* | 722,837 | ||||||
| 9,056 | HealthStream, Inc. | 247,048 | ||||||
| 10,508 | Hims & Hers Health, Inc.* | 137,024 | ||||||
| 3,709 | Ideaya Biosciences, Inc.* | 165,792 | ||||||
| 4,443 | Immunovant, Inc.* | 157,149 | ||||||
| 8,119 | Inari Medical, Inc.* | 374,448 | ||||||
| 16,793 | InfuSystem Holdings, Inc.* | 155,335 | ||||||
| 14,161 | Inmode Ltd.* | 311,542 | ||||||
| 46,167 | Innoviva, Inc.* | 705,432 | ||||||
| 8,695 | Insmed, Inc.* | 241,025 | ||||||
| 6,680 | Integer Holdings Corp.* | 736,737 | ||||||
| 3,797 | Intellia Therapeutics, Inc.* | 121,960 | ||||||
| 17,307 | Intra-Cellular Therapies, Inc.* | 1,203,183 | ||||||
| 2,587 | iRadimed Corp. | 108,576 | ||||||
| 6,418 | iRhythm Technologies, Inc.* | 761,496 | ||||||
| 72,888 | Ironwood Pharmaceuticals, Inc.* | 687,334 | ||||||
| 7,144 | iTeos Therapeutics, Inc.* | 76,512 | ||||||
| 10,329 | Joint Corp. (The)* | 101,844 | ||||||
| 90,435 | Karyopharm Therapeutics, Inc.* | 104,905 | ||||||
| 18,725 | Kiniksa Pharmaceuticals Ltd., Class A* | 395,846 | ||||||
| 1,245 | Krystal Biotech, Inc.* | 198,540 | ||||||
| 11,610 | Lantheus Holdings, Inc.* | 759,062 | ||||||
| 7,411 | LeMaitre Vascular, Inc. | 518,770 | ||||||
| 5,772 | Ligand Pharmaceuticals, Inc.* | 458,008 | ||||||
| 6,639 | LivaNova PLC* | 363,884 | ||||||
| 569 | Madrigal Pharmaceuticals, Inc.* | 134,398 | ||||||
| 7,813 | Merit Medical Systems, Inc.* | 595,351 | ||||||
| 1,985 | Mesa Laboratories, Inc. | 216,742 | ||||||
| 88,910 | MiMedx Group, Inc.* | 725,506 | ||||||
| 3,240 | Mirum Pharmaceuticals, Inc.* | 93,020 | ||||||
| 4,165 | Morphic Holding, Inc.* | 153,897 | ||||||
| 130,170 | Multiplan Corp.* | 145,790 | ||||||
| 36,952 | Myriad Genetics, Inc.* | 773,405 | ||||||
| 5,221 | National HealthCare Corp. | 515,104 | ||||||
| 8,023 | National Research Corp. | 323,487 | ||||||
| 17,325 | Neogen Corp.* | 297,817 | ||||||
| 11,590 | NeoGenomics, Inc.* | 180,804 | ||||||
| 6,002 | Nevro Corp.* | 87,389 | ||||||
| 2,065 | Nuvalent, Inc., Class A* | 173,708 | ||||||
| 58,294 | Ocular Therapeutix, Inc.* | 586,438 | ||||||
| 8,085 | Olema Pharmaceuticals, Inc.* | 100,254 | ||||||
| 9,356 | Omega Therapeutics, Inc.*(a) | 38,453 | ||||||
| 23,964 | Omeros Corp.*(a) | 107,838 | ||||||
| 1,368 | OmniAb, Inc. 12.5 Earnout*(b) | — | ||||||
| 1,368 | OmniAb, Inc. 15.00 Earnout*(b) | — | ||||||
| 5,749 | Omnicell, Inc.* | 150,854 | ||||||
| 86,554 | OPKO Health, Inc.*(a) | 86,554 | ||||||
| 22,633 | Option Care Health, Inc.* | 730,367 | ||||||
| 40,078 | OraSure Technologies, Inc.* | 288,361 | ||||||
| 64,341 | Organogenesis Holdings, Inc.* | 229,697 | ||||||
| 16,245 | Orthofix Medical, Inc.* | 212,160 | ||||||
| 22,384 | Ovid therapeutics, Inc.* | 76,106 | ||||||
| 19,883 | Owens & Minor, Inc.* | 483,753 | ||||||
| 78 | The accompanying notes are an integral part of these financial statements. |
GOLDMAN SACHS ACTIVEBETA® U.S. SMALL CAP EQUITY ETF
|
Shares |
Description | Value | ||||||
| Common Stocks – (continued) |
| |||||||
| Health Care – (continued) |
| |||||||
| 14,810 | Pacific Biosciences of California, Inc.*(a) | $ | 81,899 | |||||
| 15,759 | Pacira BioSciences, Inc.* | 468,357 | ||||||
| 20,962 | Patterson Cos., Inc. | 567,861 | ||||||
| 20,656 | Pediatrix Medical Group, Inc.* | 189,002 | ||||||
| 15,553 | PetIQ, Inc.* | 283,220 | ||||||
| 807 | Phathom Pharmaceuticals, Inc.* | 8,635 | ||||||
| 18,751 | Phibro Animal Health Corp., Class A | 242,450 | ||||||
| 9,548 | Phreesia, Inc.* | 236,313 | ||||||
| 24,853 | Poseida Therapeutics, Inc.* | 98,418 | ||||||
| 16,488 | Prestige Consumer Healthcare, Inc.* | 1,147,235 | ||||||
| 4,365 | Privia Health Group, Inc.* | 97,427 | ||||||
| 5,645 | Progyny, Inc.* | 206,155 | ||||||
| 5,620 | Protagonist Therapeutics, Inc.* | 170,736 | ||||||
| 52,508 | Protalix BioTherapeutics, Inc.* | 85,588 | ||||||
| 16,633 | PTC Therapeutics, Inc.* | 468,884 | ||||||
| 1,200 | Pulmonx Corp.*(a) | 11,064 | ||||||
| 3,950 | Quanterix Corp.* | 94,642 | ||||||
| 9,467 | RadNet, Inc.* | 358,421 | ||||||
| 5,145 | REVOLUTION Medicines, Inc.* | 151,675 | ||||||
| 4,848 | Rhythm Pharmaceuticals, Inc.* | 210,500 | ||||||
| 3,484 | RxSight, Inc.* | 190,122 | ||||||
| 3,550 | Sanara Medtech, Inc.* | 135,042 | ||||||
| 22,048 | Sangamo Therapeutics, Inc.* | 25,576 | ||||||
| 29,072 | Savara, Inc.*(a) | 146,814 | ||||||
| 5,118 | Scholar Rock Holding Corp.* | 79,329 | ||||||
| 3,273 | Schrodinger, Inc.* | 83,331 | ||||||
| 25 | scPharmaceuticals, Inc.* | 150 | ||||||
| 14,622 | Select Medical Holdings Corp. | 398,157 | ||||||
| 4,677 | Semler Scientific, Inc.* | 220,614 | ||||||
| 10,361 | SI-BONE, Inc.* | 179,763 | ||||||
| 43,075 | SIGA Technologies, Inc. | 224,421 | ||||||
| 11,525 | Silk Road Medical, Inc.* | 207,335 | ||||||
| 4,918 | SpringWorks Therapeutics, Inc.* | 242,261 | ||||||
| 9,155 | STAAR Surgical Co.* | 286,002 | ||||||
| 33,408 | Supernus Pharmaceuticals, Inc.* | 992,218 | ||||||
| 6,282 | Surgery Partners, Inc.* | 194,930 | ||||||
| 6,414 | Surmodics, Inc.* | 204,607 | ||||||
| 21,865 | Tactile Systems Technology, Inc.* | 333,441 | ||||||
| 6,870 | Taro Pharmaceutical Industries Ltd.* | 289,021 | ||||||
| 5,194 | Tarsus Pharmaceuticals, Inc.* | 198,515 | ||||||
| 10,454 | Tela Bio, Inc.* | 70,669 | ||||||
| 24,918 | TG Therapeutics, Inc.* | 429,088 | ||||||
| 12,667 | Theravance Biopharma, Inc.* | 119,956 | ||||||
| 1,499 | TransMedics Group, Inc.* | 122,318 | ||||||
| 1,617 | UFP Technologies, Inc.* | 336,837 | ||||||
| 18,818 | UroGen Pharma Ltd.*(a) | 344,934 | ||||||
| 2,553 | US Physical Therapy, Inc. | 271,307 | ||||||
| 51,038 | Vanda Pharmaceuticals, Inc.* | 228,140 | ||||||
| 14,292 | Varex Imaging Corp.* | 245,822 | ||||||
| 5,059 | Vaxcyte, Inc.* | 373,455 | ||||||
| 6,933 | Vera Therapeutics, Inc.* | 326,406 | ||||||
| 7,871 | Veracyte, Inc.* | 185,362 | ||||||
| 23,376 | Vericel Corp.* | 1,067,816 | ||||||
|
Shares |
Description | Value | ||||||
| Common Stocks – (continued) |
| |||||||
| Health Care – (continued) |
| |||||||
| 9,886 | Verrica Pharmaceuticals, Inc.*(a) | $ | 52,099 | |||||
| 31,915 | Viemed Healthcare, Inc.* | 270,001 | ||||||
| 7,819 | Vigil Neuroscience, Inc.* | 27,210 | ||||||
| 6,743 | Viking Therapeutics, Inc.* | 519,548 | ||||||
| 1,771 | Vir Biotechnology, Inc.* | 19,906 | ||||||
| 26,129 | Voyager Therapeutics, Inc.* | 217,393 | ||||||
| 6,655 | Xencor, Inc.* | 152,732 | ||||||
| 4,063 | Xeris Biopharma Holdings, Inc.* | 12,494 | ||||||
| 8,483 | Y-mAbs Therapeutics, Inc.* | 141,666 | ||||||
| 11,054 | Zimvie, Inc.* | 187,365 | ||||||
| 18,423 | Zynex, Inc.*(a) | 249,816 | ||||||
|
|
|
|||||||
| 56,679,082 | ||||||||
|
|
||||||||
| Industrials – 20.1% | ||||||||
| 11,731 | AAON, Inc. | 985,169 | ||||||
| 7,161 | AAR Corp.* | 478,212 | ||||||
| 12,314 | ABM Industries, Inc. | 508,691 | ||||||
| 26,804 | ACCO Brands Corp. | 149,566 | ||||||
| 14,456 | ACV Auctions, Inc., Class A* | 256,594 | ||||||
| 2,710 | AeroVironment, Inc.* | 343,601 | ||||||
| 1,114 | AerSale Corp.* | 9,848 | ||||||
| 3,099 | Alamo Group, Inc. | 626,897 | ||||||
| 3,663 | Albany International Corp., Class A | 343,846 | ||||||
| 42,314 | Alight, Inc., Class A* | 381,249 | ||||||
| 10,622 | Allient, Inc. | 301,877 | ||||||
| 4,027 | Alta Equipment Group, Inc. | 46,230 | ||||||
| 4,132 | American Woodmark Corp.* | 414,192 | ||||||
| 27,479 | API Group Corp.* | 963,139 | ||||||
| 11,172 | Apogee Enterprises, Inc. | 639,150 | ||||||
| 11,555 | Applied Industrial Technologies, Inc. | 2,194,179 | ||||||
| 5,652 | ArcBest Corp. | 807,445 | ||||||
| 20,061 | Archer Aviation, Inc., Class A*(a) | 96,895 | ||||||
| 8,441 | Arcosa, Inc. | 700,603 | ||||||
| 3,200 | Argan, Inc. | 149,952 | ||||||
| 10,830 | Array Technologies, Inc.* | 147,721 | ||||||
| 12,094 | ASGN, Inc.* | 1,201,176 | ||||||
| 6,915 | Astec Industries, Inc. | 280,749 | ||||||
| 3,139 | Asure Software, Inc.*(a) | 29,255 | ||||||
| 12,650 | Atkore, Inc. | 2,142,910 | ||||||
| 4,896 | AZZ, Inc. | 356,429 | ||||||
| 3,533 | Babcock & Wilcox Enterprises, Inc.* | 4,522 | ||||||
| 7,021 | Barnes Group, Inc. | 245,314 | ||||||
| 2,565 | Barrett Business Services, Inc. | 312,904 | ||||||
| 12,788 | Beacon Roofing Supply, Inc.* | 1,098,361 | ||||||
| 5,916 | Blue Bird Corp.* | 200,197 | ||||||
| 8,418 | BlueLinx Holdings, Inc.* | 1,067,823 | ||||||
| 14,497 | Boise Cascade Co. | 1,970,287 | ||||||
| 9,669 | Bowman Consulting Group Ltd.* | 314,919 | ||||||
| 5,633 | Brink’s Co. (The) | 466,581 | ||||||
| 5,287 | Casella Waste Systems, Inc., Class A* | 476,359 | ||||||
| 8,876 | CBIZ, Inc.* | 670,404 | ||||||
| 6,775 | CECO Environmental Corp.* | 153,454 | ||||||
| 3,888 | Chart Industries, Inc.* | 555,440 | ||||||
| 9,282 | Cimpress PLC (Ireland)* | 909,729 | ||||||
| 8,227 | Columbus McKinnon Corp. | 343,642 | ||||||
| The accompanying notes are an integral part of these financial statements. | 79 |
GOLDMAN SACHS ACTIVEBETA® U.S. SMALL CAP EQUITY ETF
|
Schedule of Investments (continued)
February 29, 2024 (Unaudited) |
|
Shares |
Description | Value | ||||||
| Common Stocks – (continued) |
| |||||||
| Industrials – (continued) |
| |||||||
| 8,471 | Comfort Systems USA, Inc. | $ | 2,589,839 | |||||
| 13,706 | Commercial Vehicle Group, Inc.* | 89,637 | ||||||
| 85,434 | Conduent, Inc.* | 293,893 | ||||||
| 3,870 | Construction Partners, Inc., Class A* | 186,070 | ||||||
| 34,213 | CoreCivic, Inc.* | 521,064 | ||||||
| 14,224 | Costamare, Inc. (Monaco) | 161,727 | ||||||
| 3,837 | Covenant Logistics Group, Inc. | 186,785 | ||||||
| 3,850 | CRA International, Inc. | 510,279 | ||||||
| 11,964 | CSG Systems International, Inc. | 652,756 | ||||||
| 4,298 | CSW Industrials, Inc. | 990,216 | ||||||
| 16,397 | Deluxe Corp. | 318,266 | ||||||
| 8,470 | Distribution Solutions Group, Inc.* | 266,043 | ||||||
| 65,371 | DNOW, Inc.* | 925,000 | ||||||
| 3,233 | Douglas Dynamics, Inc. | 81,148 | ||||||
| 2,481 | Ducommun, Inc.* | 118,393 | ||||||
| 13,871 | DXP Enterprises, Inc.* | 492,698 | ||||||
| 3,992 | Dycom Industries, Inc.* | 504,948 | ||||||
| 3,925 | Eagle Bulk Shipping, Inc. | 240,485 | ||||||
| 7,036 | Encore Wire Corp. | 1,695,676 | ||||||
| 22,448 | Energy Recovery, Inc.* | 350,862 | ||||||
| 14,841 | Enerpac Tool Group Corp. | 500,290 | ||||||
| 6,852 | EnerSys | 629,562 | ||||||
| 7,081 | Ennis, Inc. | 143,886 | ||||||
| 11,216 | Enovix Corp.*(a) | 109,356 | ||||||
| 4,259 | Enpro, Inc. | 663,637 | ||||||
| 3,438 | ESCO Technologies, Inc. | 350,298 | ||||||
| 4,080 | EVI Industries, Inc. | 87,842 | ||||||
| 31,216 | ExlService Holdings, Inc.* | 971,442 | ||||||
| 4,451 | Exponent, Inc. | 360,041 | ||||||
| 8,669 | Federal Signal Corp. | 710,078 | ||||||
| 10,011 | First Advantage Corp. | 156,772 | ||||||
| 5,214 | Fluence Energy, Inc.*(a) | 79,722 | ||||||
| 19,151 | Fluor Corp.* | 704,757 | ||||||
| 7,386 | Forrester Research, Inc.* | 148,976 | ||||||
| 10,319 | Forward Air Corp. | 383,144 | ||||||
| 11,499 | Franklin Covey Co.* | 439,032 | ||||||
| 11,694 | Franklin Electric Co., Inc. | 1,215,708 | ||||||
| 10,585 | FTAI Aviation Ltd. | 595,830 | ||||||
| 3,485 | GATX Corp. | 442,037 | ||||||
| 12,117 | Genco Shipping & Trading Ltd. | 247,187 | ||||||
| 7,491 | Gencor Industries, Inc.* | 122,777 | ||||||
| 49,448 | GEO Group, Inc. (The)* | 606,727 | ||||||
| 5,733 | Gibraltar Industries, Inc.* | 444,021 | ||||||
| 12,202 | Global Industrial Co. | 535,058 | ||||||
| 20,896 | GMS, Inc.* | 1,866,222 | ||||||
| 3,789 | Gorman-Rupp Co. (The) | 141,443 | ||||||
| 63,080 | GrafTech International Ltd. | 111,021 | ||||||
| 4,618 | Granite Construction, Inc. | 237,966 | ||||||
| 3,326 | Greenbrier Cos., Inc. (The) | 172,121 | ||||||
| 12,941 | Griffon Corp. | 923,987 | ||||||
| 6,983 | H&E Equipment Services, Inc. | 394,470 | ||||||
| 7,161 | Heartland Express, Inc. | 91,518 | ||||||
| 5,158 | Heidrick & Struggles International, Inc. | 175,372 | ||||||
| 3,275 | Helios Technologies, Inc. | 144,591 | ||||||
| 3,553 | Herc Holdings, Inc. | 563,790 | ||||||
|
Shares |
Description | Value | ||||||
| Common Stocks – (continued) |
| |||||||
| Industrials – (continued) |
| |||||||
| 10,114 | Hillenbrand, Inc. | $ | 480,921 | |||||
| 16,887 | Hillman Solutions Corp.* | 164,479 | ||||||
| 2,918 | HireQuest, Inc.(a) | 39,101 | ||||||
| 21,139 | HNI Corp. | 947,239 | ||||||
| 18,777 | Hub Group, Inc., Class A* | 798,586 | ||||||
| 38,173 | Hudson Technologies, Inc.* | 559,234 | ||||||
| 5,898 | Huron Consulting Group, Inc.* | 578,771 | ||||||
| 77 | Hyster-Yale Materials Handling, Inc. | 4,534 | ||||||
| 5,155 | ICF International, Inc. | 798,252 | ||||||
| 7,881 | IES Holdings, Inc.* | 866,280 | ||||||
| 22,427 | Innodata, Inc.*(a) | 165,960 | ||||||
| 8,898 | Insperity, Inc. | 905,727 | ||||||
| 6,678 | Insteel Industries, Inc. | 243,146 | ||||||
| 23,072 | Interface, Inc. | 362,692 | ||||||
| 23,283 | Janus International Group, Inc.* | 334,111 | ||||||
| 20,782 | JELD-WEN Holding, Inc.* | 378,232 | ||||||
| 33,770 | Joby Aviation, Inc.*(a) | 189,787 | ||||||
| 5,026 | John Bean Technologies Corp. | 510,038 | ||||||
| 3,859 | Kadant, Inc. | 1,301,641 | ||||||
| 5,125 | Kaman Corp. | 234,776 | ||||||
| 16,545 | Kelly Services, Inc., Class A | 405,849 | ||||||
| 10,300 | Kennametal, Inc. | 259,972 | ||||||
| 14,051 | Kforce, Inc. | 978,512 | ||||||
| 10,376 | Korn Ferry | 660,536 | ||||||
| 9,889 | Kratos Defense & Security Solutions, Inc.* | 180,375 | ||||||
| 34,472 | Legalzoom.com, Inc.* | 427,453 | ||||||
| 18,976 | Leonardo DRS, Inc.* | 430,945 | ||||||
| 3,706 | Limbach Holdings, Inc.* | 182,483 | ||||||
| 1,967 | Lindsay Corp. | 234,683 | ||||||
| 24,662 | LSI Industries, Inc. | 355,873 | ||||||
| 11,266 | Manitowoc Co., Inc. (The)* | 157,048 | ||||||
| 7,452 | Marten Transport Ltd. | 140,470 | ||||||
| 4,842 | Masonite International Corp.* | 630,622 | ||||||
| 12,051 | Masterbrand, Inc.* | 208,603 | ||||||
| 9,703 | Matson, Inc. | 1,077,518 | ||||||
| 6,814 | Matthews International Corp., Class A | 197,197 | ||||||
| 11,468 | Maximus, Inc. | 959,413 | ||||||
| 4,294 | Mayville Engineering Co., Inc.* | 52,559 | ||||||
| 2,541 | McGrath RentCorp | 316,304 | ||||||
| 2,697 | Miller Industries, Inc. | 121,392 | ||||||
| 14,793 | MillerKnoll, Inc. | 451,926 | ||||||
| 17,923 | Mistras Group, Inc.* | 155,034 | ||||||
| 5,707 | Moog, Inc., Class A | 855,765 | ||||||
| 32,308 | MRC Global, Inc.* | 372,511 | ||||||
| 34,666 | Mueller Industries, Inc. | 1,781,139 | ||||||
| 21,069 | Mueller Water Products, Inc., Class A | 327,623 | ||||||
| 4,727 | MYR Group, Inc.* | 767,948 | ||||||
| 1,319 | National Presto Industries, Inc. | 101,998 | ||||||
| 4,452 | NEXTracker, Inc., Class A* | 250,380 | ||||||
| 5,309 | Northwest Pipe Co.* | 158,367 | ||||||
| 3,836 | NV5 Global, Inc.* | 390,160 | ||||||
| 2,853 | Omega Flex, Inc. | 198,711 | ||||||
| 12,084 | OPENLANE, Inc.* | 184,523 | ||||||
| 80 | The accompanying notes are an integral part of these financial statements. |
GOLDMAN SACHS ACTIVEBETA® U.S. SMALL CAP EQUITY ETF
|
Shares |
Description | Value | ||||||
| Common Stocks – (continued) |
| |||||||
| Industrials – (continued) |
| |||||||
| 3,444 | PAM Transportation Services, Inc.* | $ | 63,783 | |||||
| 8,517 | Pangaea Logistics Solutions Ltd. | 71,372 | ||||||
| 9,878 | Parsons Corp.* | 796,266 | ||||||
| 20,768 | PGT Innovations, Inc.* | 867,479 | ||||||
| 4,809 | Powell Industries, Inc. | 890,819 | ||||||
| 2,317 | Preformed Line Products Co. | 318,541 | ||||||
| 12,269 | Primoris Services Corp. | 484,748 | ||||||
| 6,396 | Proto Labs, Inc.* | 233,006 | ||||||
| 15,041 | Quanex Building Products Corp. | 520,118 | ||||||
| 34,531 | Radiant Logistics, Inc.* | 200,280 | ||||||
| 26,663 | Resideo Technologies, Inc.* | 595,385 | ||||||
| 29,201 | Resources Connection, Inc. | 403,850 | ||||||
| 15,722 | REV Group, Inc. | 324,502 | ||||||
| 26,321 | Rocket Lab USA, Inc.*(a) | 120,682 | ||||||
| 20,488 | Rush Enterprises, Inc., Class A | 997,766 | ||||||
| 9,001 | Rush Enterprises, Inc., Class B | 453,920 | ||||||
| 34,409 | RXO, Inc.* | 740,482 | ||||||
| 44,173 | Safe Bulkers, Inc. (Greece) | 204,963 | ||||||
| 7,503 | Shoals Technologies Group, Inc., Class A* | 96,263 | ||||||
| 18,960 | Shyft Group, Inc. (The) | 195,478 | ||||||
| 10,481 | Simpson Manufacturing Co., Inc. | 2,187,175 | ||||||
| 6,244 | SkyWest, Inc.* | 400,990 | ||||||
| 7,404 | SP Plus Corp.* | 380,640 | ||||||
| 6,200 | Spirit Airlines, Inc. | 39,990 | ||||||
| 6,529 | SPX Technologies, Inc.* | 765,134 | ||||||
| 2,372 | Standex International Corp. | 410,356 | ||||||
| 32,777 | Steelcase, Inc., Class A | 450,356 | ||||||
| 8,014 | Sterling Infrastructure, Inc.* | 854,613 | ||||||
| 7,761 | Tennant Co. | 878,468 | ||||||
| 13,101 | Terex Corp. | 751,342 | ||||||
| 10,589 | Textainer Group Holdings Ltd. (China) | 528,391 | ||||||
| 7,033 | Thermon Group Holdings, Inc.* | 191,931 | ||||||
| 14,630 | Titan International, Inc.* | 186,679 | ||||||
| 14,346 | Titan Machinery, Inc.* | 361,950 | ||||||
| 6,012 | Transcat, Inc.* | 632,222 | ||||||
| 6,260 | TriNet Group, Inc.* | 801,343 | ||||||
| 5,901 | Trinity Industries, Inc. | 149,767 | ||||||
| 7,982 | Triumph Group, Inc.* | 110,950 | ||||||
| 28,320 | TrueBlue, Inc.* | 332,760 | ||||||
| 4,826 | TTEC Holdings, Inc. | 84,214 | ||||||
| 16,465 | Tutor Perini Corp.* | 186,548 | ||||||
| 16,307 | UFP Industries, Inc. | 1,869,271 | ||||||
| 2,827 | UniFirst Corp. | 476,971 | ||||||
| 22,558 | Upwork, Inc.* | 295,510 | ||||||
| 6,797 | V2X, Inc.* | 261,685 | ||||||
| 20,884 | Verra Mobility Corp.* | 451,512 | ||||||
| 7,021 | Vicor Corp.* | 261,462 | ||||||
| 16,101 | Wabash National Corp. | 439,235 | ||||||
| 7,612 | Watts Water Technologies, Inc., Class A | 1,552,467 | ||||||
| 7,851 | Werner Enterprises, Inc. | 315,139 | ||||||
| 7,951 | Willdan Group, Inc.* | 166,017 | ||||||
| 11,497 | Zurn Elkay Water Solutions Corp. | 365,030 | ||||||
|
|
|
|||||||
| 99,549,197 | ||||||||
|
|
||||||||
|
Shares |
Description | Value | ||||||
| Common Stocks – (continued) |
| |||||||
| Information Technology – 13.8% |
| |||||||
| 107,228 | 8x8, Inc.* | $ | 303,455 | |||||
| 44,981 | A10 Networks, Inc. | 598,697 | ||||||
| 19,100 | ACI Worldwide, Inc.* | 628,581 | ||||||
| 5,359 | ACM Research, Inc., Class A* | 165,700 | ||||||
| 33,537 | Adeia, Inc. | 380,310 | ||||||
| 6,871 | Advanced Energy Industries, Inc. | 695,345 | ||||||
| 6,455 | Aehr Test Systems* | 105,023 | ||||||
| 8,575 | Agilysys, Inc.* | 667,135 | ||||||
| 9,895 | Alarm.com Holdings, Inc.* | 748,953 | ||||||
| 4,076 | Alkami Technology, Inc.* | 101,696 | ||||||
| 9,924 | Alpha & Omega Semiconductor Ltd.* | 217,336 | ||||||
| 9,777 | Altair Engineering, Inc., Class A* | 831,827 | ||||||
| 4,063 | Ambarella, Inc.* | 226,919 | ||||||
| 11,604 | American Software, Inc., Class A | 130,197 | ||||||
| 30,496 | Amkor Technology, Inc. | 945,986 | ||||||
| 5,135 | Appfolio, Inc., Class A* | 1,243,132 | ||||||
| 9,807 | Appian Corp., Class A* | 341,774 | ||||||
| 18,639 | Applied Digital Corp.*(a) | 77,352 | ||||||
| 33,792 | Arlo Technologies, Inc.* | 351,775 | ||||||
| 14,709 | Asana, Inc., Class A* | 289,767 | ||||||
| 43,942 | Aurora Innovation, Inc.* | 111,613 | ||||||
| 8,706 | Axcelis Technologies, Inc.* | 980,905 | ||||||
| 7,200 | Badger Meter, Inc. | 1,142,568 | ||||||
| 5,647 | Bel Fuse, Inc., Class B | 293,475 | ||||||
| 7,364 | Belden, Inc. | 627,266 | ||||||
| 10,977 | Benchmark Electronics, Inc. | 337,104 | ||||||
| 15,340 | BigCommerce Holdings, Inc., Series 1* | 118,885 | ||||||
| 42,997 | Bit Digital, Inc. (China)*(a) | 111,792 | ||||||
| 7,824 | Blackbaud, Inc.* | 541,264 | ||||||
| 2,299 | BlackLine, Inc.* | 130,422 | ||||||
| 31,480 | Box, Inc., Class A* | 811,869 | ||||||
| 4,414 | Braze, Inc., Class A* | 251,157 | ||||||
| 36,372 | Brightcove, Inc.* | 80,564 | ||||||
| 4,618 | C3.ai, Inc., Class A*(a) | 170,727 | ||||||
| 13,865 | Calix, Inc.* | 483,473 | ||||||
| 1,979 | Cambium Networks Corp.* | 8,411 | ||||||
| 5,715 | Cerence, Inc.* | 85,153 | ||||||
| 5,473 | CEVA, Inc.* | 123,909 | ||||||
| 10,508 | Cleanspark, Inc.* | 175,694 | ||||||
| 6,225 | Clearfield, Inc.*(a) | 187,808 | ||||||
| 2,836 | Climb Global Solutions, Inc. | 192,763 | ||||||
| 13,180 | Cohu, Inc.* | 423,473 | ||||||
| 12,914 | CommVault Systems, Inc.* | 1,235,999 | ||||||
| 7,115 | Consensus Cloud Solutions, Inc.* | 113,271 | ||||||
| 5,313 | CoreCard Corp.* | 67,794 | ||||||
| 6,538 | Corsair Gaming, Inc.* | 84,667 | ||||||
| 9,911 | Couchbase, Inc.* | 278,301 | ||||||
| 3,081 | CPI Card Group, Inc.* | 58,231 | ||||||
| 7,850 | Credo Technology Group Holding Ltd.* | 169,089 | ||||||
| 6,552 | CTS Corp. | 291,957 | ||||||
| 19,218 | Daktronics, Inc.* | 166,812 | ||||||
| 11,385 | Digi International, Inc.* | 336,541 | ||||||
| 27,059 | Digital Turbine, Inc.* | 85,777 | ||||||
| 2,945 | DigitalOcean Holdings, Inc.* | 111,674 | ||||||
| The accompanying notes are an integral part of these financial statements. | 81 |
GOLDMAN SACHS ACTIVEBETA® U.S. SMALL CAP EQUITY ETF
|
Schedule of Investments (continued)
February 29, 2024 (Unaudited) |
|
Shares |
Description | Value | ||||||
| Common Stocks – (continued) |
| |||||||
| Information Technology – (continued) |
| |||||||
| 13,269 | Diodes, Inc.* | $ | 902,027 | |||||
| 25,868 | Domo, Inc., Class B* | 297,741 | ||||||
| 18,351 | eGain Corp.* | 112,492 | ||||||
| 6,023 | Envestnet, Inc.* | 310,365 | ||||||
| 8,403 | ePlus, Inc.* | 692,323 | ||||||
| 5,193 | Everbridge, Inc.* | 146,806 | ||||||
| 50,970 | Extreme Networks, Inc.* | 644,261 | ||||||
| 5,100 | Fabrinet (Thailand)* | 1,099,407 | ||||||
| 8,019 | Fastly, Inc., Class A* | 114,030 | ||||||
| 16,097 | FormFactor, Inc.* | 692,654 | ||||||
| 14,254 | Freshworks, Inc., Class A* | 291,352 | ||||||
| 15,310 | Grid Dynamics Holdings, Inc.* | 206,532 | ||||||
| 21,650 | Hackett Group, Inc. (The) | 535,188 | ||||||
| 29,307 | Harmonic, Inc.* | 384,801 | ||||||
| 7,679 | Ichor Holdings Ltd.* | 328,661 | ||||||
| 3,527 | Immersion Corp. | 23,807 | ||||||
| 6,426 | Impinj, Inc.* | 701,848 | ||||||
| 46,197 | Infinera Corp.* | 231,909 | ||||||
| 32,673 | Information Services Group, Inc. | 141,474 | ||||||
| 8,281 | Insight Enterprises, Inc.* | 1,556,828 | ||||||
| 3,160 | Intapp, Inc.* | 123,967 | ||||||
| 4,926 | InterDigital, Inc. | 527,181 | ||||||
| 10,034 | inTEST Corp.* | 117,197 | ||||||
| 9,205 | IonQ, Inc.*(a) | 95,364 | ||||||
| 4,773 | Itron, Inc.* | 442,362 | ||||||
| 9,644 | Kimball Electronics, Inc.* | 217,086 | ||||||
| 22,891 | Knowles Corp.* | 374,039 | ||||||
| 13,152 | Kulicke & Soffa Industries, Inc. (Singapore) | 626,298 | ||||||
| 11,681 | LiveRamp Holdings, Inc.* | 408,601 | ||||||
| 22,318 | Luna Innovations, Inc.* | 151,316 | ||||||
| 6,271 | MACOM Technology Solutions Holdings, Inc.* | 553,917 | ||||||
| 8,942 | Marathon Digital Holdings, Inc.* | 231,598 | ||||||
| 28,061 | MaxLinear, Inc.* | 545,506 | ||||||
| 9,411 | Methode Electronics, Inc. | 200,454 | ||||||
| 618 | MicroStrategy, Inc., Class A* | 632,115 | ||||||
| 19,900 | Mitek Systems, Inc.* | 231,039 | ||||||
| 7,610 | Model N, Inc.* | 186,902 | ||||||
| 9,526 | N-able, Inc.* | 128,315 | ||||||
| 19,698 | Napco Security Technologies, Inc. | 887,001 | ||||||
| 15,103 | Navitas Semiconductor Corp.* | 92,732 | ||||||
| 9,328 | NETGEAR, Inc.* | 139,827 | ||||||
| 17,794 | NetScout Systems, Inc.* | 385,240 | ||||||
| 5,785 | Novanta, Inc.* | 1,000,458 | ||||||
| 3,042 | NVE Corp. | 254,281 | ||||||
| 14,168 | OneSpan, Inc.* | 136,154 | ||||||
| 9,125 | Onto Innovation, Inc.* | 1,680,460 | ||||||
| 3,822 | OSI Systems, Inc.* | 501,370 | ||||||
| 6,429 | PagerDuty, Inc.* | 155,325 | ||||||
| 2,361 | PAR Technology Corp.* | 103,459 | ||||||
| 10,622 | PC Connection, Inc. | 705,088 | ||||||
| 10,267 | PDF Solutions, Inc.* | 348,975 | ||||||
| 8,557 | Perficient, Inc.* | 555,093 | ||||||
| 26,618 | Photronics, Inc.* | 766,332 | ||||||
| 5,628 | Plexus Corp.* | 531,283 | ||||||
| 10,801 | Power Integrations, Inc. | 771,839 | ||||||
|
Shares |
Description | Value | ||||||
| Common Stocks – (continued) |
| |||||||
| Information Technology – (continued) |
| |||||||
| 4,653 | PowerSchool Holdings, Inc., Class A* | $ | 97,201 | |||||
| 12,428 | Progress Software Corp. | 663,158 | ||||||
| 6,746 | PROS Holdings, Inc.* | 241,169 | ||||||
| 4,056 | Q2 Holdings, Inc.* | 187,509 | ||||||
| 6,837 | Qualys, Inc.* | 1,175,007 | ||||||
| 54,400 | Rackspace Technology, Inc.* | 114,784 | ||||||
| 24,031 | Rambus, Inc.* | 1,423,596 | ||||||
| 8,104 | Rapid7, Inc.* | 474,732 | ||||||
| 1,983 | Red Violet, Inc.* | 35,416 | ||||||
| 42,764 | Ribbon Communications, Inc.* | 127,864 | ||||||
| 3,813 | Richardson Electronics Ltd. | 33,516 | ||||||
| 13,064 | Riot Platforms, Inc.* | 184,464 | ||||||
| 1,430 | Rogers Corp.* | 160,260 | ||||||
| 10,876 | Sanmina Corp.* | 687,363 | ||||||
| 8,871 | Sapiens International Corp. NV (Israel) | 272,961 | ||||||
| 8,806 | ScanSource, Inc.* | 380,683 | ||||||
| 20,378 | SEMrush Holdings, Inc., Class A* | 254,317 | ||||||
| 4,418 | Silicon Laboratories, Inc.* | 607,652 | ||||||
| 812 | SiTime Corp.* | 75,110 | ||||||
| 17,471 | SMART Global Holdings, Inc.* | 371,608 | ||||||
| 18,189 | SolarWinds Corp.* | 217,177 | ||||||
| 5,067 | SoundThinking, Inc.* | 88,115 | ||||||
| 20,907 | Sprinklr, Inc., Class A* | 272,418 | ||||||
| 7,246 | Sprout Social, Inc., Class A* | 447,948 | ||||||
| 7,975 | SPS Commerce, Inc.* | 1,476,651 | ||||||
| 11,675 | Squarespace, Inc., Class A* | 388,544 | ||||||
| 7,610 | Super Micro Computer, Inc.* | 6,591,173 | ||||||
| 8,805 | Synaptics, Inc.* | 881,381 | ||||||
| 15,078 | Tenable Holdings, Inc.* | 726,156 | ||||||
| 65,124 | Terawulf, Inc.*(a) | 122,108 | ||||||
| 31,239 | Thoughtworks Holding, Inc.* | 97,466 | ||||||
| 30,225 | TTM Technologies, Inc.* | 448,841 | ||||||
| 4,874 | Turtle Beach Corp.* | 52,054 | ||||||
| 11,827 | Ultra Clean Holdings, Inc.* | 510,926 | ||||||
| 30,529 | Unisys Corp.* | 158,446 | ||||||
| 14,637 | Varonis Systems, Inc.* | 743,560 | ||||||
| 10,450 | Veeco Instruments, Inc.* | 378,395 | ||||||
| 12,958 | Verint Systems, Inc.* | 409,602 | ||||||
| 37,677 | Viavi Solutions, Inc.* | 359,815 | ||||||
| 27,471 | Vishay Intertechnology, Inc. | 597,494 | ||||||
| 7,688 | Vishay Precision Group, Inc.* | 265,620 | ||||||
| 10,861 | Weave Communications, Inc.* | 136,088 | ||||||
| 7,701 | Workiva, Inc.* | 663,210 | ||||||
| 24,181 | Xerox Holdings Corp. | 450,976 | ||||||
| 12,186 | Xperi, Inc.* | 133,559 | ||||||
| 44,850 | Yext, Inc.* | 265,512 | ||||||
| 34,520 | Zeta Global Holdings Corp., Class A* | 362,460 | ||||||
| 23,203 | Zuora, Inc., Class A* | 187,480 | ||||||
|
|
|
|||||||
| 68,665,593 | ||||||||
|
|
||||||||
| Materials – 4.6% | ||||||||
| 8,822 | AdvanSix, Inc. | 246,840 | ||||||
| 5,672 | Alpha Metallurgical Resources, Inc. | 2,139,762 | ||||||
| 18,517 | American Vanguard Corp. | 198,502 | ||||||
| 82 | The accompanying notes are an integral part of these financial statements. |
GOLDMAN SACHS ACTIVEBETA® U.S. SMALL CAP EQUITY ETF
|
Shares |
Description | Value | ||||||
| Common Stocks – (continued) |
| |||||||
| Materials – (continued) |
| |||||||
| 30,963 | Arcadium Lithium PLC (Jersey)* | $ | 169,987 | |||||
| 6,394 | Arch Resources, Inc. | 1,056,864 | ||||||
| 10,488 | ATI, Inc.* | 515,800 | ||||||
| 15,503 | Avient Corp. | 627,561 | ||||||
| 3,485 | Balchem Corp. | 547,807 | ||||||
| 9,488 | Cabot Corp. | 806,006 | ||||||
| 6,746 | Carpenter Technology Corp. | 436,129 | ||||||
| 5,837 | Clearwater Paper Corp.* | 229,336 | ||||||
| 27,364 | Commercial Metals Co. | 1,477,656 | ||||||
| 18,112 | Constellium SE* | 351,192 | ||||||
| 7,241 | Core Molding Technologies, Inc.* | 133,017 | ||||||
| 21,162 | Ecovyst, Inc.* | 204,213 | ||||||
| 5,498 | Greif, Inc., Class A | 354,401 | ||||||
| 5,035 | Hawkins, Inc. | 353,709 | ||||||
| 515 | Haynes International, Inc. | 30,606 | ||||||
| 8,712 | HB Fuller Co. | 692,865 | ||||||
| 37,470 | Hecla Mining Co. | 132,644 | ||||||
| 7,080 | Ingevity Corp.* | 323,414 | ||||||
| 7,513 | Innospec, Inc. | 933,641 | ||||||
| 1,585 | Kaiser Aluminum Corp. | 114,944 | ||||||
| 3,595 | Knife River Corp.* | 266,354 | ||||||
| 4,873 | Koppers Holdings, Inc. | 275,909 | ||||||
| 12,336 | LSB Industries, Inc.* | 90,793 | ||||||
| 4,193 | Materion Corp. | 563,204 | ||||||
| 9,312 | Mativ Holdings, Inc. | 161,749 | ||||||
| 20,256 | Metallus, Inc.* | 440,568 | ||||||
| 6,216 | Minerals Technologies, Inc. | 449,790 | ||||||
| 32,230 | Myers Industries, Inc. | 619,783 | ||||||
| 22,417 | O-I Glass, Inc.* | 379,296 | ||||||
| 8,980 | Olympic Steel, Inc. | 610,820 | ||||||
| 24,127 | Orion SA (Germany) | 543,823 | ||||||
| 12,829 | Pactiv Evergreen, Inc. | 189,228 | ||||||
| 1,417 | Quaker Chemical Corp. | 284,108 | ||||||
| 12,097 | Radius Recycling, Inc., Class A | 239,037 | ||||||
| 16,531 | Ramaco Resources, Inc., Class A | 290,615 | ||||||
| 2,328 | Ramaco Resources, Inc., Class B | 27,936 | ||||||
| 36,297 | Rayonier Advanced Materials, Inc.* | 123,047 | ||||||
| 20,035 | Ryerson Holding Corp. | 632,705 | ||||||
| 8,113 | Sensient Technologies Corp. | 542,597 | ||||||
| 1,744 | Stepan Co. | 155,565 | ||||||
| 15,448 | Summit Materials, Inc., Class A* | 659,784 | ||||||
| 38,427 | SunCoke Energy, Inc. | 411,553 | ||||||
| 4,335 | Sylvamo Corp. | 261,877 | ||||||
| 9,326 | TriMas Corp. | 219,161 | ||||||
| 2,643 | Trinseo PLC | 11,893 | ||||||
| 16,960 | Tronox Holdings PLC | 249,312 | ||||||
| 1,921 | United States Lime & Minerals, Inc. | 489,817 | ||||||
| 21,399 | Warrior Met Coal, Inc. | 1,219,101 | ||||||
| 6,776 | Worthington Steel, Inc.* | 214,528 | ||||||
|
|
|
|||||||
| 22,700,849 | ||||||||
|
|
||||||||
| Real Estate – 5.4% |
| |||||||
| 18,334 | Acadia Realty Trust REIT | 300,494 | ||||||
| 27,339 | Alexander & Baldwin, Inc. REIT | 444,532 | ||||||
| 531 | Alexander’s, Inc. REIT | 117,378 | ||||||
|
Shares |
Description | Value | ||||||
| Common Stocks – (continued) | ||||||||
| Real Estate – (continued) | ||||||||
| 5,559 | Alpine, Inc.ome Property Trust, Inc. REIT | $ | 86,776 | |||||
| 10,445 | American Assets Trust, Inc. REIT | 225,299 | ||||||
| 33,686 | Anywhere Real Estate, Inc.* | 211,211 | ||||||
| 44,605 | Apartment Investment and Management Co., Class A REIT* | 329,185 | ||||||
| 42,503 | Apple Hospitality REIT, Inc. REIT | 683,873 | ||||||
| 10,643 | Armada Hoffler Properties, Inc. REIT | 108,346 | ||||||
| 15,323 | Braemar Hotels & Resorts, Inc. REIT | 34,937 | ||||||
| 27,125 | Brandywine Realty Trust REIT | 116,638 | ||||||
| 24,764 | Broadstone Net Lease, Inc. REIT | 369,231 | ||||||
| 8,757 | BRT Apartments Corp. REIT | 135,558 | ||||||
| 18,938 | CareTrust REIT, Inc. REIT | 427,241 | ||||||
| 8,066 | CBL & Associates Properties, Inc. REIT | 186,002 | ||||||
| 2,552 | Centerspace REIT | 141,866 | ||||||
| 16,126 | Chatham Lodging Trust REIT | 164,485 | ||||||
| 22,539 | City Office REIT, Inc. REIT | 103,229 | ||||||
| 5,923 | Community Healthcare Trust, Inc. REIT | 160,750 | ||||||
| 150,023 | Compass, Inc., Class A* | 592,591 | ||||||
| 19,519 | COPT Defense Properties REIT | 472,945 | ||||||
| 10,960 | CTO Realty Growth, Inc. REIT | 186,868 | ||||||
| 37,384 | Cushman & Wakefield PLC* | 373,466 | ||||||
| 42,628 | DiamondRock Hospitality Co. REIT | 400,703 | ||||||
| 9,245 | DigitalBridge Group, Inc. | 169,831 | ||||||
| 70,379 | Douglas Elliman, Inc. | 129,497 | ||||||
| 24,201 | Douglas Emmett, Inc. REIT | 319,937 | ||||||
| 13,884 | Easterly Government Properties, Inc. REIT | 163,831 | ||||||
| 10,254 | Elme Communities REIT | 132,072 | ||||||
| 39,928 | Empire State Realty Trust, Inc., Class A REIT | 398,082 | ||||||
| 12,883 | Equity Commonwealth REIT* | 242,587 | ||||||
| 19,197 | Essential Properties Realty Trust, Inc. REIT | 458,616 | ||||||
| 48,659 | eXp World Holdings, Inc.(a) | 637,433 | ||||||
| 11,055 | Farmland Partners, Inc. REIT | 130,449 | ||||||
| 11,239 | Forestar Group, Inc.* | 378,979 | ||||||
| 15,511 | Four Corners Property Trust, Inc. REIT | 375,056 | ||||||
| 3,691 | FRP Holdings, Inc.* | 222,198 | ||||||
| 8,387 | Getty Realty Corp. REIT | 221,081 | ||||||
| 11,225 | Gladstone Commercial Corp. REIT | 138,966 | ||||||
| 3,783 | Gladstone Land Corp. REIT | 49,217 | ||||||
| 9,426 | Global Medical REIT, Inc. REIT | 84,363 | ||||||
| 46,328 | Global Net Lease, Inc. REIT | 334,025 | ||||||
| 24,782 | Hudson Pacific Properties, Inc. REIT | 157,118 | ||||||
| 25,667 | Independence Realty Trust, Inc. REIT | 375,765 | ||||||
| The accompanying notes are an integral part of these financial statements. | 83 |
GOLDMAN SACHS ACTIVEBETA® U.S. SMALL CAP EQUITY ETF
|
Schedule of Investments (continued)
February 29, 2024 (Unaudited) |
|
Shares |
Description | Value | ||||||
| Common Stocks – (continued) |
| |||||||
| Real Estate – (continued) |
| |||||||
| 3,842 | Innovative Industrial Properties, Inc. REIT | $ | 376,478 | |||||
| 8,756 | InvenTrust Properties Corp. REIT | 221,089 | ||||||
| 15,648 | JBG SMITH Properties REIT | 259,444 | ||||||
| 8,172 | Kennedy-Wilson Holdings, Inc. | 71,750 | ||||||
| 37,101 | Kite Realty Group Trust REIT | 794,332 | ||||||
| 7,048 | LTC Properties, Inc. REIT | 221,730 | ||||||
| 37,861 | LXP Industrial Trust REIT | 327,876 | ||||||
| 32,081 | Macerich Co. (The) REIT | 526,449 | ||||||
| 19,201 | Marcus & Millichap, Inc. | 704,485 | ||||||
| 6,897 | National Health Investors, Inc. REIT | 396,371 | ||||||
| 21,562 | Newmark Group, Inc., Class A | 232,654 | ||||||
| 5,892 | NexPoint Residential Trust, Inc. REIT | 172,105 | ||||||
| 17,395 | Office Properties Income Trust REIT | 46,445 | ||||||
| 37,616 | Opendoor Technologies, Inc.* | 115,857 | ||||||
| 17,036 | Orion Office REIT, Inc. REIT | 59,796 | ||||||
| 27,152 | Outfront Media, Inc. REIT | 390,174 | ||||||
| 41,726 | Paramount Group, Inc. REIT | 184,846 | ||||||
| 21,543 | Pebblebrook Hotel Trust REIT | 341,241 | ||||||
| 14,891 | Phillips Edison & Co., Inc. REIT | 531,907 | ||||||
| 26,985 | Piedmont Office Realty Trust, Inc., Class A REIT | 169,196 | ||||||
| 6,351 | Plymouth Industrial REIT, Inc. REIT | 136,991 | ||||||
| 11,225 | Postal Realty Trust, Inc., Class A REIT | 160,742 | ||||||
| 21,101 | PotlatchDeltic Corp. REIT | 953,976 | ||||||
| 14,606 | RE/MAX Holdings, Inc., Class A | 124,589 | ||||||
| 16,438 | Redfin Corp.* | 116,792 | ||||||
| 20,372 | Retail Opportunity Investments Corp. REIT | 263,410 | ||||||
| 27,151 | RLJ Lodging Trust REIT | 322,282 | ||||||
| 11,234 | RMR Group, Inc. (The), Class A | 274,896 | ||||||
| 9,409 | Ryman Hospitality Properties, Inc. REIT | 1,114,778 | ||||||
| 35,840 | Sabra Health Care REIT, Inc. REIT | 497,459 | ||||||
| 2,482 | Saul Centers, Inc. REIT | 89,824 | ||||||
| 42,869 | Service Properties Trust REIT | 291,509 | ||||||
| 29,331 | SITE Centers Corp. REIT | 398,315 | ||||||
| 5,033 | SL Green Realty Corp. REIT | 244,000 | ||||||
| 5,957 | St Joe Co. (The) | 320,904 | ||||||
| 35,417 | Summit Hotel Properties, Inc. REIT | 227,377 | ||||||
| 36,315 | Sunstone Hotel Investors, Inc. REIT | 406,365 | ||||||
| 22,155 | Tanger, Inc. REIT | 638,286 | ||||||
| 10,298 | Terreno Realty Corp. REIT | 662,161 | ||||||
| 10,786 | UMH Properties, Inc. REIT | 166,104 | ||||||
| 62,648 | Uniti Group, Inc. REIT | 367,117 | ||||||
| 2,956 | Universal Health Realty Income Trust REIT | 114,634 | ||||||
| 15,128 | Urban Edge Properties REIT | 257,327 | ||||||
| 20,030 | Veris Residential, Inc. REIT | 292,438 | ||||||
|
Shares |
Description | Value | ||||||
| Common Stocks – (continued) |
| |||||||
| Real Estate – (continued) |
| |||||||
| 21,331 | Whitestone REIT | $ | 262,798 | |||||
| 23,920 | Xenia Hotels & Resorts, Inc. REIT | 366,933 | ||||||
|
|
|
|||||||
| 26,708,939 | ||||||||
|
|
||||||||
| Utilities – 2.8% | ||||||||
| 12,298 | ALLETE, Inc. | 696,559 | ||||||
| 9,403 | American States Water Co. | 671,468 | ||||||
| 13,709 | Avista Corp. | 455,139 | ||||||
| 13,236 | Black Hills Corp. | 688,669 | ||||||
| 26,266 | Brookfield Infrastructure Corp., Class A (Canada)(a) | 871,243 | ||||||
| 9,025 | California Water Service Group | 414,157 | ||||||
| 4,613 | Chesapeake Utilities Corp. | 470,664 | ||||||
| 14,318 | Consolidated Water Co. Ltd. (Cayman Islands) | 423,240 | ||||||
| 19,013 | Genie Energy Ltd., Class B | 346,797 | ||||||
| 7,452 | MGE Energy, Inc. | 470,892 | ||||||
| 3,029 | Middlesex Water Co. | 154,146 | ||||||
| 53,465 | Montauk Renewables, Inc.* | 303,681 | ||||||
| 16,735 | New Jersey Resources Corp. | 696,343 | ||||||
| 5,332 | Northwest Natural Holding Co. | 195,898 | ||||||
| 10,915 | Northwestern Energy Group, Inc. | 523,047 | ||||||
| 13,513 | ONE Gas, Inc. | 805,375 | ||||||
| 10,278 | Ormat Technologies, Inc. | 669,612 | ||||||
| 13,297 | Otter Tail Corp. | 1,202,847 | ||||||
| 17,718 | PNM Resources, Inc. | 646,884 | ||||||
| 19,631 | Portland General Electric Co. | 788,577 | ||||||
| 17,901 | Pure Cycle Corp.* | 178,473 | ||||||
| 3,819 | RGC Resources, Inc. | 71,644 | ||||||
| 5,353 | SJW Group | 294,736 | ||||||
| 11,373 | Southwest Gas Holdings, Inc. | 775,070 | ||||||
| 9,333 | Spire, Inc. | 553,634 | ||||||
| 5,056 | Unitil Corp. | 257,654 | ||||||
| 4,822 | York Water Co. (The) | 170,699 | ||||||
|
|
|
|||||||
| 13,797,148 | ||||||||
|
|
||||||||
|
TOTAL COMMON STOCKS (Cost $444,247,613) |
491,871,940 | |||||||
|
|
||||||||
| Units | Description | Expiration Month | Value | |||||||||
| Rights – 0.0% |
| |||||||||||
| Health Care* – 0.0% |
| |||||||||||
| 4,104 | Chinook Therapeutics, Inc.*(b) | 12/25 | 1,601 | |||||||||
| 45,824 | Radius Health, Inc.*(b) | 12/25 | 3,666 | |||||||||
|
|
|
|||||||||||
| 5,267 | ||||||||||||
|
|
||||||||||||
| Materials – 0.0% |
| |||||||||||
| 15,501 | Resolute Forest Products*(b) | 09/23 | 22,011 | |||||||||
|
|
||||||||||||
|
TOTAL RIGHTS (Cost $0) |
|
27,278 | ||||||||||
|
|
||||||||||||
| 84 | The accompanying notes are an integral part of these financial statements. |
GOLDMAN SACHS ACTIVEBETA® U.S. SMALL CAP EQUITY ETF
|
Shares |
Dividend Rate | Value | ||||||
| Investment Company – 0.6%(c) |
| |||||||
|
Goldman Sachs Financial Square Treasury Obligations Fund – Institutional Shares |
||||||||
|
3,112,940 |
5.195% | $ | 3,112,940 | |||||
| (Cost $3,112,940) | ||||||||
|
|
||||||||
|
TOTAL INVESTMENTS BEFORE SECURITIES LENDING REINVESTMENT VEHICLE (Cost $447,360,553) |
495,012,158 | |||||||
|
|
||||||||
|
Shares |
Dividend Rate | Value | ||||||
| Securities Lending Reinvestment Vehicle – 0.8%(c) |
| |||||||
|
Goldman Sachs Financial Square Government Fund - Institutional Shares |
||||||||
|
4,158,292 |
5.219% | $ | 4,158,292 | |||||
| (Cost $4,158,292) |
| |||||||
|
|
||||||||
| TOTAL INVESTMENTS – 100.6% |
| |||||||
| (Cost $451,518,845) | $ | 499,170,450 | ||||||
|
|
||||||||
|
LIABILITIES IN EXCESS OF OTHER ASSETS – (0.6)% |
(2,893,545) | |||||||
|
|
||||||||
| NET ASSETS – 100.0% | $ | 496,276,905 | ||||||
|
|
||||||||
The percentage shown for each investment category reflects the value of investments in that category as a percentage of net assets.
| * |
Non-income producing security. |
| (a) |
All or a portion of security is on loan. |
| (b) |
Significant unobservable inputs were used in the valuation of this portfolio security; i.e. Level 3. |
| (c) |
Represents an affiliated issuer. |
|
| ||
| Investment Abbreviations: | ||
| PLC | —Public Limited Company | |
| REIT | —Real Estate Investment Trust | |
|
| ||
|
ADDITIONAL INVESTMENT INFORMATION |
FUTURES CONTRACTS — At February 29, 2024, the Fund had the following futures contracts:
| Description | Number of Contracts |
Expiration Date |
Notional Amount |
Unrealized Appreciation/ (Depreciation) |
||||||||
|
|
||||||||||||
|
Long position contracts: |
||||||||||||
|
Russell 2000 E-Mini Index |
38 | 03/15/24 | $ | 3,908,870 | $ | 109,636 | ||||||
|
|
||||||||||||
| The accompanying notes are an integral part of these financial statements. | 85 |
GOLDMAN SACHS ACTIVEBETA® WORLD LOW VOL PLUS EQUITY ETF
|
Schedule of Investments
February 29, 2024 (Unaudited) |
| Shares | Description | Value | ||||||
| Common Stocks – 99.4% | ||||||||
| Australia – 2.5% | ||||||||
| 54,542 | ANZ Group Holdings Ltd. (Financials) | $ | 1,010,403 | |||||
| 117,370 | Brambles Ltd. (Industrials) | 1,151,732 | ||||||
| 295,256 | Coles Group Ltd. (Consumer Staples) | 3,249,126 | ||||||
| 39,122 | EBOS Group Ltd. (Health Care) | 880,706 | ||||||
| 176,523 | Insurance Australia Group Ltd. (Financials) | 712,647 | ||||||
| 195,383 | Lottery Corp. Ltd. (The) (Consumer Discretionary) | 646,296 | ||||||
| 684,242 | Medibank Pvt Ltd. (Financials) | 1,599,504 | ||||||
| 64,778 | National Australia Bank Ltd. (Financials) | 1,427,378 | ||||||
| 33,175 | Sonic Healthcare Ltd. (Health Care) | 644,817 | ||||||
| 820,013 | Telstra Group Ltd. (Communication Services) | 2,039,695 | ||||||
| 109,478 | Wesfarmers Ltd. (Consumer Discretionary) | 4,750,540 | ||||||
| 30,866 | Westpac Banking Corp. (Financials) | 529,593 | ||||||
| 119,847 | Woolworths Group Ltd. (Consumer Staples) | 2,545,613 | ||||||
|
|
|
|||||||
| 21,188,050 | ||||||||
|
|
||||||||
| Austria – 0.1% | ||||||||
| 9,821 | Vienna Insurance Group AG Wiener Versicherung Gruppe (Financials) | 285,357 | ||||||
| 27,498 | Wienerberger AG (Materials) | 961,150 | ||||||
|
|
|
|||||||
| 1,246,507 | ||||||||
|
|
||||||||
| Belgium – 0.2% | ||||||||
| 6,088 | Ackermans & van Haaren NV (Industrials) | 1,023,137 | ||||||
| 19,947 | Warehouses De Pauw CVA REIT (Real Estate) | 532,734 | ||||||
|
|
|
|||||||
| 1,555,871 | ||||||||
|
|
||||||||
| Canada – 3.5% | ||||||||
| 36,861 | Bank of Nova Scotia (The) (Financials) | 1,788,493 | ||||||
| 6,319 | Brookfield Asset Management Ltd., Class A (Financials)(a) | 257,680 | ||||||
| 34,317 | Canadian Imperial Bank of Commerce (Financials) | 1,624,830 | ||||||
| 35,488 | CGI, Inc. (Information Technology)* | 4,076,927 | ||||||
| 9,398 | George Weston Ltd. (Consumer Staples) | 1,231,680 | ||||||
| 74,232 | Great-West Lifeco, Inc. (Financials)(a) | 2,287,682 | ||||||
| 15,231 | Hydro One Ltd. (Utilities)(b) | 454,229 | ||||||
| 2,472 | Intact Financial Corp. (Financials) | 411,310 | ||||||
| 33,150 | Loblaw Cos. Ltd. (Consumer Staples) | 3,535,088 | ||||||
| 27,096 | Manulife Financial Corp. (Financials) | 643,464 | ||||||
| Shares | Description | Value | ||||||
| Common Stocks – (continued) | ||||||||
| Canada – (continued) | ||||||||
| 15,411 | Metro, Inc. (Consumer Staples) | $ | 834,888 | |||||
| 25,658 | National Bank of Canada (Financials) | 2,003,872 | ||||||
| 96,333 | Power Corp. of Canada (Financials) | 2,784,839 | ||||||
| 22,234 | Royal Bank of Canada (Financials) | 2,160,535 | ||||||
| 34,560 | Sun Life Financial, Inc. (Financials)(a) | 1,836,609 | ||||||
| 10,434 | Thomson Reuters Corp. (Industrials) | 1,648,085 | ||||||
| 21,072 | Toronto-Dominion Bank (The) (Financials) | 1,266,013 | ||||||
|
|
|
|||||||
| 28,846,224 | ||||||||
|
|
||||||||
| Denmark – 0.0% | ||||||||
| 6,466 | Tryg A/S (Financials) | 137,519 | ||||||
|
|
||||||||
| Finland – 0.4% | ||||||||
| 3,145 | Elisa OYJ (Communication Services) | 141,784 | ||||||
| 29,190 | Orion OYJ, Class B (Health Care) | 1,149,802 | ||||||
| 24,493 | Sampo OYJ, Class A (Financials) | 1,096,516 | ||||||
| 29,489 | UPM-Kymmene OYJ (Materials) | 987,024 | ||||||
|
|
|
|||||||
| 3,375,126 | ||||||||
|
|
||||||||
| France – 2.5% | ||||||||
| 9,449 | Air Liquide SA (Materials) | 1,921,322 | ||||||
| 82,613 | AXA SA (Financials) | 2,939,462 | ||||||
| 42,048 | Bouygues SA (Industrials) | 1,664,018 | ||||||
| 7,002 | Capgemini SE (Information Technology) | 1,702,601 | ||||||
| 84,977 | Cie Generale des Etablissements Michelin SCA (Consumer Discretionary) | 3,144,040 | ||||||
| 12,328 | Danone SA (Consumer Staples) | 787,371 | ||||||
| 4,537 | Dassault Systemes (Information Technology) | 212,026 | ||||||
| 3,755 | Legrand SA (Industrials) | 379,935 | ||||||
| 5,650 | L’Oreal SA (Consumer Staples) | 2,700,620 | ||||||
| 377,989 | Orange SA (Communication Services) | 4,338,288 | ||||||
| 6,479 | Thales SA (Industrials) | 960,892 | ||||||
|
|
|
|||||||
| 20,750,575 | ||||||||
|
|
||||||||
| Germany – 1.9% | ||||||||
| 5,363 | Allianz SE (Financials) | 1,473,237 | ||||||
| 13,091 | Beiersdorf AG (Consumer Staples) | 1,877,760 | ||||||
| 7,390 | Deutsche Boerse AG (Financials) | 1,548,237 | ||||||
| 133,500 | Deutsche Telekom AG (Communication Services) | 3,176,109 | ||||||
| 159,813 | E.ON SE (Utilities) | 2,042,441 | ||||||
| 3,547 | Hannover Rueck SE (Financials) | 910,849 | ||||||
| 86 | The accompanying notes are an integral part of these financial statements. |
GOLDMAN SACHS ACTIVEBETA® WORLD LOW VOL PLUS EQUITY ETF
| Shares | Description | Value | ||||||
| Common Stocks – (continued) | ||||||||
| Germany – (continued) | ||||||||
| 4,208 | Henkel AG & Co. KGaA (Consumer Staples) | $ | 284,150 | |||||
| 3,776 | Muenchener Rueckversicherungs- Gesellschaft AG in Muenchen (Financials) | 1,758,700 | ||||||
| 11,399 | SAP SE (Information Technology) | 2,132,550 | ||||||
| 14,083 | Talanx AG (Financials) | 1,005,835 | ||||||
|
|
|
|||||||
| 16,209,868 | ||||||||
|
|
||||||||
| Hong Kong – 0.1% | ||||||||
| 10,637 | CK Asset Holdings Ltd. (Real Estate) | 49,117 | ||||||
| 62,073 | CLP Holdings Ltd. (Utilities) | 517,354 | ||||||
| 55,368 | Power Assets Holdings Ltd. (Utilities) | 333,108 | ||||||
|
|
|
|||||||
| 899,579 | ||||||||
|
|
||||||||
| Ireland – 0.1% | ||||||||
| 5,238 | Kerry Group PLC, Class A (Consumer Staples) | 459,926 | ||||||
|
|
||||||||
| Israel – 0.6% | ||||||||
| 17,350 | Check Point Software Technologies Ltd. (Information Technology)* | 2,783,287 | ||||||
| 14,286 | First International Bank Of Israel Ltd. (The) (Financials) | 616,383 | ||||||
| 153,002 | Mivne Real Estate KD Ltd. (Real Estate) | 410,564 | ||||||
| 41,241 | Mizrahi Tefahot Bank Ltd. (Financials) | 1,631,581 | ||||||
|
|
|
|||||||
| 5,441,815 | ||||||||
|
|
||||||||
| Italy – 0.7% | ||||||||
| 193,231 | Assicurazioni Generali SpA (Financials) | 4,583,581 | ||||||
| 110,359 | Enel SpA (Utilities) | 702,577 | ||||||
| 29,585 | Terna - Rete Elettrica Nazionale (Utilities) | 231,920 | ||||||
| 116,524 | UnipolSai Assicurazioni SpA (Financials) | 335,669 | ||||||
|
|
|
|||||||
| 5,853,747 | ||||||||
|
|
||||||||
| Japan – 7.9% | ||||||||
| 6,893 | Aeon Co. Ltd. (Consumer Staples)(a) | 164,645 | ||||||
| 115,131 | ANA Holdings, Inc. (Industrials)*(a) | 2,510,774 | ||||||
| 77,195 | Astellas Pharma, Inc. (Health Care) | 851,791 | ||||||
| 73,731 | Bridgestone Corp. (Consumer Discretionary) | 3,175,453 | ||||||
| 169,234 | Canon, Inc. (Information Technology) | 4,949,136 | ||||||
| 32,261 | Central Japan Railway Co. (Industrials) | 812,399 | ||||||
| 71,098 | Chubu Electric Power Co., Inc. (Utilities) | 886,647 | ||||||
| Shares | Description | Value | ||||||
| Common Stocks – (continued) | ||||||||
| Japan – (continued) | ||||||||
| 43,051 | Daiwa House Industry Co. Ltd. (Real Estate) | $ | 1,245,479 | |||||
| 174,576 | Daiwa Securities Group, Inc. (Financials) | 1,285,380 | ||||||
| 15,030 | FUJIFILM Holdings Corp. (Information Technology) | 956,309 | ||||||
| 3,139 | Fujitsu Ltd. (Information Technology) | 490,449 | ||||||
| 21,666 | Hankyu Hanshin Holdings, Inc. (Industrials) | 624,922 | ||||||
| 22,281 | Haseko Corp. (Consumer Discretionary) | 276,075 | ||||||
| 61,082 | Hulic Co. Ltd. (Real Estate) | 609,310 | ||||||
| 104,936 | Japan Post Bank Co. Ltd. (Financials) | 1,120,032 | ||||||
| 298,803 | Japan Post Holdings Co. Ltd. (Financials) | 2,887,810 | ||||||
| 126,892 | Japan Tobacco, Inc. (Consumer Staples) | 3,299,684 | ||||||
| 45,429 | KDDI Corp. (Communication Services) | 1,382,265 | ||||||
| 27,839 | Kirin Holdings Co. Ltd. (Consumer Staples) | 387,722 | ||||||
| 199,857 | Kyocera Corp. (Information Technology) | 2,943,708 | ||||||
| 46,710 | Kyushu Electric Power Co., Inc. (Utilities)* | 381,838 | ||||||
| 16,426 | Kyushu Railway Co. (Industrials) | 377,863 | ||||||
| 22,195 | McDonald’s Holdings Co. Japan Ltd. (Consumer Discretionary) | 1,033,602 | ||||||
| 25,484 | MEIJI Holdings Co. Ltd. (Consumer Staples) | 574,995 | ||||||
| 226,661 | Mitsubishi HC Capital, Inc. (Financials) | 1,564,380 | ||||||
| 51,303 | MS&AD Insurance Group Holdings, Inc. (Financials) | 2,539,956 | ||||||
| 15,236 | NH Foods Ltd. (Consumer Staples) | 534,029 | ||||||
| 3,969,391 | Nippon Telegraph & Telephone Corp. (Communication Services) | 4,834,770 | ||||||
| 57,049 | Nisshin Seifun Group, Inc. (Consumer Staples) | 790,918 | ||||||
| 121,048 | Obayashi Corp. (Industrials) | 1,172,306 | ||||||
| 120,861 | Oji Holdings Corp. (Materials) | 473,447 | ||||||
| 68,967 | Ono Pharmaceutical Co. Ltd. (Health Care) | 1,146,455 | ||||||
| 31,384 | Osaka Gas Co. Ltd. (Utilities) | 627,806 | ||||||
| 69,877 | Otsuka Holdings Co. Ltd. (Health Care) | 2,839,526 | ||||||
| 16,941 | SCSK Corp. (Information Technology) | 312,402 | ||||||
| 10,423 | Secom Co. Ltd. (Industrials) | 760,467 | ||||||
| 53,962 | Sekisui Chemical Co. Ltd. (Consumer Discretionary) | 760,379 | ||||||
| 83,032 | Sekisui House Ltd. (Consumer Discretionary) | 1,852,922 | ||||||
| The accompanying notes are an integral part of these financial statements. | 87 |
GOLDMAN SACHS ACTIVEBETA® WORLD LOW VOL PLUS EQUITY ETF
|
Schedule of Investments (continued)
February 29, 2024 (Unaudited) |
| Shares | Description | Value | ||||||
| Common Stocks – (continued) | ||||||||
| Japan – (continued) | ||||||||
| 7,924 | Shionogi & Co. Ltd. (Health Care) | $ | 396,226 | |||||
| 304,569 | SoftBank Corp. (Communication Services) | 4,013,913 | ||||||
| 150,272 | Takeda Pharmaceutical Co. Ltd. (Health Care) | 4,404,645 | ||||||
| 25,322 | Tobu Railway Co. Ltd. (Industrials) | 647,473 | ||||||
| 35,902 | Trend Micro, Inc. (Information Technology) | 1,781,307 | ||||||
| 22,722 | USS Co. Ltd. (Consumer Discretionary) | 395,551 | ||||||
| 145,165 | Yamada Holdings Co. Ltd. (Consumer Discretionary) | 417,833 | ||||||
|
|
|
|||||||
| 65,494,999 | ||||||||
|
|
||||||||
| Netherlands – 1.4% | ||||||||
| 5,089 | HAL Trust (Financials) | 628,907 | ||||||
| 1,822 | Heineken Holding NV (Consumer Staples) | 140,778 | ||||||
| 166,148 | Koninklijke Ahold Delhaize NV (Consumer Staples) | 4,948,017 | ||||||
| 294,641 | Koninklijke KPN NV (Communication Services) | 1,078,655 | ||||||
| 32,396 | Wolters Kluwer NV (Industrials) | 5,113,113 | ||||||
|
|
|
|||||||
| 11,909,470 | ||||||||
|
|
||||||||
| New Zealand – 0.1% | ||||||||
| 19,892 | Mainfreight Ltd. (Industrials) | 821,197 | ||||||
|
|
||||||||
| Norway – 0.6% | ||||||||
| 66,296 | DNB Bank ASA (Financials) | 1,327,890 | ||||||
| 50,462 | Gjensidige Forsikring ASA (Financials) | 797,928 | ||||||
| 47,401 | SpareBank 1 SR-Bank ASA (Financials) | 574,219 | ||||||
| 93,565 | Storebrand ASA (Financials) | 836,495 | ||||||
| 99,398 | Telenor ASA (Communication Services) | 1,089,704 | ||||||
|
|
|
|||||||
| 4,626,236 | ||||||||
|
|
||||||||
| Portugal – 0.0% | ||||||||
| 22,251 | EDP – Energias de Portugal SA (Utilities) | 88,586 | ||||||
|
|
||||||||
| Singapore – 1.0% | ||||||||
| 8,473 | DBS Group Holdings Ltd. (Financials) | 210,029 | ||||||
| 254,610 | Oversea-Chinese Banking Corp. Ltd. (Financials) | 2,457,860 | ||||||
| 281,620 | Singapore Airlines Ltd. (Industrials) | 1,355,110 | ||||||
| 222,793 | Singapore Exchange Ltd. (Financials) | 1,565,814 | ||||||
| 64,261 | United Overseas Bank Ltd. (Financials) | 1,335,784 | ||||||
| 97,906 | UOL Group Ltd. (Real Estate) | 428,876 | ||||||
| Shares | Description | Value | ||||||
| Common Stocks – (continued) | ||||||||
| Singapore – (continued) | ||||||||
| 76,500 | Venture Corp. Ltd. (Information Technology) | $ | 796,519 | |||||
|
|
|
|||||||
| 8,149,992 | ||||||||
|
|
||||||||
| Spain – 0.6% | ||||||||
| 30,459 | ACS Actividades de Construccion y Servicios SA (Industrials) | 1,250,549 | ||||||
| 65,985 | Iberdrola SA (Utilities) | 758,328 | ||||||
| 34,799 | Naturgy Energy Group SA (Utilities) | 823,952 | ||||||
| 16,731 | Redeia Corp. SA (Utilities) | 266,150 | ||||||
| 432,563 | Telefonica SA (Communication Services) | 1,775,496 | ||||||
|
|
|
|||||||
| 4,874,475 | ||||||||
|
|
||||||||
| Sweden – 0.7% | ||||||||
| 29,313 | Axfood AB (Consumer Staples) | 819,833 | ||||||
| 9,882 | Essity AB, Class B (Consumer Staples) | 230,828 | ||||||
| 6,587 | Industrivarden AB, Class C (Financials) | 224,268 | ||||||
| 112,539 | Investor AB, Class A (Financials) | 2,792,960 | ||||||
| 20,803 | Investor AB, Class B (Financials) | 523,520 | ||||||
| 26,197 | Skandinaviska Enskilda Banken AB, Class A (Financials) | 389,381 | ||||||
| 269,112 | Telia Co. AB (Communication Services) | 641,607 | ||||||
|
|
|
|||||||
| 5,622,397 | ||||||||
|
|
||||||||
| Switzerland – 1.3% | ||||||||
| 35,823 | Novartis AG (Health Care) | 3,640,679 | ||||||
| 29,685 | SGS SA (Industrials) | 2,858,768 | ||||||
| 3,695 | Swisscom AG (Communication Services) | 2,120,780 | ||||||
| 5,308 | Zurich Insurance Group AG (Financials) | 2,833,184 | ||||||
|
|
|
|||||||
| 11,453,411 | ||||||||
|
|
||||||||
| United Kingdom – 3.0% | ||||||||
| 275,697 | BAE Systems PLC (Industrials) | 4,331,390 | ||||||
| 48,293 | British American Tobacco PLC (Consumer Staples) | 1,432,520 | ||||||
| 28,497 | Bunzl PLC (Industrials) | 1,136,572 | ||||||
| 582,569 | CK Hutchison Holdings Ltd. (Industrials) | 2,957,940 | ||||||
| 10,425 | Coca-Cola Europacific Partners PLC (Consumer Staples) | 715,468 | ||||||
| 38,624 | Compass Group PLC (Consumer Discretionary) | 1,060,207 | ||||||
| 6,423 | London Stock Exchange Group PLC (Financials) | 721,155 | ||||||
| 40,085 | National Grid PLC (Utilities) | 526,070 | ||||||
| 113,001 | RELX PLC (Industrials) | 4,947,178 | ||||||
| 276,877 | Sage Group PLC (The) (Information Technology) | 4,358,685 | ||||||
| 88 | The accompanying notes are an integral part of these financial statements. |
GOLDMAN SACHS ACTIVEBETA® WORLD LOW VOL PLUS EQUITY ETF
| Shares | Description | Value | ||||||
| Common Stocks – (continued) | ||||||||
| United Kingdom – (continued) | ||||||||
| 869,711 | Tesco PLC (Consumer Staples) | $ | 3,067,195 | |||||
|
|
|
|||||||
| 25,254,380 | ||||||||
|
|
||||||||
| United States – 70.2% | ||||||||
| 12,758 | 3M Co. (Industrials) | 1,175,267 | ||||||
| 4,482 | Abbott Laboratories (Health Care) | 531,744 | ||||||
| 27,611 | AbbVie, Inc. (Health Care) | 4,860,917 | ||||||
| 17,954 | Accenture PLC, Class A (Information Technology) | 6,728,800 | ||||||
| 8,836 | Adobe, Inc. (Information Technology)* | 4,950,634 | ||||||
| 44,178 | Aflac, Inc. (Financials) | 3,566,932 | ||||||
| 3,431 | Agilent Technologies, Inc. (Health Care) | 471,282 | ||||||
| 1,579 | Air Products and Chemicals, Inc. (Materials) | 369,549 | ||||||
| 22,969 | Akamai Technologies, Inc. (Information Technology)* | 2,547,721 | ||||||
| 41,015 | Alphabet, Inc., Class A (Communication Services)* | 5,678,937 | ||||||
| 36,895 | Alphabet, Inc., Class C (Communication Services)* | 5,157,183 | ||||||
| 12,903 | Altria Group, Inc. (Consumer Staples) | 527,862 | ||||||
| 55,492 | Amazon.com, Inc. (Consumer Discretionary)* | 9,808,766 | ||||||
| 31,362 | Amdocs Ltd. (Information Technology) | 2,860,214 | ||||||
| 10,606 | AMETEK, Inc. (Industrials) | 1,910,989 | ||||||
| 6,390 | Amgen, Inc. (Health Care) | 1,749,774 | ||||||
| 41,158 | Amphenol Corp., Class A (Information Technology) | 4,496,100 | ||||||
| 5,731 | Analog Devices, Inc. (Information Technology) | 1,099,320 | ||||||
| 133,538 | Apple, Inc. (Information Technology) | 24,136,994 | ||||||
| 21,650 | Arch Capital Group Ltd. (Financials)* | 1,896,324 | ||||||
| 11,123 | Arthur J Gallagher & Co. (Financials) | 2,713,233 | ||||||
| 203,801 | AT&T, Inc. (Communication Services) | 3,450,351 | ||||||
| 2,595 | Automatic Data Processing, Inc. (Industrials) | 651,682 | ||||||
| 2,272 | AutoZone, Inc. (Consumer Discretionary)* | 6,829,677 | ||||||
| 73,494 | Bank of America Corp. (Financials) | 2,537,013 | ||||||
| 5,239 | Becton Dickinson & Co. (Health Care) | 1,234,046 | ||||||
| 23,454 | Berkshire Hathaway, Inc., Class B (Financials)* | 9,602,068 | ||||||
| 23,379 | Boston Scientific Corp. (Health Care)* | 1,547,924 | ||||||
| 62,825 | Bristol-Myers Squibb Co. (Health Care) | 3,188,369 | ||||||
| 3,138 | Broadcom, Inc. (Information Technology) | 4,080,938 | ||||||
| Shares | Description | Value | ||||||
| Common Stocks – (continued) | ||||||||
| United States – (continued) | ||||||||
| 9,036 | Broadridge Financial Solutions, Inc. (Industrials) | $ | 1,839,549 | |||||
| 31,277 | C.H. Robinson Worldwide, Inc. (Industrials) | 2,317,000 | ||||||
| 38,730 | Cardinal Health, Inc. (Health Care) | 4,336,985 | ||||||
| 9,415 | Cboe Global Markets, Inc. (Financials) | 1,807,680 | ||||||
| 17,152 | CDW Corp. (Information Technology) | 4,222,994 | ||||||
| 20,986 | Cencora, Inc. (Health Care) | 4,944,302 | ||||||
| 15,157 | Chevron Corp. (Energy) | 2,304,016 | ||||||
| 2,431 | Chubb Ltd. (Financials) | 611,810 | ||||||
| 21,777 | Church & Dwight Co., Inc. (Consumer Staples) | 2,180,313 | ||||||
| 10,698 | Cigna Group (The) (Health Care) | 3,596,026 | ||||||
| 5,426 | Cintas Corp. (Industrials) | 3,410,838 | ||||||
| 120,562 | Cisco Systems, Inc. (Information Technology) | 5,831,584 | ||||||
| 56,113 | Citigroup, Inc. (Financials) | 3,113,710 | ||||||
| 5,720 | CME Group, Inc. (Financials) | 1,260,402 | ||||||
| 55,549 | Coca-Cola Co. (The) (Consumer Staples) | 3,334,051 | ||||||
| 63,587 | Cognizant Technology Solutions Corp., Class A (Information Technology) | 5,024,645 | ||||||
| 76,842 | Colgate-Palmolive Co. (Consumer Staples) | 6,648,370 | ||||||
| 69,071 | Comcast Corp., Class A (Communication Services) | 2,959,692 | ||||||
| 55,958 | Conagra Brands, Inc. (Consumer Staples) | 1,571,301 | ||||||
| 7,722 | Consolidated Edison, Inc. (Utilities) | 673,436 | ||||||
| 1,472 | Constellation Brands, Inc., Class A (Consumer Staples) | 365,821 | ||||||
| 15,014 | Copart, Inc. (Industrials)* | 797,994 | ||||||
| 25,526 | Corning, Inc. (Information Technology) | 822,958 | ||||||
| 6,669 | Costco Wholesale Corp. (Consumer Staples) | 4,961,002 | ||||||
| 12,675 | CSX Corp. (Industrials) | 480,890 | ||||||
| 784 | Cummins, Inc. (Industrials) | 210,590 | ||||||
| 63,633 | CVS Health Corp. (Health Care) | 4,732,386 | ||||||
| 3,955 | Darden Restaurants, Inc. (Consumer Discretionary) | 675,158 | ||||||
| 59,733 | Dell Technologies, Inc., Class C (Information Technology) | 5,654,326 | ||||||
| 3,085 | Dover Corp. (Industrials) | 510,197 | ||||||
| 20,653 | Dow, Inc. (Materials) | 1,154,090 | ||||||
| 1,699 | Duke Energy Corp. (Utilities) | 156,019 | ||||||
| 6,824 | Eaton Corp. PLC (Industrials) | 1,972,136 | ||||||
| 1,192 | Ecolab, Inc. (Materials) | 268,009 | ||||||
| 9,863 | Electronic Arts, Inc. (Communication Services) | 1,375,691 | ||||||
| The accompanying notes are an integral part of these financial statements. | 89 |
GOLDMAN SACHS ACTIVEBETA® WORLD LOW VOL PLUS EQUITY ETF
|
Schedule of Investments (continued)
February 29, 2024 (Unaudited) |
| Shares | Description | Value | ||||||
| Common Stocks – (continued) | ||||||||
| United States – (continued) | ||||||||
| 6,109 | Elevance Health, Inc. (Health Care) | $ | 3,062,136 | |||||
| 7,412 | Eli Lilly & Co. (Health Care) | 5,586,276 | ||||||
| 3,882 | Everest Group Ltd. (Financials) | 1,431,992 | ||||||
| 13,687 | Expeditors International of Washington, Inc. (Industrials) | 1,636,965 | ||||||
| 28,310 | Exxon Mobil Corp. (Energy) | 2,958,961 | ||||||
| 81,213 | Fastenal Co. (Industrials) | 5,929,361 | ||||||
| 8,934 | Ferguson PLC (Industrials) | 1,889,094 | ||||||
| 7,604 | Fidelity National Financial, Inc. (Financials) | 384,610 | ||||||
| 6,388 | Fiserv, Inc. (Financials)* | 953,537 | ||||||
| 9,184 | FleetCor Technologies, Inc. (Financials)* | 2,564,816 | ||||||
| 17,601 | Fortive Corp. (Industrials) | 1,498,373 | ||||||
| 42,946 | Fox Corp., Class A (Communication Services) | 1,279,361 | ||||||
| 30,473 | Fox Corp., Class B (Communication Services) | 834,351 | ||||||
| 8,165 | Gartner, Inc. (Information Technology)* | 3,801,297 | ||||||
| 4,477 | GE HealthCare Technologies, Inc. (Health Care) | 408,661 | ||||||
| 36,069 | Gen Digital, Inc. (Information Technology) | 775,123 | ||||||
| 11,331 | General Dynamics Corp. (Industrials) | 3,096,196 | ||||||
| 14,844 | General Electric Co. (Industrials) | 2,328,875 | ||||||
| 10,111 | General Mills, Inc. (Consumer Staples) | 648,924 | ||||||
| 30,660 | Genuine Parts Co. (Consumer Discretionary) | 4,576,312 | ||||||
| 63,582 | Gilead Sciences, Inc. (Health Care) | 4,584,262 | ||||||
| 130,660 | GSK PLC (Health Care) | 2,751,226 | ||||||
| 143,264 | Haleon PLC (Consumer Staples) | 600,660 | ||||||
| 17,764 | Hartford Financial Services Group, Inc. (The) (Financials) | 1,702,502 | ||||||
| 1,338 | HCA Healthcare, Inc. (Health Care) | 417,055 | ||||||
| 35,255 | Henry Schein, Inc. (Health Care)* | 2,695,950 | ||||||
| 17,613 | Hershey Co. (The) (Consumer Staples) | 3,309,835 | ||||||
| 274,023 | Hewlett Packard Enterprise Co. (Information Technology) | 4,173,370 | ||||||
| 12,628 | Hologic, Inc. (Health Care)* | 931,946 | ||||||
| 18,088 | Home Depot, Inc. (The) (Consumer Discretionary) | 6,884,474 | ||||||
| 656 | Honeywell International, Inc. (Industrials) | 130,367 | ||||||
| 65,771 | HP, Inc. (Information Technology) | 1,863,292 | ||||||
| 18,183 | Illinois Tool Works, Inc. (Industrials) | 4,766,673 | ||||||
| 27,830 | Incyte Corp. (Health Care)* | 1,624,159 | ||||||
| Shares | Description | Value | ||||||
| Common Stocks – (continued) | ||||||||
| United States – (continued) | ||||||||
| 31,400 | Intel Corp. (Information Technology) | $ | 1,351,770 | |||||
| 10,851 | Intercontinental Exchange, Inc. (Financials) | 1,501,995 | ||||||
| 41,026 | International Business Machines Corp. (Information Technology) | 7,591,041 | ||||||
| 46,253 | International Paper Co. (Materials) | 1,635,506 | ||||||
| 1,760 | Intuit, Inc. (Information Technology) | 1,166,686 | ||||||
| 3,613 | IQVIA Holdings, Inc. (Health Care)* | 892,989 | ||||||
| 8,797 | J M Smucker Co. (The) (Consumer Staples) | 1,057,135 | ||||||
| 17,084 | Johnson Controls International PLC (Industrials) | 1,012,569 | ||||||
| 41,021 | Johnson & Johnson (Health Care) | 6,619,969 | ||||||
| 23,375 | JPMorgan Chase & Co. (Financials) | 4,349,153 | ||||||
| 20,487 | Keurig Dr Pepper, Inc. (Consumer Staples) | 612,766 | ||||||
| 27,965 | Keysight Technologies, Inc. (Information Technology)* | 4,315,000 | ||||||
| 11,756 | Kimberly-Clark Corp. (Consumer Staples) | 1,424,475 | ||||||
| 30,003 | Kinder Morgan, Inc. (Energy) | 521,752 | ||||||
| 17,031 | Kraft Heinz Co. (The) (Consumer Staples) | 600,854 | ||||||
| 68,040 | Kroger Co. (The) (Consumer Staples) | 3,375,464 | ||||||
| 3,592 | L3Harris Technologies, Inc. (Industrials) | 760,283 | ||||||
| 9,801 | Laboratory Corp. of America Holdings (Health Care) | 2,115,350 | ||||||
| 5,902 | Leidos Holdings, Inc. (Industrials) | 754,630 | ||||||
| 3,738 | Linde PLC (Materials) | 1,677,689 | ||||||
| 53,293 | LKQ Corp. (Consumer Discretionary) | 2,786,691 | ||||||
| 1,483 | Lockheed Martin Corp. (Industrials) | 635,080 | ||||||
| 38,916 | Loews Corp. (Financials) | 2,923,759 | ||||||
| 25,828 | Lowe’s Cos., Inc. (Consumer Discretionary) | 6,216,025 | ||||||
| 19,848 | LyondellBasell Industries NV, Class A (Materials) | 1,990,357 | ||||||
| 948 | Markel Group, Inc. (Financials)* | 1,414,871 | ||||||
| 667 | Marriott International, Inc., Class A (Consumer Discretionary) | 166,663 | ||||||
| 28,764 | Marsh & McLennan Cos., Inc. (Financials) | 5,818,094 | ||||||
| 57,745 | Masco Corp. (Industrials) | 4,432,506 | ||||||
| 13,316 | Mastercard, Inc., Class A (Financials) | 6,321,904 | ||||||
| 90 | The accompanying notes are an integral part of these financial statements. |
GOLDMAN SACHS ACTIVEBETA® WORLD LOW VOL PLUS EQUITY ETF
| Shares | Description | Value | ||||||
| Common Stocks – (continued) | ||||||||
| United States – (continued) | ||||||||
| 19,419 | McDonald’s Corp. (Consumer Discretionary) | $ | 5,675,785 | |||||
| 9,415 | McKesson Corp. (Health Care) | 4,909,075 | ||||||
| 43,931 | Merck & Co., Inc. (Health Care) | 5,585,827 | ||||||
| 16,355 | Meta Platforms, Inc., Class A (Communication Services) | 8,016,076 | ||||||
| 1,381 | MetLife, Inc. (Financials) | 96,311 | ||||||
| 58,688 | Microsoft Corp. (Information Technology) | 24,275,704 | ||||||
| 47,093 | Mondelez International, Inc., Class A (Consumer Staples) | 3,441,086 | ||||||
| 4,503 | Monster Beverage Corp. (Consumer Staples)* | 266,127 | ||||||
| 11,292 | Moody’s Corp. (Financials) | 4,284,411 | ||||||
| 20,270 | Motorola Solutions, Inc. (Information Technology) | 6,697,005 | ||||||
| 10,104 | Nasdaq, Inc. (Financials) | 567,845 | ||||||
| 6,380 | Nestle SA (Consumer Staples) | 664,844 | ||||||
| 31,861 | NetApp, Inc. (Information Technology) | 2,839,452 | ||||||
| 4,933 | NiSource, Inc. (Utilities) | 128,554 | ||||||
| 897 | Northrop Grumman Corp. (Industrials) | 413,535 | ||||||
| 10,447 | NVIDIA Corp. (Information Technology) | 8,264,831 | ||||||
| 17,936 | Oracle Corp. (Information Technology) | 2,003,092 | ||||||
| 9,045 | O’Reilly Automotive, Inc. (Consumer Discretionary)* | 9,835,714 | ||||||
| 14,765 | Otis Worldwide Corp. (Industrials) | 1,407,105 | ||||||
| 28,016 | PACCAR, Inc. (Industrials) | 3,106,694 | ||||||
| 6,376 | Packaging Corp. of America (Materials) | 1,155,267 | ||||||
| 11,442 | Paychex, Inc. (Industrials) | 1,403,018 | ||||||
| 37,240 | PepsiCo, Inc. (Consumer Staples) | 6,157,262 | ||||||
| 7,581 | PG&E Corp. (Utilities) | 126,527 | ||||||
| 16,158 | Philip Morris International, Inc. (Consumer Staples) | 1,453,574 | ||||||
| 29,976 | Procter & Gamble Co. (The) (Consumer Staples) | 4,764,385 | ||||||
| 9,539 | Progressive Corp. (The) (Financials) | 1,808,213 | ||||||
| 11,660 | QUALCOMM, Inc. (Information Technology) | 1,839,831 | ||||||
| 10,276 | Quest Diagnostics, Inc. (Health Care) | 1,283,370 | ||||||
| 11,396 | Realty Income Corp. REIT (Real Estate) | 593,846 | ||||||
| 3,154 | Regeneron Pharmaceuticals, Inc. (Health Care)* | 3,047,048 | ||||||
| 23,338 | Republic Services, Inc. (Industrials) | 4,284,857 | ||||||
| 7,839 | Roche Holding AG (Health Care) | 2,064,909 | ||||||
| 6,317 | Roche Holding AG (Health Care) | 1,760,481 | ||||||
| Shares | Description | Value | ||||||
| Common Stocks – (continued) | ||||||||
| United States – (continued) | ||||||||
| 20,311 | Rollins, Inc. (Industrials) | $ | 895,106 | |||||
| 5,903 | Roper Technologies, Inc. (Information Technology) | 3,215,541 | ||||||
| 3,405 | Ross Stores, Inc. (Consumer Discretionary) | 507,209 | ||||||
| 22,286 | Royalty Pharma PLC, Class A (Health Care) | 676,157 | ||||||
| 7,459 | RTX Corp. (Industrials) | 668,849 | ||||||
| 5,503 | Salesforce, Inc. (Information Technology)* | 1,699,436 | ||||||
| 26,506 | Sanofi SA (Health Care) | 2,520,991 | ||||||
| 1,090 | ServiceNow, Inc. (Information Technology)* | 840,761 | ||||||
| 6,057 | Sherwin-Williams Co. (The) (Materials) | 2,011,106 | ||||||
| 3,120 | Snap-on, Inc. (Industrials) | 860,059 | ||||||
| 14,447 | Southern Co. (The) (Utilities) | 971,561 | ||||||
| 34,897 | SS&C Technologies Holdings, Inc. (Industrials) | 2,225,033 | ||||||
| 11,828 | Starbucks Corp. (Consumer Discretionary) | 1,122,477 | ||||||
| 5,037 | Stryker Corp. (Health Care) | 1,758,266 | ||||||
| 14,537 | Swiss Re AG (Financials) | 1,759,859 | ||||||
| 3,737 | Synopsys, Inc. (Information Technology)* | 2,144,029 | ||||||
| 25,058 | Sysco Corp. (Consumer Staples) | 2,028,946 | ||||||
| 9,203 | TE Connectivity Ltd. (Information Technology) | 1,321,183 | ||||||
| 8,534 | Texas Instruments, Inc. (Information Technology) | 1,427,994 | ||||||
| 16,029 | Textron, Inc. (Industrials) | 1,427,703 | ||||||
| 322 | Thermo Fisher Scientific, Inc. (Health Care) | 183,598 | ||||||
| 48,858 | TJX Cos., Inc. (The) (Consumer Discretionary) | 4,843,782 | ||||||
| 2,642 | T-Mobile US, Inc. (Communication Services) | 431,439 | ||||||
| 9,242 | Tractor Supply Co. (Consumer Discretionary) | 2,350,425 | ||||||
| 472 | TransDigm Group, Inc. (Industrials) | 555,893 | ||||||
| 3,317 | Travelers Cos., Inc. (The) (Financials) | 732,924 | ||||||
| 12,564 | UnitedHealth Group, Inc. (Health Care) | 6,201,591 | ||||||
| 19,757 | VeriSign, Inc. (Information Technology)* | 3,858,345 | ||||||
| 4,318 | Verisk Analytics, Inc. (Industrials) | 1,044,524 | ||||||
| 118,093 | Verizon Communications, Inc. (Communication Services) | 4,726,082 | ||||||
| 5,416 | Vertex Pharmaceuticals, Inc. (Health Care)* | 2,278,728 | ||||||
| 21,403 | Visa, Inc., Class A (Financials) | 6,049,344 | ||||||
| 21,202 | W R Berkley Corp. (Financials) | 1,772,487 | ||||||
| 5,592 | W.P. Carey, Inc. REIT (Real Estate) | 314,997 | ||||||
| 6,697 | W.W. Grainger, Inc. (Industrials) | 6,519,262 | ||||||
| The accompanying notes are an integral part of these financial statements. | 91 |
GOLDMAN SACHS ACTIVEBETA® WORLD LOW VOL PLUS EQUITY ETF
|
Schedule of Investments (continued)
February 29, 2024 (Unaudited) |
| Shares | Description | Value | ||||||
| Common Stocks – (continued) | ||||||||
| United States – (continued) | ||||||||
| 149,596 | Walmart, Inc. (Consumer Staples) | $ | 8,767,822 | |||||
| 2,285 | Waste Connections, Inc. (Industrials) | 380,432 | ||||||
| 23,055 | Waste Management, Inc. (Industrials) | 4,741,261 | ||||||
| 10,897 | Welltower, Inc. REIT (Real Estate) | 1,004,268 | ||||||
| 43,850 | Yum! Brands, Inc. (Consumer Discretionary) | 6,069,717 | ||||||
| 1,923 | Zebra Technologies Corp., Class A (Information Technology)* | 537,440 | ||||||
| 9,108 | Zoetis, Inc. (Health Care) | 1,806,390 | ||||||
|
|
|
|||||||
| 584,085,277 | ||||||||
|
|
||||||||
|
TOTAL COMMON STOCKS (Cost $725,645,205) |
828,345,227 | |||||||
|
|
||||||||
| Shares | Description | Rate | Value | |||||||||
| Preferred Stock – 0.1% |
| |||||||||||
| Germany – 0.1% |
| |||||||||||
| 9,303 | Henkel AG & Co. KGaA (Consumer Staples) | |||||||||||
| (Cost $737,718) | 2.66 | % | 700,278 | |||||||||
|
|
||||||||||||
| Shares | Dividend Rate | Value | ||||||||||
| Investment Company – 0.1%(c) |
| |||||||||||
|
Goldman Sachs Financial Square Treasury Obligations Fund - Institutional Shares |
| |||||||||||
| 1,142,885 | 5.260% |
|
1,142,885 | |||||||||
| (Cost $1,142,885) | ||||||||||||
|
|
||||||||||||
|
TOTAL INVESTMENTS BEFORE SECURITIES LENDING REINVESTMENT VEHICLE (Cost $727,525,808) |
830,188,390 | |||||||||||
|
|
||||||||||||
| Shares | Dividend Rate | Value | ||||||
| Securities Lending Reinvestment Vehicle – 0.9%(c) |
| |||||||
| Goldman Sachs Financial Square Government Fund - Institutional Shares |
| |||||||
| 7,167,244 | 5.260% | $ | 7,167,244 | |||||
| (Cost $7,167,244) | ||||||||
|
|
||||||||
|
TOTAL INVESTMENTS – 100.5% (Cost $734,693,052) |
$ | 837,355,634 | ||||||
|
|
||||||||
|
LIABILITIES IN EXCESS OF OTHER ASSETS – (0.5)% |
(4,510,189) | |||||||
|
|
||||||||
| NET ASSETS – 100.0% | $ | 832,845,445 | ||||||
|
|
||||||||
| The percentage shown for each investment category reflects the value of investments in that category as a percentage of net assets. | ||
| * |
Non-income producing security. | |
| (a) |
All or a portion of security is on loan. | |
| (b) |
Exempt from registration under Rule 144A of the Securities Act of 1933. | |
| (c) |
Represents an affiliated issuer. | |
|
| ||
| Investment Abbreviations: | ||
| CVA | —Dutch Certification | |
| PLC | —Public Limited Company | |
| REIT | —Real Estate Investment Trust | |
|
| ||
| Sector Name |
% of Market Value | |||
|
|
||||
|
Information Technology |
22.2% | |||
|
Financials |
16.8 | |||
|
Health Care |
13.5 | |||
|
Industrials |
13.4 | |||
|
Consumer Staples |
11.3 | |||
|
Consumer Discretionary |
10.3 | |||
|
Communication Services |
7.2 | |||
|
Materials |
1.7 | |||
|
Utilities |
1.3 | |||
|
Energy |
0.7 | |||
|
Real Estate |
0.6 | |||
|
Investment Company |
0.1 | |||
|
Securities Lending Reinvestment Vehicle |
0.9 | |||
|
|
||||
|
TOTAL INVESTMENTS |
100.0% | |||
|
|
||||
| 92 | The accompanying notes are an integral part of these financial statements. |
GOLDMAN SACHS ACTIVEBETA® WORLD LOW VOL PLUS EQUITY ETF
|
ADDITIONAL INVESTMENT INFORMATION |
FUTURES CONTRACTS — At February 29, 2024, the Fund had the following futures contracts:
| Description | Number of Contracts |
Expiration Date |
Notional Amount |
Unrealized Appreciation/ (Depreciation) |
||||||||||||
|
|
||||||||||||||||
|
Long position contracts: |
||||||||||||||||
|
E-Mini MSCI EAFE Index Future |
4 | 03/15/24 | $ | 457,580 | $ | 24,418 | ||||||||||
|
S&P 500 E-Mini Index |
5 | 03/15/24 | 1,275,938 | 111,006 | ||||||||||||
|
|
||||||||||||||||
|
Total Futures Contracts |
$ | 135,424 | ||||||||||||||
|
|
||||||||||||||||
| The accompanying notes are an integral part of these financial statements. | 93 |
GOLDMAN SACHS ACTIVEBETA ® ETFS
| ActiveBeta® Emerging Markets Equity ETF |
ActiveBeta® Europe Equity ETF |
ActiveBeta® International Equity ETF |
ActiveBeta® Japan Equity ETF |
|||||||||||||||||
| Assets: | ||||||||||||||||||||
|
Investments in unaffiliated issuers, at value (cost $815,757,778, $9,262,615, $2,907,920,005 and $19,114,941, respectively)(a) |
$ | 943,452,943 | $ | 10,510,535 | $ | 3,511,783,137 | $ | 22,685,871 | ||||||||||||
|
Investments in affiliated issuers, at value (cost $12,595,998, $48,442, $8,698,821 and $48,147, respectively) |
12,595,998 | 48,442 | 8,698,821 | 48,147 | ||||||||||||||||
|
Investments in affiliated securities lending reinvestment vehicle,at value which equals cost |
906,385 | 22,539 | 59,012,449 | 152,374 | ||||||||||||||||
|
Cash |
28,380 | — | — | — | ||||||||||||||||
|
Foreign Currency, at value (cost $9,737,467, $–, $345,401 and $–, respectively) |
9,246,684 | — | 346,518 | — | ||||||||||||||||
|
Receivables: |
||||||||||||||||||||
|
Investments sold |
17,743,203 | 248,633 | 107,201,651 | 927,258 | ||||||||||||||||
|
Dividends |
2,240,027 | 10,241 | 5,074,259 | 26,883 | ||||||||||||||||
|
Foreign tax reclaims |
116,881 | 27,330 | 4,435,181 | 1,795 | ||||||||||||||||
|
Reimbursement from investment adviser |
48,577 | — | — | — | ||||||||||||||||
|
Securities lending income |
5,293 | 6 | 28,394 | 7 | ||||||||||||||||
|
Due from broker |
— | — | 297,400 | — | ||||||||||||||||
|
Collateral on certain derivative contracts |
— | 2,348 | — | 2,540 | ||||||||||||||||
|
Variation margin on futures contracts |
— | 2,413 | 139,975 | 317 | ||||||||||||||||
|
Other assets |
282,172 | — | — | — | ||||||||||||||||
|
| ||||||||||||||||||||
|
Total assets |
986,666,543 | 10,872,487 | 3,697,017,785 | 23,845,192 | ||||||||||||||||
|
| ||||||||||||||||||||
| Liabilities: | ||||||||||||||||||||
|
Payables: |
||||||||||||||||||||
|
Investments purchased |
32,832,080 | 292,849 | 113,458,863 | 928,920 | ||||||||||||||||
|
Foreign capital gains taxes |
7,288,122 | — | — | — | ||||||||||||||||
|
Payable upon return of securities loaned |
906,385 | 22,539 | 59,012,449 | 152,374 | ||||||||||||||||
|
Management fees |
295,406 | 2,047 | 684,356 | 3,382 | ||||||||||||||||
|
Due to custodian |
— | 120 | 37,873 | 273 | ||||||||||||||||
|
Foreign bank overdraft (cost $–, $165, $– and $115, respectively) |
— | 171 | — | 116 | ||||||||||||||||
|
Accrued expenses |
654,390 | — | — | — | ||||||||||||||||
|
| ||||||||||||||||||||
|
Total liabilities |
41,976,383 | 317,726 | 173,193,541 | 1,085,065 | ||||||||||||||||
|
| ||||||||||||||||||||
|
Commitments and contingencies |
||||||||||||||||||||
| Net Assets: | ||||||||||||||||||||
|
Paid-in capital |
917,506,524 | 12,850,891 | 3,243,389,047 | 21,057,848 | ||||||||||||||||
|
Total distributable earnings (loss) |
27,183,636 | (2,296,130 | ) | 280,435,197 | 1,702,279 | |||||||||||||||
|
| ||||||||||||||||||||
|
NET ASSETS |
$ | 944,690,160 | $ | 10,554,761 | $ | 3,523,824,244 | $ | 22,760,127 | ||||||||||||
|
| ||||||||||||||||||||
|
SHARES ISSUED AND OUTSTANDING |
||||||||||||||||||||
|
Shares outstanding no par value (unlimited shares authorized): |
30,500,000 | 300,000 | 105,700,000 | 600,000 | ||||||||||||||||
|
Net asset value per share: |
$ | 30.97 | $ | 35.18 | $ | 33.34 | $ | 37.93 | ||||||||||||
| (a) |
Includes loaned securities having a market value of $782,142, $20,361, $55,967,358 and $146,197 for ActiveBeta® Emerging Markets Equity ETF, ActiveBeta® Europe Equity ETF, ActiveBeta® International Equity ETF and ActiveBeta® Japan Equity ETF, respectively. |
| 94 | The accompanying notes are an integral part of these financial statements. |