
Mutual
Funds
Thrivent
Mutual Funds
Prospectus
|
Thrivent
Fund Name |
Class
S |
Class
A |
|
Thrivent
Aggressive Allocation Fund |
TAAIX |
TAAAX |
|
Thrivent
Balanced Income Plus Fund |
IBBFX |
AABFX |
|
Thrivent
Diversified Income Plus Fund |
THYFX |
AAHYX |
|
Thrivent
Global Stock Fund |
IILGX |
AALGX |
|
Thrivent
Government Bond Fund |
TBFIX |
TBFAX |
|
Thrivent
High Income Municipal Bond Fund |
THMBX |
– |
|
Thrivent
High Yield Fund |
LBHIX |
LBHYX |
|
Thrivent
Income Fund |
LBIIX |
LUBIX |
|
Thrivent
International Allocation Fund |
TWAIX |
TWAAX |
|
Thrivent
Large Cap Growth Fund |
THLCX |
AAAGX |
|
Thrivent
Large Cap Value Fund |
TLVIX |
AAUTX |
|
Thrivent
Limited Maturity Bond Fund |
THLIX |
LBLAX |
|
Thrivent
Low Volatility Equity Fund |
TLVOX |
– |
|
Thrivent
Mid Cap Growth Fund |
TMCGX |
– |
|
Thrivent
Mid Cap Stock Fund |
TMSIX |
AASCX |
|
Thrivent
Mid Cap Value Fund |
TMCVX |
– |
|
Thrivent
Moderate Allocation Fund |
TMAIX |
THMAX |
|
Thrivent
Moderately Aggressive Allocation Fund |
TMAFX |
TMAAX |
|
Thrivent
Moderately Conservative Allocation Fund |
TCAIX |
TCAAX |
|
Thrivent
Money Market Fund |
AALXX |
AMMXX |
|
Thrivent
Multidimensional Income Fund |
TMLDX |
– |
|
Thrivent
Municipal Bond Fund |
TMBIX |
AAMBX |
|
Thrivent
Opportunity Income Plus Fund |
IIINX |
AAINX |
|
Thrivent
Small Cap Growth Fund |
TSCGX |
– |
|
Thrivent
Small Cap Stock Fund |
TSCSX |
AASMX |
Go
paperless. Manage
your communication choices and sign up for paperless delivery of prospectuses by
logging into
your
account.
The
Securities and Exchange Commission has not approved or disapproved these
securities or determined if this prospectus is truthful or complete. Any
representation to the contrary is a criminal offense. Shares of Thrivent Mutual
Funds are not deposits or other obligations of Thrivent Trust Company or any
bank, or insured or otherwise protected by the Federal Deposit Insurance
Corporation or any other federal agency. Shares of Thrivent Mutual Funds are
subject to investment risk, including possible loss of the principal amount
invested.
Thrivent
Aggressive Allocation Fund
Class
S: TAAIX | Class A: TAAAX
|
|
Class
S |
Class
A |
|
Maximum
Sales Charge (load) Imposed
On
Purchases (as a % of offering price) |
|
|
|
Maximum
Deferred Sales Charge (load)
(as a % of
the net asset value) |
|
|
|
|
Class
S |
Class
A |
|
Management
Fees |
|
|
|
Distribution
and Shareholder Service
(12b-1)
Fees |
|
|
|
Other
Expenses |
|
|
|
Acquired
Fund Fees and Expenses |
|
|
|
Total
Annual Fund Operating Expenses |
|
|
|
Less Fee
Waivers and/or Expense
Reimbursements1 |
|
|
|
Total
Annual Fund Operating Expenses
After Fee
Waivers and/or Expense
Reimbursements |
|
|
1
The Adviser
has contractually agreed, for as long as the current fee structure is in place
and through at least February 28,
2025 , to waive an amount equal to any management
fees indirectly incurred by the Fund as a result of its investment in any other
mutual fund for which the Adviser or an affiliate serves as investment adviser,
other than Thrivent Cash Management Trust. This contractual provision may be
terminated upon the mutual agreement between the Independent Trustees of the
Fund and the Adviser.
|
|
1
Year |
3
Years |
5
Years |
10
Years |
|
Class
S |
$ |
$ |
$ |
$ |
|
Class
A |
$ |
$ |
$ |
$ |
3
|
|
|
|
|
|
| |
|
|
|
|
|
|
|
|
|
|
|
|
|
|
|
|
|
|
|
|
|
|
|
|
|
|
|
|
|
|
|
|
|
|
|
|
|
|
|
|
|
|
|
|
|
|
|
|
|
|
|
|
|
|
|
|
|
|
|
|
|
|
The Fund is
subject to the following principal investment risks, which you should review
carefully and in entirety. The Fund may
not
achieve its investment objective and you could lose money by investing in the
Fund.
4
5

|
|
|
|
|
|
|
|
|
|
1
Year |
5
Years |
10
Years |
|
Class A
(before taxes) |
|
|
|
|
Class A
(after taxes on
distributions) |
|
|
|
|
Class A
(after taxes on
distributions
and
redemptions) |
|
|
|
|
Class S
(before taxes) |
|
|
|
|
S&P
500® Index
(reflects
no deduction for
fees,
expenses or taxes) |
|
|
|
|
Bloomberg
U.S. Aggregate
Bond
Index
(reflects
no deduction for
fees,
expenses or taxes) |
|
|
|
|
MSCI All
Country World Index
ex-USA -
USD Net Returns
(reflects
no deduction for
fees,
expenses or taxes) |
|
|
|
Management
Investment
Adviser
The Fund is
managed by Thrivent Asset Management, LLC (“Thrivent Asset Mgt.” or the
“Adviser”).
Portfolio
Managers
The following
individuals
are jointly and
primarily responsible for the day-to-day management of the Fund:
|
Name
and Title |
Portfolio
Manager
of
the Fund Since |
|
Stephen D.
Lowe, CFA
Chief
Investment Strategist |
April
2016 |
|
David S.
Royal
Chief
Financial Officer and Chief
Investment
Officer |
April
2018 |
|
David R.
Spangler, CFA
Senior
Portfolio Manager |
February
2019 |
Purchase and Sale
of Fund Shares
You may purchase,
redeem or exchange shares of the Fund through certain broker-dealers. You also
may purchase Class S shares of the Fund directly from the Fund online at
thriventfunds.com.
The minimum
initial investment requirement for this Fund is $2,000 and the minimum
subsequent investment requirement is $50 for taxable accounts. For IRA or
tax-deferred accounts, the minimum initial investment requirement for this Fund
is $1,000 and the minimum subsequent investment requirement is $50. These
investment requirements may be different, however, for investors investing in
the Fund through an automatic investment plan or, for Class S shares, through
certain fee-based investment advisory programs.
6
You may purchase
or redeem Fund shares on days that the New York Stock Exchange is open. You may
conduct such transactions by mail, telephone 800-847-4836, the Internet
(thrivent.com or, for Class S shares, thriventfunds.com), the mobile app, by
wire/ACH transfer or through an automatic investment plan (for purchases) or a
systematic withdrawal plan (for redemptions), subject to certain
limitations.
Tax
Information
The Fund intends
to make distributions that may be taxed as ordinary income or capital gains.
Investing in the Fund through a retirement plan could have different tax
consequences.
Payments to
Broker-Dealers and Other Financial Intermediaries
If you purchase
the Fund through a broker-dealer or other financial intermediary (such as an
insurance company), the Fund and its related companies may pay the intermediary
for the sale of Fund shares and related services. These payments may create a
conflict of interest by influencing the broker-dealer or other intermediary and
your financial professional to recommend the Fund over another investment. Ask
your financial professional or visit your financial intermediary’s website for
more information.
7
Thrivent
Balanced Income Plus Fund
Class
S: IBBFX | Class A: AABFX
|
|
Class
S |
Class
A |
|
Maximum
Sales Charge (load) Imposed
On
Purchases (as a % of offering price) |
|
|
|
Maximum
Deferred Sales Charge (load)
(as a % of
the net asset value) |
|
|
|
|
Class
S |
Class
A |
|
Management
Fees |
|
|
|
Distribution
and Shareholder Service
(12b-1)
Fees |
|
|
|
Other
Expenses |
|
|
|
Acquired
Fund Fees and Expenses |
|
|
|
Total
Annual Fund Operating Expenses |
|
|
|
Less Fee
Waivers and/or Expense
Reimbursements1 |
|
|
|
Total
Annual Fund Operating Expenses
After Fee
Waivers and/or Expense
Reimbursements |
|
|
1
The Adviser
has contractually agreed, through at least February 28,
2025 , to waive a portion of the
management fees associated with the Class A shares of the Thrivent
Balanced Income Plus Fund in order to limit the Total Annual Fund Operating
Expenses After Fee Waivers and/or Expense Reimbursements to an annual rate of
0.97% of the average daily net assets of the Class A shares. This contractual
provision, however, may be terminated before the indicated termination date upon
the mutual agreement between the Independent Trustees of the Fund and the
Adviser.
|
|
1
Year |
3
Years |
5
Years |
10
Years |
|
Class
S |
$ |
$ |
$ |
$ |
|
Class
A |
$ |
$ |
$ |
$ |
|
|
|
|
|
|
| |
|
|
|
|
8
The Fund is
subject to the following principal investment risks, which you should review
carefully and in entirety. The Fund may
not
achieve its investment objective and you could lose money by investing in the
Fund.
9
10

|
|
|
|
|
|
|
|
|
|
1
Year |
5
Years |
10
Years |
|
Class A
(before taxes) |
|
|
|
|
Class A
(after taxes on
distributions) |
|
|
|
|
Class A
(after taxes on
distributions
and
redemptions) |
|
|
|
|
Class S
(before taxes) |
|
|
|
|
Bloomberg
U.S.
Mortgage-Backed
Securities
Index
(reflects
no deduction for
fees,
expenses or taxes) |
|
|
|
|
Bloomberg
U.S. High Yield
Ba/B 2%
Issuer Capped
Index
(reflects
no deduction for
fees,
expenses or taxes) |
|
|
|
|
MSCI World
Index - USD Net
Returns
(reflects
no deduction for
fees,
expenses or taxes) |
|
|
|
11
Management
Investment
Adviser
The Fund is
managed by Thrivent Asset Management, LLC (“Thrivent Asset Mgt.” or the
“Adviser”).
Portfolio
Managers
The following individuals are jointly and primarily
responsible for the day-to-day management of the Fund:
|
Name
and Title |
Portfolio
Manager
of
the Fund Since |
|
Stephen D.
Lowe, CFA
Chief
Investment Strategist |
August
2013 |
|
David R.
Spangler, CFA
Senior
Portfolio Manager |
February
2019 |
|
Theron G.
Whitehorn, CFA
Director
of Fixed Income Quantitative
Research |
February
2021 |
Purchase and Sale
of Fund Shares
You may purchase,
redeem or exchange shares of the Fund through certain broker-dealers. You also
may purchase Class S shares of the Fund directly from the Fund online at
thriventfunds.com.
The minimum
initial investment requirement for this Fund is $2,000 and the minimum
subsequent investment requirement is $50 for taxable accounts. For IRA or
tax-deferred accounts, the
minimum initial
investment requirement for this Fund is $1,000 and the minimum subsequent
investment requirement is $50. These investment requirements may be different,
however, for investors investing in the Fund through an automatic investment
plan or, for Class S shares, through certain fee-based investment advisory
programs.
You may purchase
or redeem Fund shares on days that the New York Stock Exchange is open. You may
conduct such transactions by mail, telephone 800-847-4836, the Internet
(thrivent.com or, for Class S shares, thriventfunds.com), the mobile app, by
wire/ACH transfer or through an automatic investment plan (for purchases) or a
systematic withdrawal plan (for redemptions), subject to certain
limitations.
Tax
Information
The Fund intends
to make distributions that may be taxed as ordinary income or capital gains.
Investing in the Fund through a retirement plan could have different tax
consequences.
Payments to
Broker-Dealers and Other Financial Intermediaries
If you purchase
the Fund through a broker-dealer or other financial intermediary (such as an
insurance company), the Fund and its related companies may pay the intermediary
for the sale of Fund shares and related services. These payments may create a
conflict of interest by influencing the broker-dealer or other intermediary and
your financial professional to recommend the Fund over another investment. Ask
your financial professional or visit your financial intermediary’s website for
more information.
12
Thrivent
Diversified Income Plus Fund
Class
S: THYFX | Class A: AAHYX
|
|
Class
S |
Class
A |
|
Maximum
Sales Charge (load) Imposed
On
Purchases (as a % of offering price) |
|
|
|
Maximum
Deferred Sales Charge (load)
(as a % of
the net asset value) |
|
|
|
|
Class
S |
Class
A |
|
Management
Fees |
|
|
|
Distribution
and Shareholder Service
(12b-1)
Fees |
|
|
|
Other
Expenses |
|
|
|
Acquired
Fund Fees and Expenses |
|
|
|
Total
Annual Fund Operating Expenses |
|
|
|
|
1
Year |
3
Years |
5
Years |
10
Years |
|
Class
S |
$ |
$ |
$ |
$ |
|
Class
A |
$ |
$ |
$ |
$ |
|
|
|
|
|
|
| |
|
|
|
|
13
The Fund is
subject to the following principal investment risks, which you should review
carefully and in entirety. The Fund may
not
achieve its investment objective and you could lose money by investing in the
Fund.
14
15

|
|
|
|
|
|
|
|
|
|
1
Year |
5
Years |
10
Years |
|
Class A
(before taxes) |
|
|
|
|
Class A
(after taxes on
distributions) |
|
|
|
|
Class A
(after taxes on
distributions
and
redemptions) |
|
|
|
|
Class S
(before taxes) |
|
|
|
|
Bloomberg
U.S.
Mortgage-Backed
Securities
Index
(reflects
no deduction for
fees,
expenses or taxes) |
|
|
|
|
Bloomberg
U.S. High Yield
Ba/B 2%
Issuer Capped
Index
(reflects
no deduction for
fees,
expenses or taxes) |
|
|
|
|
MSCI World
Index - USD Net
Returns
(reflects
no deduction for
fees,
expenses or taxes) |
|
|
|
Management
Investment
Adviser
The Fund is
managed by Thrivent Asset Management, LLC (“Thrivent Asset Mgt.” or the
“Adviser”).
Portfolio
Managers
The following
individuals
are jointly and
primarily responsible for the day-to-day management of the Fund:
16
|
Name
and Title |
Portfolio
Manager
of
the Fund Since |
|
Stephen D.
Lowe, CFA
Chief
Investment Strategist |
May
2015 |
|
Theron G.
Whitehorn, CFA
Director
of Fixed Income Quantitative
Research |
February
2021 |
|
David R.
Spangler, CFA
Senior
Portfolio Manager |
May
2022 |
Purchase and Sale
of Fund Shares
You may purchase,
redeem or exchange shares of the Fund through certain broker-dealers. You also
may purchase Class S shares of the Fund directly from the Fund online at
thriventfunds.com.
The minimum
initial investment requirement for this Fund is $2,000 and the minimum
subsequent investment requirement is $50 for taxable accounts. For IRA or
tax-deferred accounts, the minimum initial investment requirement for this Fund
is $1,000 and the minimum subsequent investment requirement is $50. These
investment requirements may be different, however, for investors investing in
the Fund through an automatic investment plan or, for Class S shares, through
certain fee-based investment advisory programs.
You may purchase
or redeem Fund shares on days that the New York Stock Exchange is open. You may
conduct such transactions by mail, telephone 800-847-4836, the Internet
(thrivent.com or, for Class S shares, thriventfunds.com), the mobile app, by
wire/ACH transfer or through an automatic investment plan (for purchases) or a
systematic withdrawal plan (for redemptions), subject to certain
limitations.
Tax
Information
The Fund intends
to make distributions that may be taxed as ordinary income or capital gains.
Investing in the Fund through a retirement plan could have different tax
consequences.
Payments to
Broker-Dealers and Other Financial Intermediaries
If you purchase
the Fund through a broker-dealer or other financial intermediary (such as an
insurance company), the Fund and its related companies may pay the intermediary
for the sale of Fund shares and related services. These payments may create a
conflict of interest by influencing the broker-dealer or other intermediary and
your financial professional to recommend the Fund over another investment. Ask
your financial professional or visit your financial intermediary’s website for
more information.
17
Thrivent
Global Stock Fund
Class
S: IILGX | Class A: AALGX
|
|
Class
S |
Class
A |
|
Maximum
Sales Charge (load) Imposed
On
Purchases (as a % of offering price) |
|
|
|
Maximum
Deferred Sales Charge (load)
(as a % of
the net asset value) |
|
|
|
|
Class
S |
Class
A |
|
Management
Fees |
|
|
|
Distribution
and Shareholder Service
(12b-1)
Fees |
|
|
|
Other
Expenses |
|
|
|
Total
Annual Fund Operating Expenses |
|
|
|
|
1
Year |
3
Years |
5
Years |
10
Years |
|
Class
S |
$ |
$ |
$ |
$ |
|
Class
A |
$ |
$ |
$ |
$ |
|
|
|
|
|
|
|
|
|
|
|
|
|
|
|
18
The Fund is
subject to the following principal investment risks, which you should review
carefully and in entirety. The Fund may
not
achieve its investment objective and you could lose money by investing in the
Fund.
19

|
|
|
|
|
|
|
|
20
|
|
1
Year |
5
Years |
10
Years |
|
Class A
(before taxes) |
|
|
|
|
Class A
(after taxes on
distributions) |
|
|
|
|
Class A
(after taxes on
distributions
and
redemptions) |
|
|
|
|
Class S
(before taxes) |
|
|
|
|
MSCI All
Country World Index
- USD Net
Returns
(reflects
no deduction for
fees,
expenses or taxes) |
|
|
|
Management
Investment
Adviser
The Fund is
managed by Thrivent Asset Management, LLC (“Thrivent Asset Mgt.” or the
“Adviser”).
Portfolio
Managers
The following individuals are jointly and primarily
responsible for the day-to-day management of the Fund:
|
Name
and Title |
Portfolio
Manager
of
the Fund Since |
|
Kurt J.
Lauber, CFA
Senior
Portfolio Manager |
March
2013 |
|
Noah J.
Monsen, CFA
Senior
Portfolio Manager |
February
2018 |
|
Lauri A.
Brunner
Senior
Portfolio Manager |
September
2018 |
|
David R.
Spangler, CFA
Senior
Portfolio Manager |
February
2019 |
Purchase and Sale
of Fund Shares
You may purchase,
redeem or exchange shares of the Fund through certain broker-dealers. You also
may purchase Class S shares of the Fund directly from the Fund online at
thriventfunds.com.
The minimum
initial investment requirement for this Fund is $2,000 and the minimum
subsequent investment requirement is $50 for taxable accounts. For IRA or
tax-deferred accounts, the minimum initial investment requirement for this Fund
is $1,000 and the minimum subsequent investment requirement is $50. These
investment requirements may be different, however, for investors investing in
the Fund through an automatic investment plan or, for Class S shares, through
certain fee-based investment advisory programs.
You may purchase
or redeem Fund shares on days that the New York Stock Exchange is open. You may
conduct such transactions by mail, telephone 800-847-4836, the Internet
(thrivent.com or, for Class S shares, thriventfunds.com), the mobile app, by
wire/ACH transfer or through an automatic investment plan (for purchases) or a
systematic withdrawal plan (for redemptions), subject to certain
limitations.
Tax
Information
The Fund intends
to make distributions that may be taxed as ordinary income or capital gains.
Investing in the Fund through a retirement plan could have different tax
consequences.
Payments to
Broker-Dealers and Other Financial Intermediaries
If you purchase
the Fund through a broker-dealer or other financial intermediary (such as an
insurance company), the Fund and its related companies may pay the intermediary
for the sale of Fund shares and related services. These payments may create a
conflict of interest by influencing the broker-dealer or other intermediary and
your financial professional to recommend the Fund over another investment. Ask
your financial professional or visit your financial intermediary’s website for
more information.
21
Thrivent
Government Bond Fund
Class
S: TBFIX | Class A: TBFAX
|
|
Class
S |
Class
A |
|
Maximum
Sales Charge (load) Imposed
On
Purchases (as a % of offering price) |
|
|
|
Maximum
Deferred Sales Charge (load)
(as a % of
the net asset value) |
|
|
|
|
Class
S |
Class
A |
|
Management
Fees |
|
|
|
Distribution
and Shareholder Service
(12b-1)
Fees |
|
|
|
Other
Expenses |
|
|
|
Total
Annual Fund Operating Expenses |
|
|
|
Less Fee
Waivers and/or Expense
Reimbursements1 |
|
|
|
Total
Annual Fund Operating Expenses
After Fee
Waivers and/or Expense
Reimbursements |
|
|
1
The Adviser
has contractually agreed, through at least February 28,
2025 , to waive a portion of the
management fees associated with the Class S and A shares of the
Thrivent Government Bond Fund in order to limit the Total Annual Fund Operating
Expenses After Fee Waivers and/or Expense Reimbursements to an annual rate of
0.52% and 0.80% of the average daily net assets of the Class S and A shares,
respectively. This contractual provision, however, may be terminated before the
indicated termination date upon the mutual agreement between the Independent
Trustees of the Fund and the Adviser.
|
|
1
Year |
3
Years |
5
Years |
10
Years |
|
Class
S |
$ |
$ |
$ |
$ |
|
Class
A |
$ |
$ |
$ |
$ |
22
The Fund is
subject to the following principal investment risks, which you should review
carefully and in entirety. The Fund may
not
achieve its investment objective and you could lose money by investing in the
Fund.
23

|
|
|
|
|
|
|
|
|
|
1
Year |
5
Years |
10
Years |
|
Class A
(before taxes) |
|
|
|
|
Class A
(after taxes on
distributions) |
|
( |
|
|
Class A
(after taxes on
distributions
and
redemptions) |
|
( |
|
|
Class S
(before taxes) |
|
|
|
|
Bloomberg
U.S. Treasury
Index
(reflects
no deduction for
fees,
expenses or taxes) |
|
|
|
|
Bloomberg
U.S. Agency
Index
(reflects
no deduction for
fees,
expenses or taxes) |
|
|
|
Management
Investment
Adviser
The Fund is
managed by Thrivent Asset Management, LLC (“Thrivent Asset Mgt.” or the
“Adviser”).
24
Portfolio
Managers
The following individuals are jointly and primarily
responsible for the day-to-day management of the Fund:
|
Name
and Title |
Portfolio
Manager
of
the Fund Since |
|
Kent L.
White, CFA
Vice
President, Fixed Income Mutual
Funds |
February
2023 |
|
Jon-Paul
(JP) Gagne
Senior
Portfolio Manager |
May
2022 |
Purchase and Sale
of Fund Shares
You may purchase,
redeem or exchange Class S shares of the Fund directly from the Fund online at
thriventfunds.com or through certain broker-dealers.
Class A shares of
Thrivent Government Bond Fund are closed to all purchases and exchanges into the
Fund, other than the reinvestment of dividends by current Class A shareholders
in the Fund.
The minimum
initial investment requirement for Class S shares of this Fund is $2,000 and the
minimum subsequent investment requirement is $50 for taxable accounts. For IRA
or tax-deferred accounts, the minimum initial investment requirement for Class S
shares of this Fund is $1,000 and the minimum subsequent investment requirement
is $50. These investment requirements
may be different,
however, for investors investing in Class S shares of the Fund through an
automatic investment plan or through certain fee-based investment advisory
programs.
You may purchase
or redeem Fund shares on days that the New York Stock Exchange is open. You may
conduct such transactions by mail, telephone 800-847-4836, the Internet
(thrivent.com or, for Class S shares, thriventfunds.com), the mobile app, by
wire/ACH transfer or through an automatic investment plan (for purchases) or a
systematic withdrawal plan (for redemptions), subject to certain
limitations.
Tax
Information
The Fund intends
to make distributions that may be taxed as ordinary income or capital gains.
Investing in the Fund through a retirement plan could have different tax
consequences.
Payments to
Broker-Dealers and Other Financial Intermediaries
If you purchase
the Fund through a broker-dealer or other financial intermediary (such as an
insurance company), the Fund and its related companies may pay the intermediary
for the sale of Fund shares and related services. These payments may create a
conflict of interest by influencing the broker-dealer or other intermediary and
your financial professional to recommend the Fund over another investment. Ask
your financial professional or visit your financial intermediary’s website for
more information.
25
Thrivent
High Income Municipal Bond Fund
Class
S: THMBX
|
|
Class
S |
|
Maximum
Sales Charge (load) Imposed On
Purchases
(as a % of offering price) |
|
|
Maximum
Deferred Sales Charge (load) (as a % of
the net
asset value) |
|
|
|
Class
S |
|
Management
Fees |
|
|
Distribution
and Shareholder Service (12b-1) Fees |
|
|
Other
Expenses |
|
|
Total
Annual Fund Operating Expenses |
|
|
Less Fee
Waivers and/or Expense
Reimbursements1 |
|
|
Total
Annual Fund Operating Expenses After Fee
Waivers
and/or Expense Reimbursements |
|
1
The Adviser
has contractually agreed, through at least February 28,
2025 , to waive a portion of the
management fees associated with the Class S shares of the Thrivent
High Income Municipal Bond Fund in order to limit the Total Annual Fund
Operating Expenses After Fee Waivers and/or Expense Reimbursements to an annual
rate of 0.60% of the average daily net assets of the Class S shares. This
contractual provision, however, may be terminated before the indicated
termination date upon the mutual agreement between the Independent Trustees of
the Fund and the Adviser.
|
|
1
Year |
3
Years |
5
Years |
10
Years |
|
Class
S |
$ |
$ |
$ |
$ |
The Fund is
subject to the following principal investment risks, which you should review
carefully and in entirety. The Fund may
not
achieve its investment objective and you could lose money by investing in the
Fund.
26
27

|
|
|
|
|
|
|
|
|
|
|
|
Since
Inception |
|
|
1
Year |
5
Years |
|
|
Class S
(before taxes) |
|
|
|
|
Class S
(after taxes on
distributions) |
|
|
|
|
Class S
(after taxes on
distributions
and
redemptions) |
|
|
|
|
Bloomberg
65% High Grade/
35% High
Yield Index
(reflects
no deduction for
fees,
expenses or taxes) |
|
|
|
Management
Investment
Adviser
The Fund is
managed by Thrivent Asset Management, LLC (“Thrivent Asset Mgt.” or the
“Adviser”).
Portfolio
Managers
The following individuals are jointly and primarily
responsible for the day-to-day management of the Fund:
|
Name
and Title |
Portfolio
Manager
of
the Fund Since |
|
Johan Å.
Åkesson, CFA
Senior
Portfolio Manager |
February
2018 |
|
Stephanie
L. Woeppel
Senior
Portfolio Manager |
February
2023 |
Purchase and Sale
of Fund Shares
You may purchase,
redeem or exchange shares of the Fund directly from the Fund or through certain
broker-dealers.
The minimum
initial investment requirement for this Fund is $2,000 and the minimum
subsequent investment requirement is $50 for taxable accounts. For IRA or
tax-deferred accounts, the minimum initial investment requirement for this Fund
is $1,000 and the minimum subsequent investment requirement is $50. These
investment requirements may be different, however, for investors investing in
the Fund through an automatic investment plan or through certain fee-based
investment advisory programs.
You may purchase
or redeem Fund shares on days that the New York Stock Exchange is open. You may
conduct such transactions by mail, telephone 800-847-4836, the Internet
(thrivent.com or thriventfunds.com), the mobile app, by wire/ACH transfer or
through an automatic investment plan (for purchases) or a systematic withdrawal
plan (for redemptions), subject to certain limitations.
Tax
Information
The Fund generally
intends to distribute tax-exempt income, although it may also make distributions
that are taxed as ordinary income or capital gains. Investing in the Fund
through a retirement plan could have different tax
consequences.
Payments to
Broker-Dealers and Other Financial Intermediaries
If you purchase
the Fund through a broker-dealer or other financial intermediary (such as an
insurance company), the Fund and its related companies may pay the intermediary
for the sale of Fund shares and related services. These payments may create a
conflict of interest by influencing the broker-dealer or other intermediary and
your financial professional to recommend the Fund over another investment. Ask
your financial professional or visit your financial intermediary’s website for
more information.
28
Thrivent
High Yield Fund
Class
S: LBHIX | Class A: LBHYX
|
|
Class
S |
Class
A |
|
Maximum
Sales Charge (load) Imposed
On
Purchases (as a % of offering price) |
|
|
|
Maximum
Deferred Sales Charge (load)
(as a % of
the net asset value) |
|
|
|
|
Class
S |
Class
A |
|
Management
Fees |
|
|
|
Distribution
and Shareholder Service
(12b-1)
Fees |
|
|
|
Other
Expenses |
|
|
|
Acquired
Fund Fees and Expenses |
|
|
|
Total
Annual Fund Operating Expenses |
|
|
|
|
1
Year |
3
Years |
5
Years |
10
Years |
|
Class
S |
$ |
$ |
$ |
$ |
|
Class
A |
$ |
$ |
$ |
$ |
The Fund is
subject to the following principal investment risks, which you should review
carefully and in entirety. The Fund may
not
achieve its investment objective and you could lose money by investing in the
Fund.
29
30

|
|
|
|
|
|
|
|
|
|
1
Year |
5
Years |
10
Years |
|
Class A
(before taxes) |
|
|
|
|
Class A
(after taxes on
distributions) |
|
|
|
|
Class A
(after taxes on
distributions
and
redemptions) |
|
|
|
|
Class S
(before taxes) |
|
|
|
|
Bloomberg
U.S. Corporate
High Yield
Bond Index
(reflects
no deduction for
fees,
expenses or taxes) |
|
|
|
Management
Investment
Adviser
The Fund is
managed by Thrivent Asset Management, LLC (“Thrivent Asset Mgt.” or the
“Adviser”).
Portfolio
Managers
The following
individuals
are
jointly and primarily
responsible for the day-to-day management of the Fund:
|
Name
and Title |
Portfolio
Manager
of
the Fund Since |
|
Paul J.
Ocenasek, CFA
Senior
Portfolio Manager |
December
1997 |
|
Paul S.
Tommerdahl, CFA
Director,
High Yield Research |
April
2023
|
31
Purchase and Sale
of Fund Shares
You may purchase,
redeem or exchange shares of the Fund through certain broker-dealers. You also
may purchase Class S shares of the Fund directly from the Fund online at
thriventfunds.com.
The minimum
initial investment requirement for this Fund is $2,000 and the minimum
subsequent investment requirement is $50 for taxable accounts. For IRA or
tax-deferred accounts, the minimum initial investment requirement for this Fund
is $1,000 and the minimum subsequent investment requirement is $50. These
investment requirements may be different, however, for investors investing in
the Fund through an automatic investment plan or, for Class S shares, through
certain fee-based investment advisory programs.
You may purchase
or redeem Fund shares on days that the New York Stock Exchange is open. You may
conduct such transactions by mail, telephone 800-847-4836, the Internet
(thrivent.com or, for Class S shares, thriventfunds.com), the mobile app, by
wire/ACH transfer or through an automatic
investment plan
(for purchases) or a systematic withdrawal plan (for redemptions), subject to
certain limitations.
Tax
Information
The Fund intends
to make distributions that may be taxed as ordinary income or capital gains.
Investing in the Fund through a retirement plan could have different tax
consequences.
Payments to
Broker-Dealers and Other Financial Intermediaries
If you purchase
the Fund through a broker-dealer or other financial intermediary (such as an
insurance company), the Fund and its related companies may pay the intermediary
for the sale of Fund shares and related services. These payments may create a
conflict of interest by influencing the broker-dealer or other intermediary and
your financial professional to recommend the Fund over another investment. Ask
your financial professional or visit your financial intermediary’s website for
more information.
32
Thrivent
Income Fund
Class
S: LBIIX | Class A: LUBIX
|
|
Class
S |
Class
A |
|
Maximum
Sales Charge (load) Imposed
On
Purchases (as a % of offering price) |
|
|
|
Maximum
Deferred Sales Charge (load)
(as a % of
the net asset value) |
|
|
|
|
Class
S |
Class
A |
|
Management
Fees |
|
|
|
Distribution
and Shareholder Service
(12b-1)
Fees |
|
|
|
Other
Expenses |
|
|
|
Total
Annual Fund Operating Expenses |
|
|
|
|
1
Year |
3
Years |
5
Years |
10
Years |
|
Class
S |
$ |
$ |
$ |
$ |
|
Class
A |
$ |
$ |
$ |
$ |
33
The Fund is
subject to the following principal investment risks, which you should review
carefully and in entirety. The Fund may
not
achieve its investment objectives and you could lose money by investing in the
Fund.
34
35

|
|
|
|
|
|
|
|
|
|
1
Year |
5
Years |
10
Years |
|
Class A
(before taxes) |
|
|
|
|
Class A
(after taxes on
distributions) |
|
|
|
|
Class A
(after taxes on
distributions
and
redemptions) |
|
|
|
|
Class S
(before taxes) |
|
|
|
|
Bloomberg
U.S. Corporate
Bond
Index
(reflects
no deduction for
fees,
expenses or taxes) |
|
|
|
Management
Investment
Adviser
The Fund is
managed by Thrivent Asset Management, LLC (“Thrivent Asset Mgt.” or the
“Adviser”).
Portfolio
Managers
The following
individuals
are jointly and
primarily responsible for the day-to-day management of the Fund:
|
Name
and Title |
Portfolio
Manager
of
the Fund Since |
|
Kent L.
White, CFA
Vice
President, Fixed Income Mutual
Funds |
June
2017 |
|
Cortney L.
Swensen, CFA
Senior
Portfolio Manager |
February
2023 |
Purchase and Sale
of Fund Shares
You may purchase,
redeem or exchange shares of the Fund through certain broker-dealers. You also
may purchase Class S shares of the Fund directly from the Fund online at
thriventfunds.com.
The minimum
initial investment requirement for this Fund is $2,000 and the minimum
subsequent investment requirement is $50 for taxable accounts. For IRA or
tax-deferred accounts, the minimum initial investment requirement for this Fund
is $1,000 and the minimum subsequent investment requirement is $50. These
investment requirements may be different, however, for investors investing in
the Fund through an automatic investment plan or, for Class S shares, through
certain fee-based investment advisory programs.
You may purchase
or redeem Fund shares on days that the New York Stock Exchange is open. You may
conduct such transactions by mail, telephone 800-847-4836, the Internet
(thrivent.com or, for Class S shares, thriventfunds.com), the mobile app, by
wire/ACH transfer or through an automatic investment plan (for purchases) or a
systematic withdrawal plan (for redemptions), subject to certain
limitations.
Tax
Information
The Fund intends
to make distributions that may be taxed as ordinary income or capital gains.
Investing in the Fund through a retirement plan could have different tax
consequences.
Payments to
Broker-Dealers and Other Financial Intermediaries
If you purchase
the Fund through a broker-dealer or other financial intermediary (such as an
insurance company), the Fund and its related companies may pay the intermediary
for the sale of Fund shares and related services. These payments may create a
conflict of interest by influencing the broker-dealer or other intermediary and
your financial professional to recommend the Fund over another investment. Ask
your financial professional or visit your financial intermediary’s website for
more information.
36
Thrivent
International Allocation Fund
Class
S: TWAIX | Class A: TWAAX
|
|
Class
S |
Class
A |
|
Maximum
Sales Charge (load) Imposed
On
Purchases (as a % of offering price) |
|
|
|
Maximum
Deferred Sales Charge (load)
(as a % of
the net asset value) |
|
|
|
|
Class
S |
Class
A |
|
Management
Fees |
|
|
|
Distribution
and Shareholder Service
(12b-1)
Fees |
|
|
|
Other
Expenses |
|
|
|
Total
Annual Fund Operating Expenses |
|
|
|
Less Fee
Waivers and/or Expense
Reimbursements1
|
|
|
|
Total
Annual Fund Operating Expenses
After Fee
Waivers and/or Expense
Reimbursements |
|
|
1
The Adviser
has contractually agreed, through at least February 28,
2025 , to waive a portion of the
management fees associated with the Class A shares of the Thrivent
International Allocation Fund in order to limit the Total Annual Fund Operating
Expenses After Fee Waivers and/or Expense Reimbursements to an annual rate of
1.17% of the average daily net assets of the Class A shares. This contractual
provision, however, may be terminated before the indicated termination date upon
the mutual agreement between the Independent Trustees of the Fund and the
Adviser.
|
|
1
Year |
3
Years |
5
Years |
10
Years |
|
Class
S |
$ |
$ |
$ |
$ |
|
Class
A |
$ |
$ |
$ |
$ |
|
|
|
|
|
|
|
|
|
|
|
|
37
The Fund is
subject to the following principal investment risks, which you should review
carefully and in entirety. The Fund may
not
achieve its investment objective and you could lose money by investing in the
Fund.
38

|
|
|
|
|
|
|
|
39
|
|
1
Year |
5
Years |
10
Years |
|
Class A
(before taxes) |
|
|
|
|
Class A
(after taxes on
distributions) |
|
|
|
|
Class A
(after taxes on
distributions
and
redemptions) |
|
|
|
|
Class S
(before taxes) |
|
|
|
|
MSCI All
Country World Index
ex-USA -
USD Net Returns
(reflects
no deduction for
fees,
expenses or taxes) |
|
|
|
Management
Investment
Adviser
The Fund is managed by Thrivent
Asset Management, LLC (“Thrivent Asset Mgt.” or the
“Adviser”).
Portfolio
Managers
The following individuals are
jointly and primarily responsible for the day-to-day management of the
Fund:
|
Name
and Title |
Portfolio
Manager
of
the Fund Since |
|
Noah J.
Monsen, CFA
Senior
Portfolio Manager |
February
2016 |
|
Brian W.
Bomgren, CQF
Senior
Portfolio Manager |
February
2016 |
|
Jing Wang,
CFA
Senior
Portfolio Manager |
April
2023 |
|
Shu
Guo
Senior
Portfolio Manager |
February
2024 |
Purchase and Sale
of Fund Shares
You may purchase,
redeem or exchange shares of the Fund through certain broker-dealers. You also
may purchase Class S shares of the Fund directly from the Fund online at
thriventfunds.com.
The minimum
initial investment requirement for this Fund is $2,000 and the minimum
subsequent investment requirement is $50 for taxable accounts. For IRA or
tax-deferred accounts, the minimum initial investment requirement for this Fund
is $1,000 and the minimum subsequent investment requirement is $50. These
investment requirements may be different, however, for investors investing in
the Fund through an automatic investment plan or, for Class S shares, through
certain fee-based investment advisory programs.
You may purchase
or redeem Fund shares on days that the New York Stock Exchange is open. You may
conduct such transactions by mail, telephone 800-847-4836, the Internet
(thrivent.com or, for Class S shares, thriventfunds.com), the mobile app, by
wire/ACH transfer or through an automatic investment plan (for purchases) or a
systematic withdrawal plan (for redemptions), subject to certain
limitations.
Tax
Information
The Fund intends
to make distributions that may be taxed as ordinary income or capital gains.
Investing in the Fund through a retirement plan could have different tax
consequences.
Payments to
Broker-Dealers and Other Financial Intermediaries
If you purchase
the Fund through a broker-dealer or other financial intermediary (such as an
insurance company), the Fund and its related companies may pay the intermediary
for the sale of Fund shares and related services. These payments may create a
conflict of interest by influencing the broker-dealer or other intermediary and
your financial professional to recommend the Fund over another investment. Ask
your financial professional or visit your financial intermediary’s website for
more information.
40
Thrivent
Large Cap Growth Fund
Class
S: THLCX | Class A: AAAGX
|
|
Class
S |
Class
A |
|
Maximum
Sales Charge (load) Imposed
On
Purchases (as a % of offering price) |
|
|
|
Maximum
Deferred Sales Charge (load)
(as a % of
the net asset value) |
|
|
|
|
Class
S |
Class
A |
|
Management
Fees |
|
|
|
Distribution
and Shareholder Service
(12b-1)
Fees |
|
|
|
Other
Expenses |
|
|
|
Total
Annual Fund Operating Expenses |
|
|
|
Less Fee
Waivers and/or Expense
Reimbursements1 |
|
|
|
Total
Annual Fund Operating Expenses
After Fee
Waivers and/or Expense
Reimbursements |
|
|
1
The Adviser
has contractually agreed, through at least February 28,
2025 , to waive a portion of the
management fees associated with the Class A shares of the Thrivent
Large Cap Growth Fund in order to limit the Total Annual Fund Operating Expenses
After Fee Waivers and/or Expense Reimbursements to an annual rate of 1.04% of
the average daily net assets of the Class A shares. This contractual provision,
however, may be terminated before the indicated termination date upon the mutual
agreement between the Independent Trustees of the Fund and the
Adviser.
|
|
1
Year |
3
Years |
5
Years |
10
Years |
|
Class
S |
$ |
$ |
$ |
$ |
|
Class
A |
$ |
$ |
$ |
$ |
41
The Fund is
subject to the following principal investment risks, which you should review
carefully and in entirety. The Fund may
not
achieve its investment objective and you could lose money by investing in the
Fund.
42

|
|
|
|
|
|
|
|
|
|
1
Year |
5
Years |
10
Years |
|
Class A
(before taxes) |
|
|
|
|
Class A
(after taxes on
distributions) |
|
|
|
|
Class A
(after taxes on
distributions
and
redemptions) |
|
|
|
|
Class S
(before taxes) |
|
|
|
|
Russell
1000® Growth Index
(reflects
no deduction for
fees,
expenses or taxes) |
|
|
|
|
S&P
500® Growth Index
(reflects
no deduction for
fees,
expenses or taxes) |
|
|
|
Management
Investment
Adviser
The Fund is
managed by Thrivent Asset Management, LLC (“Thrivent Asset Mgt.” or the
“Adviser”).
Portfolio
Managers
The following individuals are jointly and primarily
responsible for the day-to-day management of the Fund:
|
Name
and Title |
Portfolio
Manager
of
the Fund Since |
|
Lauri A.
Brunner
Senior
Portfolio Manager |
September
2018 |
|
Jaimin
Soni
Senior
Portfolio Manager |
February
2022 |
Purchase and Sale
of Fund Shares
You may purchase,
redeem or exchange shares of the Fund through certain broker-dealers. You also
may purchase Class S shares of the Fund directly from the Fund online at
thriventfunds.com.
The minimum
initial investment requirement for this Fund is $2,000 and the minimum
subsequent investment requirement is $50 for taxable accounts. For IRA or
tax-deferred accounts, the minimum initial investment requirement for this Fund
is $1,000 and the minimum subsequent investment requirement is $50. These
investment requirements may be different, however, for investors investing in
the Fund through an automatic investment plan or, for Class S shares, through
certain fee-based investment advisory programs.
You may purchase
or redeem Fund shares on days that the New York Stock Exchange is open. You may
conduct such transactions by mail, telephone 800-847-4836, the Internet
(thrivent.com or, for Class S shares, thriventfunds.com), the mobile app, by
wire/ACH transfer or through an automatic investment plan (for purchases) or a
systematic withdrawal plan (for redemptions), subject to certain
limitations.
Tax
Information
The Fund intends
to make distributions that may be taxed as ordinary income or capital gains.
Investing in the Fund through a retirement plan could have different tax
consequences.
Payments to
Broker-Dealers and Other Financial Intermediaries
If you purchase
the Fund through a broker-dealer or other financial intermediary (such as an
insurance company), the Fund and its related companies may pay the intermediary
for the sale of Fund shares and related services. These payments may create a
conflict of interest by influencing the broker-dealer or other intermediary and
your financial professional to recommend the Fund over another investment. Ask
your financial professional or visit your financial intermediary’s website for
more information.
43
Thrivent
Large Cap Value Fund
Class
S: TLVIX | Class A: AAUTX
|
|
Class
S |
Class
A |
|
Maximum
Sales Charge (load) Imposed
On
Purchases (as a % of offering price) |
|
|
|
Maximum
Deferred Sales Charge (load)
(as a % of
the net asset value) |
|
|
|
|
Class
S |
Class
A |
|
Management
Fees |
|
|
|
Distribution
and Shareholder Service
(12b-1)
Fees |
|
|
|
Other
Expenses |
|
|
|
Total
Annual Fund Operating Expenses |
|
|
|
|
1
Year |
3
Years |
5
Years |
10
Years |
|
Class
S |
$ |
$ |
$ |
$ |
|
Class
A |
$ |
$ |
$ |
$ |
The Fund is
subject to the following principal investment risks, which you should review
carefully and in entirety. The Fund may
not
achieve its investment objective and you could lose money by investing in the
Fund.
44

|
|
|
|
|
|
|
|
45
|
|
1
Year |
5
Years |
10
Years |
|
Class A
(before taxes) |
|
|
|
|
Class A
(after taxes on
distributions) |
|
|
|
|
Class A
(after taxes on
distributions
and
redemptions) |
|
|
|
|
Class S
(before taxes) |
|
|
|
|
Russell
1000® Value Index
(reflects
no deduction for
fees,
expenses or taxes) |
|
|
|
|
S&P
500® Value Index
(reflects
no deduction for
fees,
expenses or taxes) |
|
|
|
Management
Investment
Adviser
The Fund is
managed by Thrivent Asset Management, LLC (“Thrivent Asset Mgt.” or the
“Adviser”).
Portfolio
Managers
The following individuals are jointly and primarily
responsible for the day-to-day management of the Fund:
|
Name
and Title |
Portfolio
Manager
of
the Fund Since |
|
Kurt J.
Lauber, CFA
Senior
Portfolio Manager |
March
2013 |
|
Thomas C.
Lieu, CFA
Senior
Portfolio Manager |
February
2022 |
Purchase and Sale
of Fund Shares
You may purchase,
redeem or exchange shares of the Fund through certain broker-dealers. You also
may purchase Class S shares of the Fund directly from the Fund online at
thriventfunds.com.
The minimum
initial investment requirement for this Fund is $2,000 and the minimum
subsequent investment requirement is $50 for taxable accounts. For IRA or
tax-deferred accounts, the minimum initial investment requirement for this Fund
is $1,000 and the minimum subsequent investment requirement is $50. These
investment requirements may be different, however, for investors investing in
the Fund through an automatic investment plan or, for Class S shares, through
certain fee-based investment advisory programs.
You may purchase
or redeem Fund shares on days that the New York Stock Exchange is open. You may
conduct such transactions by mail, telephone 800-847-4836, the Internet
(thrivent.com or, for Class S shares, thriventfunds.com), the mobile app, by
wire/ACH transfer or through an automatic investment plan (for purchases) or a
systematic withdrawal plan (for redemptions), subject to certain
limitations.
Tax
Information
The Fund intends
to make distributions that may be taxed as ordinary income or capital gains.
Investing in the Fund through a retirement plan could have different tax
consequences.
Payments to
Broker-Dealers and Other Financial Intermediaries
If you purchase
the Fund through a broker-dealer or other financial intermediary (such as an
insurance company), the Fund and its related companies may pay the intermediary
for the sale of Fund shares and related services. These payments may create a
conflict of interest by influencing the broker-dealer or other intermediary and
your financial professional to recommend the Fund over another investment. Ask
your financial professional or visit your financial intermediary’s website for
more information.
46
Thrivent
Limited Maturity Bond Fund
Class
S: THLIX | Class A: LBLAX
|
|
Class
S |
Class
A |
|
Maximum
Sales Charge (load) Imposed
On
Purchases (as a % of offering price) |
|
|
|
Maximum
Deferred Sales Charge (load)
(as a % of
the net asset value) |
|
|
|
|
Class
S |
Class
A |
|
Management
Fees |
|
|
|
Distribution
and Shareholder Service
(12b-1)
Fees |
|
|
|
Other
Expenses |
|
|
|
Total
Annual Fund Operating Expenses |
|
|
|
|
1
Year |
3
Years |
5
Years |
10
Years |
|
Class
S |
$ |
$ |
$ |
$ |
|
Class
A |
$ |
$ |
$ |
$ |
The Fund is
subject to the following principal investment risks, which you should review
carefully and in entirety. The Fund may
not
achieve its investment objective and you could lose money by investing in the
Fund.
47
48

|
|
|
|
|
|
|
|
|
|
1
Year |
5
Years |
10
Years |
|
Class A
(before taxes) |
|
|
|
|
Class A
(after taxes on
distributions) |
|
|
|
|
Class A
(after taxes on
distributions
and
redemptions) |
|
|
|
|
Class S
(before taxes) |
|
|
|
|
Bloomberg
Government/
Credit 1-3
Year Bond Index
(reflects
no deduction for
fees,
expenses or taxes) |
|
|
|
Management
Investment
Adviser
The Fund is
managed by Thrivent Asset Management, LLC (“Thrivent Asset Mgt.” or the
“Adviser”).
Portfolio
Managers
The following individuals are jointly and primarily
responsible for the day-to-day management of the Fund:
|
Name
and Title |
Portfolio
Manager
of
the Fund Since |
|
Cortney L.
Swensen, CFA
Senior
Portfolio Manager |
February
2020 |
|
Jon-Paul
(JP) Gagne
Senior
Portfolio Manager |
February
2021 |
Purchase and Sale
of Fund Shares
You may purchase,
redeem or exchange shares of the Fund through certain broker-dealers. You also
may purchase Class S shares of the Fund directly from the Fund online at
thriventfunds.com.
The minimum
initial investment requirement for this Fund is $2,000 and the minimum
subsequent investment requirement is $50 for taxable accounts. For IRA or
tax-deferred accounts, the minimum initial investment requirement for this Fund
is $1,000 and the minimum subsequent investment requirement is $50. These
investment requirements may be different, however, for investors investing in
the Fund through an automatic investment plan or, for Class S shares, through
certain fee-based investment advisory programs.
You may purchase
or redeem Fund shares on days that the New York Stock Exchange is open. You may
conduct such transactions by mail, telephone 800-847-4836, the Internet
(thrivent.com or, for Class S shares, thriventfunds.com), the mobile app, by
wire/ACH transfer or through an automatic investment plan (for purchases) or a
systematic withdrawal plan (for redemptions), subject to certain
limitations.
Tax
Information
The Fund intends
to make distributions that may be taxed as ordinary income or capital gains.
Investing in the Fund through a retirement plan could have different tax
consequences.
49
Payments to
Broker-Dealers and Other Financial Intermediaries
If you purchase
the Fund through a broker-dealer or other financial intermediary (such as an
insurance company), the Fund and its related companies may pay the intermediary
for the sale
of Fund shares and
related services. These payments may create a conflict of interest by
influencing the broker-dealer or other intermediary and your financial
professional to recommend the Fund over another investment. Ask your financial
professional or visit your financial intermediary’s website for more
information.
50
Thrivent
Low Volatility Equity Fund
Class
S: TLVOX
|
|
Class
S |
|
Maximum
Sales Charge (load) Imposed On
Purchases
(as a % of offering price) |
|
|
Maximum
Deferred Sales Charge (load) (as a % of
the net
asset value) |
|
|
|
Class
S |
|
Management
Fees |
|
|
Distribution
and Shareholder Service (12b-1) Fees |
|
|
Other
Expenses |
|
|
Total
Annual Fund Operating Expenses |
|
|
Less Fee
Waivers and/or Expense
Reimbursements1 |
|
|
Total
Annual Fund Operating Expenses After Fee
Waivers
and/or Expense Reimbursements |
|
1
The Adviser
has contractually agreed, through at least February 28,
2025 , to waive a portion of the
management fees associated with the Class S shares of the Thrivent Low
Volatility Equity Fund in order to limit the Total Annual Fund Operating
Expenses After Fee Waivers and/or Expense Reimbursements to an annual rate of
0.95% of the average daily net assets of the Class S shares. This contractual
provision, however, may be terminated before the indicated termination date upon
the mutual agreement between the Independent Trustees of the Fund and the
Adviser.
|
|
1
Year |
3
Years |
5
Years |
10
Years |
|
Class
S |
$ |
$ |
$ |
$ |
51
The Fund is
subject to the following principal investment risks, which you should review
carefully and in entirety. The Fund may
not
achieve its investment objective and you could lose money by investing in the
Fund.
52

|
|
|
|
|
|
|
|
|
|
|
|
Since
Inception |
|
|
1
Year |
5
Years |
|
|
Class S
(before taxes) |
|
|
|
|
Class S
(after taxes on
distributions) |
|
|
|
|
Class S
(after taxes on
distributions
and
redemptions) |
|
|
|
|
MSCI World
Minimum
Volatility
Index - USD Net
Returns
(reflects
no deduction for
fees,
expenses or taxes) |
|
|
|
Management
Investment
Adviser
The Fund is
managed by Thrivent Asset Management, LLC (“Thrivent Asset Mgt.” or the
“Adviser”).
Portfolio
Managers
The following
individuals
are jointly and
primarily responsible for the day-to-day management of the Fund:
|
Name
and Title |
Portfolio
Manager
of
the Fund Since |
|
Noah J.
Monsen, CFA
Senior
Portfolio Manager |
February
2017 |
|
Brian W.
Bomgren, CQF
Senior
Portfolio Manager |
February
2018 |
|
Jing Wang,
CFA
Senior
Portfolio Manager |
February
2023 |
Purchase and Sale
of Fund Shares
You may purchase,
redeem or exchange shares of the Fund directly from the Fund or through certain
broker-dealers.
The minimum
initial investment requirement for this Fund is $2,000 and the minimum
subsequent investment requirement is $50 for taxable accounts. For IRA or
tax-deferred accounts, the minimum initial investment requirement for this Fund
is $1,000 and the minimum subsequent investment requirement is $50. These
investment requirements may be different, however, for investors investing in
the Fund through an automatic investment plan or through certain fee-based
investment advisory programs.
You may purchase
or redeem Fund shares on days that the New York Stock Exchange is open. You may
conduct such transactions by mail, telephone 800-847-4836, the Internet
(thrivent.com or thriventfunds.com), the mobile app, by wire/ACH transfer or
through an automatic investment plan (for purchases) or a systematic withdrawal
plan (for redemptions), subject to certain limitations.
53
Tax
Information
The Fund intends
to make distributions that may be taxed as ordinary income or capital gains.
Investing in the Fund through a retirement plan could have different tax
consequences.
Payments to
Broker-Dealers and Other Financial Intermediaries
If you purchase
the Fund through a broker-dealer or other financial intermediary (such as an
insurance company), the Fund and its related companies may pay the intermediary
for the sale
of Fund shares and
related services. These payments may create a conflict of interest by
influencing the broker-dealer or other intermediary and your financial
professional to recommend the Fund over another investment. Ask your financial
professional or visit your financial intermediary’s website for more
information.
54
Thrivent
Mid Cap Growth Fund
Class
S: TMCGX
|
|
Class
S |
|
Maximum
Sales Charge (load) Imposed On
Purchases
(as a % of offering price) |
|
|
Maximum
Deferred Sales Charge (load) (as a % of
the net
asset value) |
|
|
|
Class
S |
|
Management
Fees |
|
|
Distribution
and Shareholder Service (12b-1) Fees |
|
|
Other
Expenses |
|
|
Total
Annual Fund Operating Expenses |
|
|
Less Fee
Waivers and/or Expense
Reimbursements1 |
|
|
Total
Annual Fund Operating Expenses After Fee
Waivers
and/or Expense Reimbursements |
|
1
The Adviser
has contractually agreed, through at least February 28,
2025 , to waive a portion of the
management fees associated with the Class S shares of the Thrivent Mid
Cap Growth Fund in order to limit the Total Annual Fund Operating Expenses After
Fee Waivers and/or Expense Reimbursements to an annual rate of 0.90% of the
average daily net assets of the Class S shares. This contractual provision,
however, may be terminated before the indicated termination date upon the mutual
agreement between the Independent Trustees of the Fund and the
Adviser.
|
|
1
Year |
3
Years |
5
Years |
10
Years |
|
Class
S |
$ |
$ |
$ |
$ |
The Fund is
subject to the following principal investment risks, which you should review
carefully and in entirety. The Fund may
not
achieve its investment objective and you could lose money by investing in the
Fund.
55

|
|
|
|
|
|
|
|
56
|
|
|
Since
Inception |
|
|
1
Year |
|
|
Class S
(before taxes) |
|
|
|
Class S
(after taxes on distributions) |
|
|
|
Class S
(after taxes on distributions
and
redemptions) |
|
|
|
Russell
MidCap® Growth Index
(reflects
no deduction for fees,
expenses
or taxes) |
|
|
|
S&P
MidCap 400® Growth Index
(reflects
no deduction for fees,
expenses
or taxes) |
|
|
Management
Investment
Adviser
The Fund is
managed by Thrivent Asset Management, LLC (“Thrivent Asset Mgt.” or the
“Adviser”).
Portfolio
Managers
The following individuals are jointly and primarily
responsible for the day-to-day management of the Fund:
|
Name
and Title |
Portfolio
Manager
of
the Fund Since |
|
Siddharth
Sinha, CFA
Senior
Portfolio Manager |
January
2021 |
|
Mark C.
Militello, CFA
Senior
Portfolio Manager |
August
2023 |
Purchase and Sale
of Fund Shares
You may purchase,
redeem or exchange shares of the Fund directly from the Fund or through certain
broker-dealers.
The minimum
initial investment requirement for this Fund is $2,000 and the minimum
subsequent investment requirement is $50 for taxable accounts. For IRA or
tax-deferred accounts, the minimum initial investment requirement for this Fund
is $1,000 and the minimum subsequent investment requirement is $50. These
investment requirements may be different, however, for investors investing in
the Fund through an automatic investment plan or through certain fee-based
investment advisory programs.
You may purchase
or redeem Fund shares on days that the New York Stock Exchange is open. You may
conduct such transactions by mail, telephone 800-847-4836, the Internet
(thrivent.com or thriventfunds.com), the mobile app, by wire/ACH transfer or
through an automatic investment plan (for purchases) or a systematic withdrawal
plan (for redemptions), subject to certain limitations.
Tax
Information
The Fund intends
to make distributions that may be taxed as ordinary income or capital gains.
Investing in the Fund through a retirement plan could have different tax
consequences.
Payments to
Broker-Dealers and Other Financial Intermediaries
If you purchase
the Fund through a broker-dealer or other financial intermediary (such as an
insurance company), the Fund and its related companies may pay the intermediary
for the sale of Fund shares and related services. These payments may create a
conflict of interest by influencing the broker-dealer or other intermediary and
your financial professional to recommend the Fund over another investment. Ask
your financial professional or visit your financial intermediary’s website for
more information.
57
Thrivent
Mid Cap Stock Fund
Class
S: TMSIX | Class A: AASCX
|
|
Class
S |
Class
A |
|
Maximum
Sales Charge (load) Imposed
On
Purchases (as a % of offering price) |
|
|
|
Maximum
Deferred Sales Charge (load)
(as a % of
the net asset value) |
|
|
|
|
Class
S |
Class
A |
|
Management
Fees |
|
|
|
Distribution
and Shareholder Service
(12b-1)
Fees |
|
|
|
Other
Expenses |
|
|
|
Total
Annual Fund Operating Expenses |
|
|
|
|
1
Year |
3
Years |
5
Years |
10
Years |
|
Class
S |
$ |
$ |
$ |
$ |
|
Class
A |
$ |
$ |
$ |
$ |
The Fund is
subject to the following principal investment risks, which you should review
carefully and in entirety. The Fund may
not
achieve its investment objective and you could lose money by investing in the
Fund.
58

|
|
|
|
|
|
|
|
|
|
1
Year |
5
Years |
10
Years |
|
Class A
(before taxes) |
|
|
|
|
Class A
(after taxes on
distributions) |
|
|
|
|
Class A
(after taxes on
distributions
and
redemptions) |
|
|
|
|
Class S
(before taxes) |
|
|
|
|
Russell
Midcap® Index
(reflects
no deduction for
fees,
expenses or taxes) |
|
|
|
|
S&P
MidCap 400® Index
(reflects
no deduction for
fees,
expenses or taxes) |
|
|
|
Management
Investment
Adviser
The Fund is
managed by Thrivent Asset Management, LLC (“Thrivent Asset Mgt.” or the
“Adviser”).
Portfolio
Managers
The following individuals are jointly and primarily
responsible for the day-to-day management of the Fund:
59
|
Name
and Title |
Portfolio
Manager
of
the Fund Since |
|
Brian J.
Flanagan, CFA
Senior
Portfolio Manager |
February
2004 |
|
Vikram
Kaura
Senior
Portfolio Manager |
May
2022 |
|
J.P.
McKim, CFA
Senior
Portfolio Manager |
May
2022 |
Purchase and Sale
of Fund Shares
You may purchase,
redeem or exchange shares of the Fund through certain broker-dealers. You also
may purchase Class S shares of the Fund directly from the Fund online at
thriventfunds.com.
The minimum
initial investment requirement for this Fund is $2,000 and the minimum
subsequent investment requirement is $50 for taxable accounts. For IRA or
tax-deferred accounts, the minimum initial investment requirement for this Fund
is $1,000 and the minimum subsequent investment requirement is $50. These
investment requirements may be different, however, for investors investing in
the Fund through an automatic investment plan or, for Class S shares, through
certain fee-based investment advisory programs.
You may purchase
or redeem Fund shares on days that the New York Stock Exchange is open. You may
conduct such transactions by mail, telephone 800-847-4836, the Internet
(thrivent.com or, for Class S shares, thriventfunds.com), the mobile app, by
wire/ACH transfer or through an automatic investment plan (for purchases) or a
systematic withdrawal plan (for redemptions), subject to certain
limitations.
Tax
Information
The Fund intends
to make distributions that may be taxed as ordinary income or capital gains.
Investing in the Fund through a retirement plan could have different tax
consequences.
Payments to
Broker-Dealers and Other Financial Intermediaries
If you purchase
the Fund through a broker-dealer or other financial intermediary (such as an
insurance company), the Fund and its related companies may pay the intermediary
for the sale of Fund shares and related services. These payments may create a
conflict of interest by influencing the broker-dealer or other intermediary and
your financial professional to recommend the Fund over another investment. Ask
your financial professional or visit your financial intermediary’s website for
more information.
60
Thrivent
Mid Cap Value Fund
Class
S: TMCVX
|
|
Class
S |
|
Maximum
Sales Charge (load) Imposed On
Purchases
(as a % of offering price) |
|
|
Maximum
Deferred Sales Charge (load) (as a % of
the net
asset value) |
|
|
|
Class
S |
|
Management
Fees |
|
|
Distribution
and Shareholder Service (12b-1) Fees |
|
|
Other
Expenses |
|
|
Total
Annual Fund Operating Expenses |
|
|
Less Fee
Waivers and/or Expense
Reimbursements1 |
|
|
Total
Annual Fund Operating Expenses After Fee
Waivers
and/or Expense Reimbursements |
|
1
The Adviser
has contractually agreed, through at least February 28,
2025 , to waive a portion of the
management fees associated with the Class S shares of the Thrivent Mid
Cap Value Fund in order to limit the Total Annual Fund Operating Expenses After
Fee Waivers and/or Expense Reimbursements to an annual rate of 0.90% of the
average daily net assets of the Class S shares. This contractual provision,
however, may be terminated before the indicated termination date upon the mutual
agreement between the Independent Trustees of the Fund and the
Adviser.
|
|
1
Year |
3
Years |
5
Years |
10
Years |
|
Class
S |
$ |
$ |
$ |
$ |
The Fund is
subject to the following principal investment risks, which you should review
carefully and in entirety. The Fund may
not
achieve its investment objective and you could lose money by investing in the
Fund.
61

|
|
|
|
|
|
|
|
|
|
|
Since
Inception |
|
|
1
Year |
|
|
Class S
(before taxes) |
|
|
|
Class S
(after taxes on distributions) |
|
|
|
Class S
(after taxes on distributions
and
redemptions) |
|
|
|
Russell
MidCap® Value Index
(reflects
no deduction for fees,
expenses
or taxes) |
|
|
|
S&P
MidCap 400® Value Index
(reflects
no deduction for fees,
expenses
or taxes) |
|
|
Management
Investment
Adviser
The Fund is
managed by Thrivent Asset Management, LLC (“Thrivent Asset Mgt.” or the
“Adviser”).
Portfolio
Managers
The following individuals are jointly and primarily
responsible for the day-to-day management of the Fund:
62
|
Name
and Title |
Portfolio
Manager
of
the Fund Since |
|
Graham
Wong, CFA
Senior
Portfolio Manager |
February
2020 |
|
Nicholas
E. Griffith, MD, CFA
Portfolio
Manager |
February
2022 |
Purchase and Sale
of Fund Shares
You may purchase,
redeem or exchange shares of the Fund directly from the Fund or through certain
broker-dealers.
The minimum
initial investment requirement for this Fund is $2,000 and the minimum
subsequent investment requirement is $50 for taxable accounts. For IRA or
tax-deferred accounts, the minimum initial investment requirement for this Fund
is $1,000 and the minimum subsequent investment requirement is $50. These
investment requirements may be different, however, for investors investing in
the Fund through an automatic investment plan or through certain fee-based
investment advisory programs.
You may purchase
or redeem Fund shares on days that the New York Stock Exchange is open. You may
conduct such
transactions by
mail, telephone 800-847-4836, the Internet (thrivent.com or thriventfunds.com),
the mobile app, by wire/ACH transfer or through an automatic investment plan
(for purchases) or a systematic withdrawal plan (for redemptions), subject to
certain limitations.
Tax
Information
The Fund intends
to make distributions that may be taxed as ordinary income or capital gains.
Investing in the Fund through a retirement plan could have different tax
consequences.
Payments to
Broker-Dealers and Other Financial Intermediaries
If you purchase
the Fund through a broker-dealer or other financial intermediary (such as an
insurance company), the Fund and its related companies may pay the intermediary
for the sale of Fund shares and related services. These payments may create a
conflict of interest by influencing the broker-dealer or other intermediary and
your financial professional to recommend the Fund over another investment. Ask
your financial professional or visit your financial intermediary’s website for
more information.
63
Thrivent
Moderate Allocation Fund
Class
S: TMAIX | Class A: THMAX
|
|
Class
S |
Class
A |
|
Maximum
Sales Charge (load) Imposed
On
Purchases (as a % of offering price) |
|
|
|
Maximum
Deferred Sales Charge (load)
(as a % of
the net asset value) |
|
|
|
|
Class
S |
Class
A |
|
Management
Fees |
|
|
|
Distribution
and Shareholder Service
(12b-1)
Fees |
|
|
|
Other
Expenses |
|
|
|
Acquired
Fund Fees and Expenses |
|
|
|
Total
Annual Fund Operating Expenses |
|
|
|
Less Fee
Waivers and/or Expense
Reimbursements1 |
|
|
|
Total
Annual Fund Operating Expenses
After Fee
Waivers and/or Expense
Reimbursements |
|
|
1
The Adviser
has contractually agreed, for as long as the current fee structure is in place
and through at least February 28,
2025 , to waive an amount equal to any management
fees indirectly incurred by the Fund as a result of its investment in any other
mutual fund for which the Adviser or an affiliate serves as investment adviser,
other than Thrivent Cash Management Trust. This contractual provision may be
terminated upon the mutual agreement between the Independent Trustees of the
Fund and the Adviser.
|
|
1
Year |
3
Years |
5
Years |
10
Years |
|
Class
S |
$ |
$ |
$ |
$ |
|
Class
A |
$ |
$ |
$ |
$ |
64
|
|
|
|
|
|
| |
|
|
|
|
|
|
|
|
|
|
|
|
|
|
|
|
|
|
|
|
|
|
|
|
|
|
|
|
|
|
|
|
|
|
|
|
|
|
|
|
|
|
|
|
|
|
|
|
|
|
|
|
|
|
|
|
|
|
|
|
|
|
The Fund is
subject to the following principal investment risks, which you should review
carefully and in entirety. The Fund may
not
achieve its investment objective and you could lose money by investing in the
Fund.
65
66

|
|
|
|
|
|
|
|
|
|
1
Year |
5
Years |
10
Years |
|
Class A
(before taxes) |
|
|
|
|
Class A
(after taxes on
distributions) |
|
|
|
|
Class A
(after taxes on
distributions
and
redemptions) |
|
|
|
|
Class S
(before taxes) |
|
|
|
|
S&P
500® Index
(reflects
no deduction for
fees,
expenses or taxes) |
|
|
|
|
Bloomberg
U.S. Aggregate
Bond
Index
(reflects
no deduction for
fees,
expenses or taxes) |
|
|
|
|
MSCI All
Country World Index
ex-USA -
USD Net Returns
(reflects
no deduction for
fees,
expenses or taxes) |
|
|
|
67
Management
Investment
Adviser
The Fund is
managed by Thrivent Asset Management, LLC (“Thrivent Asset Mgt.” or the
“Adviser”).
Portfolio
Managers
The following individuals are jointly and primarily
responsible for the day-to-day management of the Fund:
|
Name
and Title |
Portfolio
Manager
of
the Fund Since |
|
Stephen D.
Lowe, CFA
Chief
Investment Strategist |
April
2016 |
|
David S.
Royal
Chief
Financial Officer and Chief
Investment
Officer |
April
2018 |
|
David R.
Spangler, CFA
Senior
Portfolio Manager |
February
2019 |
Purchase and Sale
of Fund Shares
You may purchase,
redeem or exchange shares of the Fund through certain broker-dealers. You also
may purchase Class S shares of the Fund directly from the Fund online at
thriventfunds.com.
The minimum
initial investment requirement for this Fund is $2,000 and the minimum
subsequent investment requirement is $50 for taxable accounts. For IRA or
tax-deferred accounts, the
minimum initial
investment requirement for this Fund is $1,000 and the minimum subsequent
investment requirement is $50. These investment requirements may be different,
however, for investors investing in the Fund through an automatic investment
plan or, for Class S shares, through certain fee-based investment advisory
programs.
You may purchase
or redeem Fund shares on days that the New York Stock Exchange is open. You may
conduct such transactions by mail, telephone 800-847-4836, the Internet
(thrivent.com or, for Class S shares, thriventfunds.com), the mobile app, by
wire/ACH transfer or through an automatic investment plan (for purchases) or a
systematic withdrawal plan (for redemptions), subject to certain
limitations.
Tax
Information
The Fund intends
to make distributions that may be taxed as ordinary income or capital gains.
Investing in the Fund through a retirement plan could have different tax
consequences.
Payments to
Broker-Dealers and Other Financial Intermediaries
If you purchase
the Fund through a broker-dealer or other financial intermediary (such as an
insurance company), the Fund and its related companies may pay the intermediary
for the sale of Fund shares and related services. These payments may create a
conflict of interest by influencing the broker-dealer or other intermediary and
your financial professional to recommend the Fund over another investment. Ask
your financial professional or visit your financial intermediary’s website for
more information.
68
Thrivent
Moderately Aggressive Allocation Fund
Class
S: TMAFX | Class A: TMAAX
|
|
Class
S |
Class
A |
|
Maximum
Sales Charge (load) Imposed
On
Purchases (as a % of offering price) |
|
|
|
Maximum
Deferred Sales Charge (load)
(as a % of
the net asset value) |
|
|
|
|
Class
S |
Class
A |
|
Management
Fees |
|
|
|
Distribution
and Shareholder Service
(12b-1)
Fees |
|
|
|
Other
Expenses |
|
|
|
Acquired
Fund Fees and Expenses |
|
|
|
Total
Annual Fund Operating Expenses |
|
|
|
Less Fee
Waivers and/or Expense
Reimbursements1
|
|
|
|
Total
Annual Fund Operating Expenses
After Fee
Waivers and/or Expense
Reimbursements |
|
|
1
The Adviser
has contractually agreed, for as long as the current fee structure is in place
and through at least February 28,
2025 , to waive an amount equal to any management
fees indirectly incurred by the Fund as a result of its investment in any other
mutual fund for which the Adviser or an affiliate serves as investment adviser,
other than Thrivent Cash Management Trust. This contractual provision may be
terminated upon the mutual agreement between the Independent Trustees of the
Fund and the Adviser.
|
|
1
Year |
3
Years |
5
Years |
10
Years |
|
Class
S |
$ |
$ |
$ |
$ |
|
Class
A |
$ |
$ |
$ |
$ |
69
|
|
|
|
|
|
| |
|
|
|
|
|
|
|
|
|
|
|
|
|
|
|
|
|
|
|
|
|
|
|
|
|
|
|
|
|
|
|
|
|
|
|
|
|
|
|
|
|
|
|
|
|
|
|
|
|
|
|
|
|
|
|
|
|
|
|
|
|
|
The Fund is
subject to the following principal investment risks, which you should review
carefully and in entirety. The Fund may
not
achieve its investment objective and you could lose money by investing in the
Fund.
70
71

|
|
|
|
|
|
|
|
|
|
1
Year |
5
Years |
10
Years |
|
Class A
(before taxes) |
|
|
|
|
Class A
(after taxes on
distributions) |
|
|
|
|
Class A
(after taxes on
distributions
and
redemptions) |
|
|
|
|
Class S
(before taxes) |
|
|
|
|
S&P
500® Index
(reflects
no deduction for
fees,
expenses or taxes) |
|
|
|
|
Bloomberg
U.S. Aggregate
Bond
Index
(reflects
no deduction for
fees,
expenses or taxes) |
|
|
|
|
MSCI All
Country World Index
ex-USA -
USD Net Returns
(reflects
no deduction for
fees,
expenses or taxes) |
|
|
|
Management
Investment
Adviser
The Fund is
managed by Thrivent Asset Management, LLC (“Thrivent Asset Mgt.” or the
“Adviser”).
72
Portfolio
Managers
The following individuals are jointly and primarily
responsible for the day-to-day management of the Fund:
|
Name
and Title |
Portfolio
Manager
of
the Fund Since |
|
Stephen D.
Lowe, CFA
Chief
Investment Strategist |
April
2016 |
|
David S.
Royal
Chief
Financial Officer and Chief
Investment
Officer |
April
2018 |
|
David R.
Spangler, CFA
Senior
Portfolio Manager |
February
2019 |
Purchase and Sale
of Fund Shares
You may purchase,
redeem or exchange shares of the Fund through certain broker-dealers. You also
may purchase Class S shares of the Fund directly from the Fund online at
thriventfunds.com.
The minimum
initial investment requirement for this Fund is $2,000 and the minimum
subsequent investment requirement is $50 for taxable accounts. For IRA or
tax-deferred accounts, the minimum initial investment requirement for this Fund
is $1,000 and the minimum subsequent investment requirement is $50. These
investment requirements may be different, however, for
investors
investing in the Fund through an automatic investment plan or, for Class S
shares, through certain fee-based investment advisory programs.
You may purchase
or redeem Fund shares on days that the New York Stock Exchange is open. You may
conduct such transactions by mail, telephone 800-847-4836, the Internet
(thrivent.com or, for Class S shares, thriventfunds.com), the mobile app, by
wire/ACH transfer or through an automatic investment plan (for purchases) or a
systematic withdrawal plan (for redemptions), subject to certain
limitations.
Tax
Information
The Fund intends
to make distributions that may be taxed as ordinary income or capital gains.
Investing in the Fund through a retirement plan could have different tax
consequences.
Payments to
Broker-Dealers and Other Financial Intermediaries
If you purchase
the Fund through a broker-dealer or other financial intermediary (such as an
insurance company), the Fund and its related companies may pay the intermediary
for the sale of Fund shares and related services. These payments may create a
conflict of interest by influencing the broker-dealer or other intermediary and
your financial professional to recommend the Fund over another investment. Ask
your financial professional or visit your financial intermediary’s website for
more information.
73
Thrivent
Moderately Conservative Allocation Fund
Class
S: TCAIX | Class A: TCAAX
|
|
Class
S |
Class
A |
|
Maximum
Sales Charge (load) Imposed
On
Purchases (as a % of offering price) |
|
|
|
Maximum
Deferred Sales Charge (load)
(as a % of
the net asset value) |
|
|
|
|
Class
S |
Class
A |
|
Management
Fees |
|
|
|
Distribution
and Shareholder Service
(12b-1)
Fees |
|
|
|
Other
Expenses |
|
|
|
Acquired
Fund Fees and Expenses |
|
|
|
Total
Annual Fund Operating Expenses |
|
|
|
Less Fee
Waivers and/or Expense
Reimbursements1 |
|
|
|
Total
Annual Fund Operating Expenses
After Fee
Waivers and/or Expense
Reimbursements |
|
|
1
The Adviser
has contractually agreed, for as long as the current fee structure is in place
and through at least February 28,
2025 , to waive an amount equal to any management
fees indirectly incurred by the Fund as a result of its investment in any other
mutual fund for which the Adviser or an affiliate serves as investment adviser,
other than Thrivent Cash Management Trust. This contractual provision may be
terminated upon the mutual agreement between the Independent Trustees of the
Fund and the Adviser.
|
|
1
Year |
3
Years |
5
Years |
10
Years |
|
Class
S |
$ |
$ |
$ |
$ |
|
Class
A |
$ |
$ |
$ |
$ |
74
|
|
|
|
|
|
| |
|
|
|
|
|
|
|
|
|
|
|
|
|
|
|
|
|
|
|
|
|
|
|
|
|
|
|
|
|
|
|
|
|
|
|
|
|
|
|
|
|
|
|
|
|
|
|
|
|
|
|
|
|
|
|
|
|
|
|
|
|
|
The Fund is
subject to the following principal investment risks, which you should review
carefully and in entirety. The Fund may
not
achieve its investment objective and you could lose money by investing in the
Fund.
75
76
77

|
|
|
|
|
|
|
|
|
|
1
Year |
5
Years |
10
Years |
|
Class A
(before taxes) |
|
|
|
|
Class A
(after taxes on
distributions) |
|
|
|
|
Class A
(after taxes on
distributions
and
redemptions) |
|
|
|
|
Class S
(before taxes) |
|
|
|
|
S&P
500® Index
(reflects
no deduction for
fees,
expenses or taxes) |
|
|
|
|
Bloomberg
U.S. Aggregate
Bond
Index
(reflects
no deduction for
fees,
expenses or taxes) |
|
|
|
|
MSCI All
Country World Index
ex-USA -
USD Net Returns
(reflects
no deduction for
fees,
expenses or taxes) |
|
|
|
Management
Investment
Adviser
The Fund is
managed by Thrivent Asset Management, LLC (“Thrivent Asset Mgt.” or the
“Adviser”).
Portfolio
Managers
The following individuals are jointly and primarily
responsible for the day-to-day management of the Fund:
|
Name
and Title |
Portfolio
Manager
of
the Fund Since |
|
Stephen D.
Lowe, CFA
Chief
Investment Strategist |
April
2016 |
|
David S.
Royal
Chief
Financial Officer and Chief
Investment
Officer |
April
2018 |
|
David R.
Spangler, CFA
Senior
Portfolio Manager |
February
2019 |
Purchase and Sale
of Fund Shares
You may purchase,
redeem or exchange shares of the Fund through certain broker-dealers. You also
may purchase Class S shares of the Fund directly from the Fund online at
thriventfunds.com.
The minimum
initial investment requirement for this Fund is $2,000 and the minimum
subsequent investment requirement is $50 for taxable accounts. For IRA or
tax-deferred accounts, the minimum initial investment requirement for this Fund
is $1,000 and the minimum subsequent investment requirement is $50. These
investment requirements may be different, however, for investors investing in
the Fund through an automatic investment plan or, for Class S shares, through
certain fee-based investment advisory programs.
You may purchase
or redeem Fund shares on days that the New York Stock Exchange is open. You may
conduct such transactions by mail, telephone 800-847-4836, the Internet
(thrivent.com or, for Class S shares, thriventfunds.com), the mobile app, by
wire/ACH transfer or through an automatic investment plan (for purchases) or a
systematic withdrawal plan (for redemptions), subject to certain
limitations.
Tax
Information
The Fund intends
to make distributions that may be taxed as ordinary income or capital gains.
Investing in the Fund through a retirement plan could have different tax
consequences.
Payments to
Broker-Dealers and Other Financial Intermediaries
If you purchase
the Fund through a broker-dealer or other financial intermediary (such as an
insurance company), the Fund and its related companies may pay the intermediary
for the sale of Fund shares and related services. These payments may create a
conflict of interest by influencing the broker-dealer or other intermediary and
your financial professional to recommend the Fund over another investment. Ask
your financial professional or visit your financial intermediary’s website for
more information.
78
Thrivent
Money Market Fund
Class
S: AALXX | Class A: AMMXX
|
|
Class
S |
Class
A |
|
Maximum
Sales Charge (load) Imposed
On
Purchases (as a % of offering price) |
|
|
|
Maximum
Deferred Sales Charge (load)
(as a % of
the net asset value) |
|
|
|
|
Class
S |
Class
A |
|
Management
Fees1 |
|
|
|
Distribution
and Shareholder Service
(12b-1)
Fees |
|
|
|
Other
Expenses |
|
|
|
Total
Annual Fund Operating Expenses1 |
|
|
|
Less Fee
Waivers and/or Expense
Reimbursements2 |
|
|
|
Total
Annual Fund Operating Expenses
After Fee
Waivers and/or Expense
Reimbursements |
|
|
1
Management
Fees and Total Annual Fund Operating Expenses have been restated to reflect
estimated expenses anticipated to be incurred in the current fiscal
year.
2
The Adviser has
contractually agreed, through at least February 28,
2025 , to waive a portion of the
management fees associated with the Class A shares of the Thrivent
Money Market Fund equal in the aggregate to 0.05% of the average daily net
assets of the Class A shares. This contractual provision, however, may be
terminated before the indicated termination date upon the mutual agreement
between the Independent Trustees of the Fund and the Adviser.
|
|
1
Year |
3
Years |
5
Years |
10
Years |
|
Class
S |
$ |
$ |
$ |
$ |
|
Class
A |
$ |
$ |
$ |
$ |
79

|
|
|
|
|
|
|
|
1
80
|
|
1
Year |
5
Years |
10
Years |
|
Class A
(before taxes) |
|
|
|
|
Class A
(after taxes on
distributions) |
|
|
|
|
Class A
(after taxes on
distributions
and
redemptions) |
|
|
|
|
Class S
(before taxes) |
|
|
|
Management
Investment
Adviser
The Fund is
managed by Thrivent Asset Management, LLC (“Thrivent Asset Mgt.” or the
“Adviser”).
Portfolio
Manager
The following individual is primarily
responsible for the day-to-day management of the Fund:
|
Name
and Title |
Portfolio
Manager
of
the Fund Since |
|
William D.
Stouten
Senior
Portfolio Manager |
December
2003 |
Purchase and Sale
of Fund Shares
You may purchase,
redeem or exchange shares of the Fund through certain broker-dealers. You also
may purchase Class S shares of the Fund directly from the Fund online at
thriventfunds.com.
The minimum
initial investment requirement for this Fund is $2,000 and the minimum
subsequent investment requirement is $50 for taxable accounts. For IRA or
tax-deferred accounts, the minimum initial investment requirement for this Fund
is $1,000 and the minimum subsequent investment requirement is $50. These
investment requirements may be different, however, for investors investing in
the Fund through an automatic investment plan or, for Class S shares, through
certain fee-based investment advisory programs.
You may purchase
or redeem Fund shares on days that the New York Stock Exchange is open. You may
conduct such transactions by mail, telephone 800-847-4836, the Internet
(thrivent.com or, for Class S shares, thriventfunds.com), the mobile app, by
wire/ACH transfer or through an automatic investment plan (for purchases) or a
systematic withdrawal plan (for redemptions), subject to certain
limitations.
Tax
Information
The Fund intends
to make distributions that may be taxed as ordinary income or capital gains.
Investing in the Fund through a retirement plan could have different tax
consequences.
Payments to
Broker-Dealers and Other Financial Intermediaries
If you purchase
the Fund through a broker-dealer or other financial intermediary (such as an
insurance company), the Fund and its related companies may pay the intermediary
for the sale of Fund shares and related services. These payments may create a
conflict of interest by influencing the broker-dealer or other intermediary and
your financial professional to recommend the Fund over another investment. Ask
your financial professional or visit your financial intermediary’s website for
more information.
81
Thrivent
Multidimensional Income Fund
Class
S: TMLDX
|
|
Class
S |
|
Maximum
Sales Charge (load) Imposed On
Purchases
(as a % of offering price) |
|
|
Maximum
Deferred Sales Charge (load) (as a % of
the net
asset value) |
|
|
|
Class
S |
|
Management
Fees |
|
|
Distribution
and Shareholder Service (12b-1) Fees |
|
|
Other
Expenses |
|
|
Acquired
Fund Fees and Expenses |
|
|
Total
Annual Fund Operating Expenses |
|
|
Less Fee
Waivers and/or Expense
Reimbursements1 |
|
|
Total
Annual Fund Operating Expenses After Fee
Waivers
and/or Expense Reimbursements |
|
1
The Adviser
has contractually agreed, through at least February 28,
2025 , to waive a portion of the
management fees associated with the Class S shares of the Thrivent
Multidimensional Income Fund in order to limit the Total Annual Fund Operating
Expenses After Fee Waivers and/or Expense Reimbursements to an annual rate of
0.75% of the average daily net assets of the Class S shares. This contractual
provision, however, may be terminated before the indicated termination date upon
the mutual agreement between the Independent Trustees of the Fund and the
Adviser.
|
|
1
Year |
3
Years |
5
Years |
10
Years |
|
Class
S |
$ |
$ |
$ |
$ |
82
The Fund is
subject to the following principal investment risks, which you should review
carefully and in entirety. The Fund may
not
achieve its investment objective and you could lose money by investing in the
Fund.
83
84

|
|
|
|
|
|
|
|
|
|
|
|
Since
Inception |
|
|
1
Year |
5
Years |
|
|
Class S
(before taxes) |
|
|
|
|
Class S
(after taxes on
distributions) |
|
|
|
|
Class S
(after taxes on
distributions
and
redemptions) |
|
|
|
|
Bloomberg
U.S. Corporate
High Yield
Bond Index
(reflects
no deduction for
fees,
expenses or taxes) |
|
|
|
|
Bloomberg
Emerging
Markets
USD Sovereign
Index
(reflects
no deduction for
fees,
expenses or taxes) |
|
|
|
|
S&P
U.S. Preferred Stock
Total
Return Index
(reflects
no deduction for
fees,
expenses or taxes) |
|
|
|
Management
Investment
Adviser
The Fund is
managed by Thrivent Asset Management, LLC (“Thrivent Asset Mgt.” or the
“Adviser”).
Portfolio
Managers
The following individuals are jointly and primarily
responsible for the day-to-day management of the Fund:
85
|
Name
and Title |
Portfolio
Manager
of
the Fund Since |
|
Stephen D.
Lowe, CFA
Chief
Investment Strategist |
February
2018 |
|
Kent L.
White, CFA
Vice
President, Fixed Income Mutual
Funds |
July
2019 |
|
Theron G.
Whitehorn, CFA
Director
of Fixed Income Quantitative
Research |
February
2021 |
Purchase and Sale
of Fund Shares
You may purchase,
redeem or exchange shares of the Fund directly from the Fund or through certain
broker-dealers.
The minimum
initial investment requirement for this Fund is $2,000 and the minimum
subsequent investment requirement is $50 for taxable accounts. For IRA or
tax-deferred accounts, the minimum initial investment requirement for this Fund
is $1,000 and the minimum subsequent investment requirement is $50. These
investment requirements may be different, however, for investors investing in
the Fund through an automatic investment plan or through certain fee-based
investment advisory programs.
You may purchase
or redeem Fund shares on days that the New York Stock Exchange is open. You may
conduct such transactions by mail, telephone 800-847-4836, the Internet
(thrivent.com or thriventfunds.com), the mobile app, by wire/ACH transfer or
through an automatic investment plan (for purchases) or a systematic withdrawal
plan (for redemptions), subject to certain limitations.
Tax
Information
The Fund intends
to make distributions that may be taxed as ordinary income or capital gains.
Investing in the Fund through a retirement plan could have different tax
consequences.
Payments to
Broker-Dealers and Other Financial Intermediaries
If you purchase
the Fund through a broker-dealer or other financial intermediary (such as an
insurance company), the Fund and its related companies may pay the intermediary
for the sale of Fund shares and related services. These payments may create a
conflict of interest by influencing the broker-dealer or other intermediary and
your financial professional to recommend the Fund over another investment. Ask
your financial professional or visit your financial intermediary’s website for
more information.
86
Thrivent
Municipal Bond Fund
Class
S: TMBIX | Class A: AAMBX
|
|
Class
S |
Class
A |
|
Maximum
Sales Charge (load) Imposed
On
Purchases (as a % of offering price) |
|
|
|
Maximum
Deferred Sales Charge (load)
(as a % of
the net asset value) |
|
|
|
|
Class
S |
Class
A |
|
Management
Fees |
|
|
|
Distribution
and Shareholder Service
(12b-1)
Fees |
|
|
|
Other
Expenses |
|
|
|
Total
Annual Fund Operating Expenses |
|
|
|
Less Fee
Waivers and/or Expense
Reimbursements1 |
|
|
|
Total
Annual Fund Operating Expenses
After Fee
Waivers and/or Expense
Reimbursements |
|
|
1
The Adviser
has contractually agreed, through at least February 28,
2025 , to waive a portion of the
management fees associated with the Class S shares of the Thrivent
Municipal Bond Fund in order to limit the Total Annual Fund Operating Expenses
After Fee Waivers and/or Expense Reimbursements to an annual rate of 0.51% of
the average daily net assets of the Class S shares. This contractual provision,
however, may be terminated before the indicated termination date upon the mutual
agreement between the Independent Trustees of the Fund and the
Adviser.
|
|
1
Year |
3
Years |
5
Years |
10
Years |
|
Class
S |
$ |
$ |
$ |
$ |
|
Class
A |
$ |
$ |
$ |
$ |
87
The Fund is
subject to the following principal investment risks, which you should review
carefully and in entirety. The Fund may
not
achieve its investment objective and you could lose money by investing in the
Fund.
88

|
|
|
|
|
|
|
|
|
|
1
Year |
5
Years |
10
Years |
|
Class A
(before taxes) |
|
|
|
|
Class A
(after taxes on
distributions) |
|
|
|
|
Class A
(after taxes on
distributions
and
redemptions) |
|
|
|
|
Class S
(before taxes) |
|
|
|
|
Bloomberg
Municipal Bond
Index
(reflects
no deduction for
fees,
expenses or taxes) |
|
|
|
Management
Investment
Adviser
The Fund is
managed by Thrivent Asset Management, LLC (“Thrivent Asset Mgt.” or the
“Adviser”).
Portfolio
Managers
The following individuals are jointly and primarily
responsible for the day-to-day management of the Fund:
|
Name
and Title |
Portfolio
Manager
of
the Fund Since |
|
Johan Å.
Åkesson, CFA
Senior
Portfolio Manager |
May
2022 |
|
Stephanie
L. Woeppel
Senior
Portfolio Manager |
February
2023 |
Purchase and Sale
of Fund Shares
You may purchase,
redeem or exchange shares of the Fund through certain broker-dealers. You also
may purchase Class S shares of the Fund directly from the Fund online at
thriventfunds.com.
The minimum
initial investment requirement for this Fund is $2,000 and the minimum
subsequent investment requirement is $50 for taxable accounts. For IRA or
tax-deferred accounts, the minimum initial investment requirement for this Fund
is $1,000 and the minimum subsequent investment requirement is $50. These
investment requirements may be different, however, for investors investing in
the Fund through an automatic investment plan or, for Class S shares, through
certain fee-based investment advisory programs.
You may purchase
or redeem Fund shares on days that the New York Stock Exchange is open. You may
conduct such transactions by mail, telephone 800-847-4836, the Internet
(thrivent.com or, for Class S shares, thriventfunds.com), the mobile app, by
wire/ACH transfer or through an automatic investment plan (for purchases) or a
systematic withdrawal plan (for redemptions), subject to certain
limitations.
Tax
Information
The Fund generally
intends to distribute tax-exempt income, although it may also make distributions
that are taxed as ordinary income or capital gains. Investing in the Fund
through a retirement plan could have different tax
consequences.
Payments to
Broker-Dealers and Other Financial Intermediaries
If you purchase
the Fund through a broker-dealer or other financial intermediary (such as an
insurance company), the Fund and its related companies may pay the intermediary
for the sale of Fund shares and related services. These payments may create a
conflict of interest by influencing the broker-dealer or other intermediary and
your financial professional to recommend the Fund over another investment. Ask
your financial professional or visit your financial intermediary’s website for
more information.
89
Thrivent
Opportunity Income Plus Fund
Class
S: IIINX | Class A: AAINX
|
|
Class
S |
Class
A |
|
Maximum
Sales Charge (load) Imposed
On
Purchases (as a % of offering price) |
|
|
|
Maximum
Deferred Sales Charge (load)
(as a % of
the net asset value) |
|
|
|
|
Class
S |
Class
A |
|
Management
Fees |
|
|
|
Distribution
and Shareholder Service
(12b-1)
Fees |
|
|
|
Other
Expenses |
|
|
|
Acquired
Fund Fees and Expenses |
|
|
|
Total
Annual Fund Operating Expenses |
|
|
|
|
1
Year |
3
Years |
5
Years |
10
Years |
|
Class
S |
$ |
$ |
$ |
$ |
|
Class
A |
$ |
$ |
$ |
$ |
The Fund is
subject to the following principal investment risks, which you should review
carefully and in entirety. The Fund may
not
achieve its investment objective and you could lose money by investing in the
Fund.
90
91
92
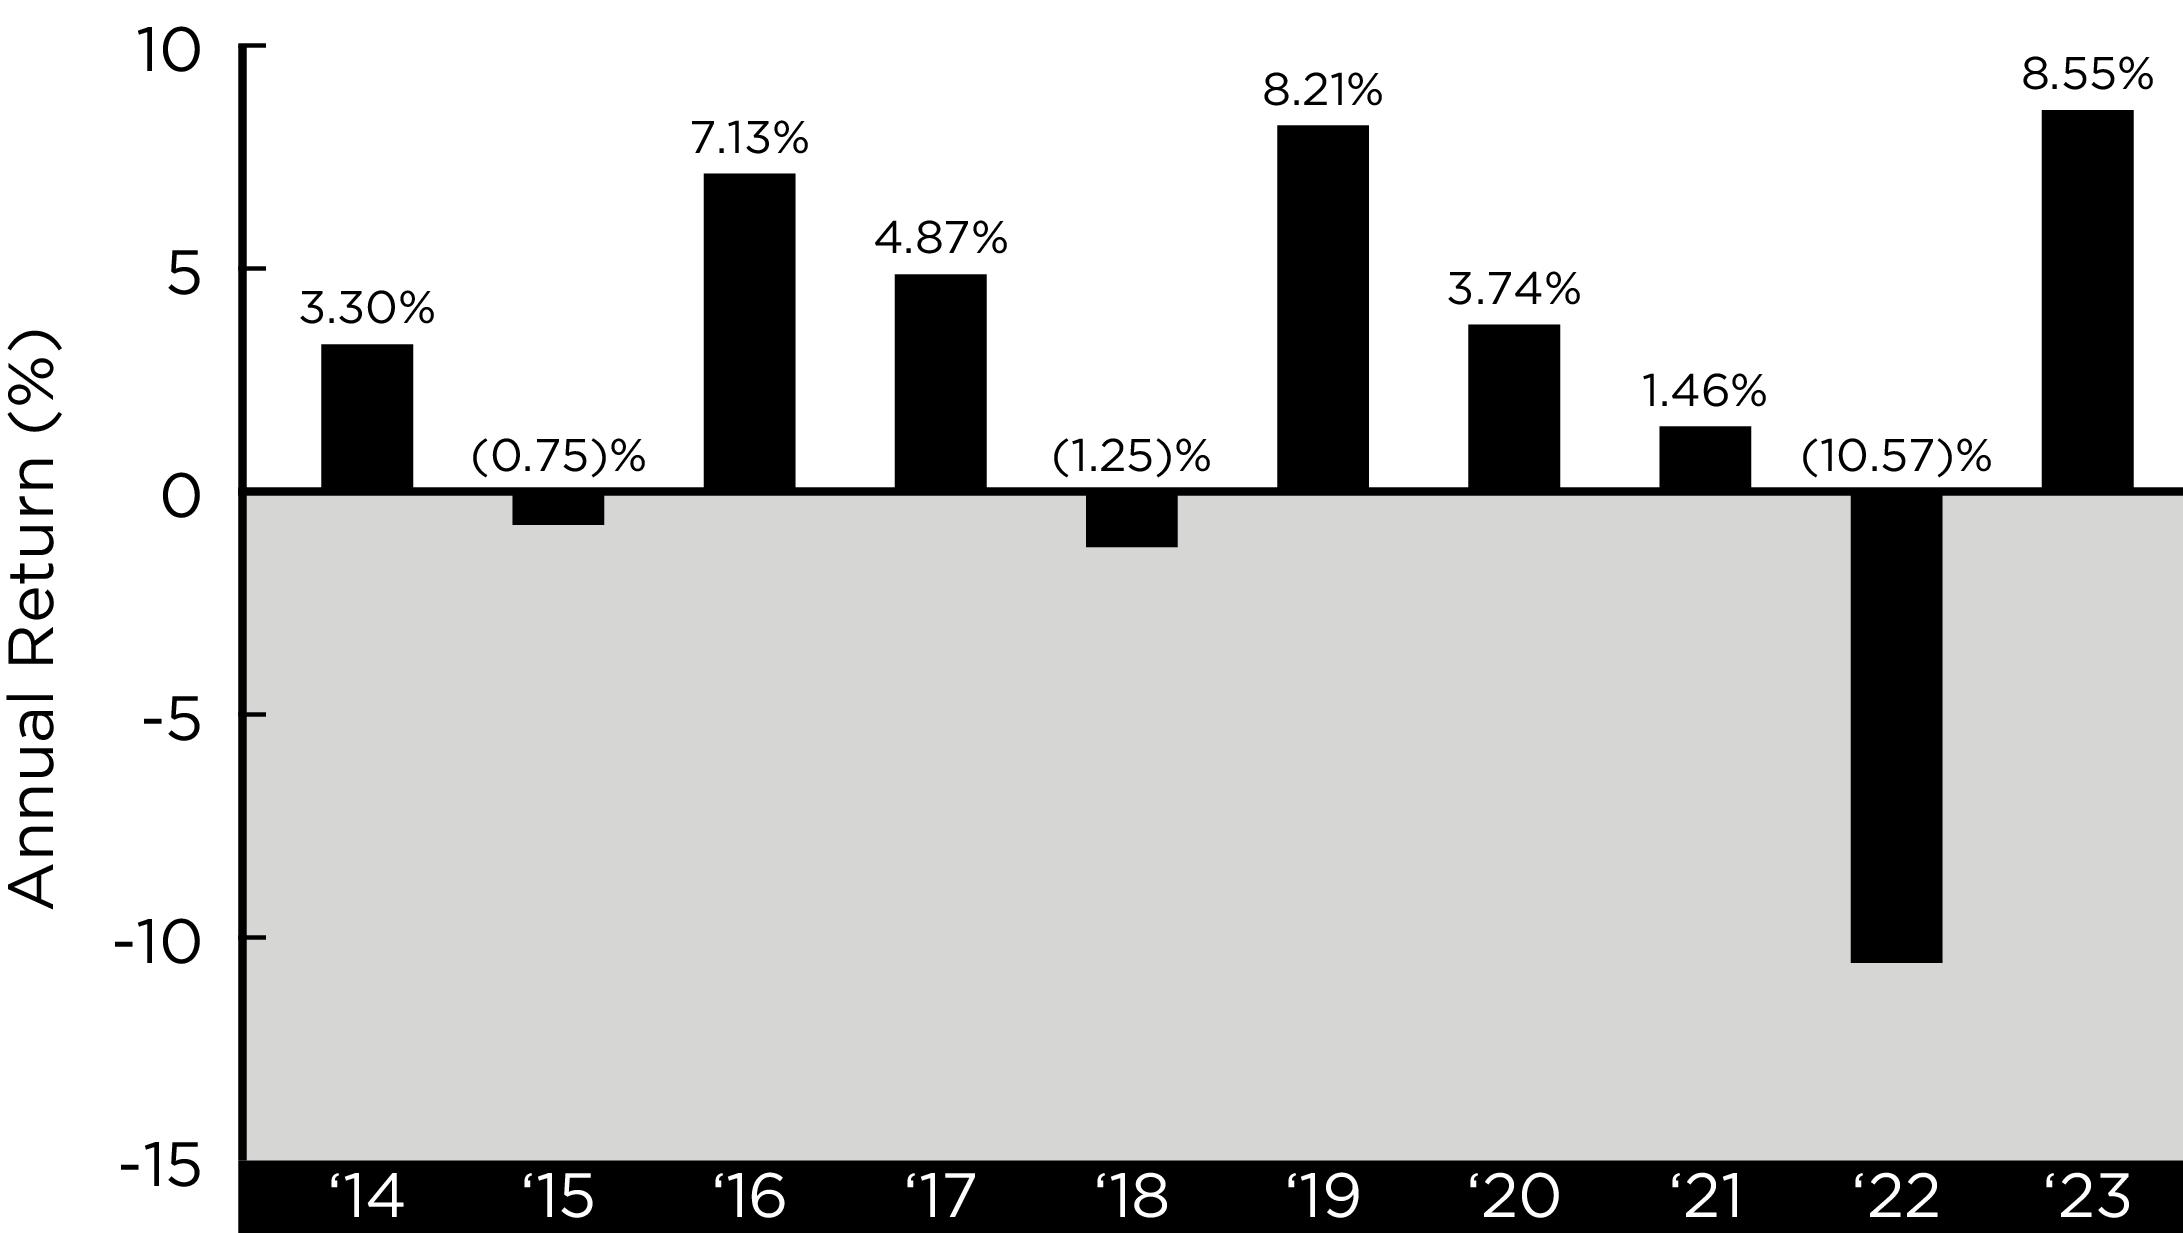
|
|
|
|
|
|
|
|
|
|
1
Year |
5
Years |
10
Years |
|
Class A
(before taxes) |
|
|
|
|
Class A
(after taxes on
distributions) |
|
( |
|
|
Class A
(after taxes on
distributions
and
redemptions) |
|
|
|
|
Class S
(before taxes) |
|
|
|
|
Bloomberg
U.S.
Mortgage-Backed
Securities
Index
(reflects
no deduction for
fees,
expenses or taxes) |
|
|
|
|
Bloomberg
U.S. High Yield
Ba/B 2%
Issuer Capped
Index
(reflects
no deduction for
fees,
expenses or taxes) |
|
|
|
Management
Investment
Adviser
The Fund is
managed by Thrivent Asset Management, LLC (“Thrivent Asset Mgt.” or the
“Adviser”).
Portfolio
Managers
The following individuals are jointly and primarily
responsible for the day-to-day management of the Fund:
|
Name
and Title |
Portfolio
Manager
of
the Fund Since |
|
Kent L.
White, CFA
Vice
President, Fixed Income Mutual
Funds |
May
2015 |
|
Stephen D.
Lowe, CFA
Chief
Investment Strategist |
February
2018 |
|
Theron G.
Whitehorn, CFA
Director
of Fixed Income Quantitative
Research |
February
2021 |
Purchase and Sale
of Fund Shares
You may purchase,
redeem or exchange shares of the Fund through certain broker-dealers. You also
may purchase Class S shares of the Fund directly from the Fund online at
thriventfunds.com.
The minimum
initial investment requirement for this Fund is $2,000 and the minimum
subsequent investment requirement is $50 for taxable accounts. For IRA or
tax-deferred accounts, the minimum initial investment requirement for this Fund
is $1,000 and the minimum subsequent investment requirement is $50. These
investment requirements may be different, however, for investors investing in
the Fund through an automatic investment plan or, for Class S shares, through
certain fee-based investment advisory programs.
You may purchase
or redeem Fund shares on days that the New York Stock Exchange is open. You may
conduct such transactions by mail, telephone 800-847-4836, the Internet
(thrivent.com or, for Class S shares, thriventfunds.com), the mobile app, by
wire/ACH transfer or through an automatic investment plan (for purchases) or a
systematic withdrawal plan (for redemptions), subject to certain
limitations.
Tax
Information
The Fund intends
to make distributions that may be taxed as ordinary income or capital gains.
Investing in the Fund through a retirement plan could have different tax
consequences.
Payments to
Broker-Dealers and Other Financial Intermediaries
If you purchase
the Fund through a broker-dealer or other financial intermediary (such as an
insurance company), the Fund and its related companies may pay the intermediary
for the sale of Fund shares and related services. These payments may create a
conflict of interest by influencing the broker-dealer or other intermediary and
your financial professional to recommend the Fund over another investment. Ask
your financial professional or visit your financial intermediary’s website for
more information.
93
Thrivent
Small Cap Growth Fund
Class
S: TSCGX
|
|
Class
S |
|
Maximum
Sales Charge (load) Imposed On
Purchases
(as a % of offering price) |
|
|
Maximum
Deferred Sales Charge (load) (as a % of
the net
asset value) |
|
|
|
Class
S |
|
Management
Fees |
|
|
Distribution
and Shareholder Service (12b-1) Fees |
|
|
Other
Expenses |
|
|
Total
Annual Fund Operating Expenses |
|
|
Less Fee
Waivers and/or Expense
Reimbursements1 |
|
|
Total
Annual Fund Operating Expenses After Fee
Waivers
and/or Expense Reimbursements |
|
1
The Adviser
has contractually agreed, through at least February 28,
2025 , to waive a portion of the
management fees associated with the Class S shares of the Thrivent
Small Cap Growth Fund in order to limit the Total Annual Fund Operating Expenses
After Fee Waivers and/or Expense Reimbursements to an annual rate of 0.95% of
the average daily net assets of the Class S shares. This contractual provision,
however, may be terminated before the indicated termination date upon the mutual
agreement between the Independent Trustees of the Fund and the
Adviser.
|
|
1
Year |
3
Years |
5
Years |
10
Years |
|
Class
S |
$ |
$ |
$ |
$ |
The Fund is
subject to the following principal investment risks, which you should review
carefully and in entirety. The Fund may
not
achieve its investment objective and you could lose money by investing in the
Fund.
94

|
|
|
|
|
|
|
|
95
|
|
|
|
Since
Inception |
|
|
1
Year |
5
Years |
|
|
Class S
(before taxes) |
|
|
|
|
Class S
(after taxes on
distributions) |
|
|
|
|
Class S
(after taxes on
distributions
and
redemptions) |
|
|
|
|
Russell
2000® Growth Index
(reflects
no deduction for
fees,
expenses or taxes) |
|
|
|
|
S&P
SmallCap® 600 Growth
Index
(reflects
no deduction for
fees,
expenses or taxes) |
|
|
|
Management
Investment
Adviser
The Fund is
managed by Thrivent Asset Management, LLC (“Thrivent Asset Mgt.” or the
“Adviser”).
Portfolio
Managers
The following individuals are jointly and primarily
responsible for the day-to-day management of the Fund:
|
Name
and Title |
Portfolio
Manager
of
the Fund Since |
|
Michael P.
Hubbard
Senior
Portfolio Manager |
November
2022 |
|
Patrick D.
Farley, CFA
Portfolio
Manager |
February
2024 |
Purchase and Sale
of Fund Shares
You may purchase,
redeem or exchange shares of the Fund directly from the Fund or through certain
broker-dealers.
The minimum
initial investment requirement for this Fund is $2,000 and the minimum
subsequent investment requirement is $50 for taxable accounts. For IRA or
tax-deferred accounts, the minimum initial investment requirement for this Fund
is $1,000 and the minimum subsequent investment requirement is $50. These
investment requirements may be different, however, for investors investing in
the Fund through an automatic investment plan or through certain fee-based
investment advisory programs.
You may purchase
or redeem Fund shares on days that the New York Stock Exchange is open. You may
conduct such transactions by mail, telephone 800-847-4836, the Internet
(thrivent.com or thriventfunds.com), the mobile app, by wire/ACH transfer or
through an automatic investment plan (for purchases) or a systematic withdrawal
plan (for redemptions), subject to certain limitations.
Tax
Information
The Fund intends
to make distributions that may be taxed as ordinary income or capital gains.
Investing in the Fund through a retirement plan could have different tax
consequences.
Payments to
Broker-Dealers and Other Financial Intermediaries
If you purchase
the Fund through a broker-dealer or other financial intermediary (such as an
insurance company), the Fund and its related companies may pay the intermediary
for the sale of Fund shares and related services. These payments may create a
conflict of interest by influencing the broker-dealer or other intermediary and
your financial professional to recommend the Fund over another investment. Ask
your financial professional or visit your financial intermediary’s website for
more information.
96
Thrivent
Small Cap Stock Fund
Class
S: TSCSX | Class A: AASMX
|
|
Class
S |
Class
A |
|
Maximum
Sales Charge (load) Imposed
On
Purchases (as a % of offering price) |
|
|
|
Maximum
Deferred Sales Charge (load)
(as a % of
the net asset value) |
|
|
|
|
Class
S |
Class
A |
|
Management
Fees |
|
|
|
Distribution
and Shareholder Service
(12b-1)
Fees |
|
|
|
Other
Expenses |
|
|
|
Total
Annual Fund Operating Expenses |
|
|
|
|
1
Year |
3
Years |
5
Years |
10
Years |
|
Class
S |
$ |
$ |
$ |
$ |
|
Class
A |
$ |
$ |
$ |
$ |
The Fund is
subject to the following principal investment risks, which you should review
carefully and in entirety. The Fund may
not
achieve its investment objective and you could lose money by investing in the
Fund.
97

|
|
|
|
|
|
|
|
|
|
1
Year |
5
Years |
10
Years |
|
Class A
(before taxes) |
|
|
|
|
Class A
(after taxes on
distributions) |
|
|
|
|
Class A
(after taxes on
distributions
and
redemptions) |
|
|
|
|
Class S
(before taxes) |
|
|
|
|
Russell
2000® Index
(reflects
no deduction for
fees,
expenses or taxes) |
|
|
|
|
S&P
SmallCap® 600 Index
(reflects
no deduction for
fees,
expenses or taxes) |
|
|
|
Management
Investment
Adviser
The Fund is
managed by Thrivent Asset Management, LLC (“Thrivent Asset Mgt.” or the
“Adviser”).
98
Portfolio
Managers
The following individuals are jointly and primarily
responsible for the day-to-day management of the Fund:
|
Name
and Title |
Portfolio
Manager
of
the Fund Since |
|
Matthew D.
Finn, CFA
Vice
President, Head of Equity Funds |
March
2013 |
|
James M.
Tinucci, CFA
Senior
Portfolio Manager |
February
2015 |
|
Katelyn R.
Young, CPA
Senior
Portfolio Manager |
February
2023 |
Purchase and Sale
of Fund Shares
You may purchase,
redeem or exchange shares of the Fund through certain broker-dealers. You also
may purchase Class S shares of the Fund directly from the Fund online at
thriventfunds.com.
The minimum
initial investment requirement for this Fund is $2,000 and the minimum
subsequent investment requirement is $50 for taxable accounts. For IRA or
tax-deferred accounts, the minimum initial investment requirement for this Fund
is $1,000 and the minimum subsequent investment requirement is $50. These
investment requirements may be different, however, for investors investing in
the Fund through an automatic investment
plan or, for Class
S shares, through certain fee-based investment advisory programs.
You may purchase
or redeem Fund shares on days that the New York Stock Exchange is open. You may
conduct such transactions by mail, telephone 800-847-4836, the Internet
(thrivent.com or, for Class S shares, thriventfunds.com), the mobile app, by
wire/ACH transfer or through an automatic investment plan (for purchases) or a
systematic withdrawal plan (for redemptions), subject to certain
limitations.
Tax
Information
The Fund intends
to make distributions that may be taxed as ordinary income or capital gains.
Investing in the Fund through a retirement plan could have different tax
consequences.
Payments to
Broker-Dealers and Other Financial Intermediaries
If you purchase
the Fund through a broker-dealer or other financial intermediary (such as an
insurance company), the Fund and its related companies may pay the intermediary
for the sale of Fund shares and related services. These payments may create a
conflict of interest by influencing the broker-dealer or other intermediary and
your financial professional to recommend the Fund over another investment. Ask
your financial professional or visit your financial intermediary’s website for
more information.
99
More
About Investment Strategies and Risks
Each Fund’s investment objective
and principal strategies are described in the “Summary Section” above. The
principal strategies are the strategies that a Fund’s Adviser
believes
are most likely to be
important in trying to achieve the Fund’s investment objective. Please note that
each Fund may also use strategies and invest in securities that are not
described in this prospectus, but that are described in the Statement of
Additional Information (the “SAI”).
This section
provides additional information about some of the securities and other practices
in which certain Funds may engage, along with their associated
risks.
Information About
Certain Principal Investment Strategies
Adjustable
Rate Securities. The interest rate
may be adjusted daily or at specified intervals (such as monthly, quarterly or
annually). Adjustments may be based on a referenced market rate for a specified
term (such as one, three or twelve months). For some securities, adjustments are
made by a third-party or auction process designed to maintain a market value
close to the security’s face amount. Adjustments may be limited by caps or
floors.
Some adjustable
rate securities are payable upon demand, which should reduce the volatility of
their market values. The right to demand payment may be exercisable after a
specified notice period (such as seven or thirty days) and only at specified
intervals (such as at the end of a calendar month or quarter). The right to
demand payment may terminate upon certain events (such as the issuer’s
insolvency).
So long as the
Adviser expects an adjustable rate security’s market value to approximate its
face value after each interest rate adjustment, the Adviser may rely on the
interest rate when calculating a Fund’s dollar-weighted average maturity or
duration. The market value of an adjustable rate security may nevertheless
decline, due to changes in market conditions or the financial condition of the
issuer and the effects of caps or floors on interest rate
adjustments.
Collateralized
Debt Obligations. Thrivent Limited
Maturity Bond Fund may invest in collateralized debt obligations (“CDOs”) as a
principal strategy; the other Funds may do so as a non-principal strategy. CDOs
are types of asset-backed securities. Collateralized loan obligations (“CLOs”)
are ordinarily issued by a trust or other special purpose entity and are
typically collateralized by a pool of loans, which may include, among others,
domestic and non-U.S. senior secured loans, senior unsecured loans, and
subordinate corporate loans, including loans that may be rated below investment
grade or equivalent unrated loans, held by such issuer. Normally, collateralized
bond obligations (“CBOs”), CLOs and other CDOs are privately offered and sold,
and thus are not registered under the securities laws. As a result, investments
in CDOs may be characterized by the Fund as illiquid
securities.
Derivatives. Derivatives, a
category that includes options, futures, swaps and hybrid instruments, are
financial instruments whose value derives from another security, an index, an
interest rate, or a currency. Each Fund may use derivatives for hedging
(attempting to
offset a potential loss in one position by establishing an interest in an
opposite position). This includes the use of currency-based derivatives for
hedging its positions in foreign securities. Each Fund may also use derivatives
to obtain investment exposure to a certain asset class or for speculation
(investing for potential income or capital gain).
While hedging can
guard against potential risks, using derivatives adds to the Fund’s expenses and
can eliminate some opportunities for gains. There is also a risk that a
derivative intended as a hedge may not perform as expected. For example, the
price or value of the underlying instrument, asset, index, currency or rate may
move in a different direction than expected or such movements may be of a
magnitude greater or less than expected.
Another risk with
derivatives is that some types can amplify a gain or loss, thereby creating
investment exposure greater than the initial investment. For example, futures
contracts, options on futures contracts, forward contracts, and options on
derivatives can allow the Fund to obtain large investment exposures in return
for meeting relatively small margin requirements. As a result, investments in
those transactions may be highly leveraged, and a Fund could potentially earn or
lose substantially more money than the actual cost (if any) incurred when the
derivative is entered into by a Fund. The use of leverage may cause the Fund to
liquidate portfolio positions when it may not be advantageous to do so to
satisfy its obligations. In addition, a derivative used for hedging or
replication may not accurately track the value of the underlying asset, index or
rate.
With some
derivatives, whether used for hedging, replication or speculation, there is also
the risk that the counterparty may fail to honor its contract terms, causing a
loss for a Fund. In addition, suitable derivative investments for hedging,
replication or speculative purposes may not be available.
Derivatives can be
difficult to value and illiquid, which means a Fund may not be able to close out
a derivatives transaction in a cost-efficient manner. Futures contracts are
subject to the risk that an exchange may impose price fluctuation limits, which
may make it difficult or impossible for a Fund to close out a position when
desired.
Hybrid instruments
(a type of potentially high-risk derivative) can combine the characteristics of
securities, futures, and options. For example, the principal amount, redemption,
or conversion terms of a security could be related to the market price of some
commodity, currency, or securities index. Such securities may bear interest or
pay dividends at below market or even relatively nominal rates. Under certain
conditions, the redemption value of a hybrid could be zero.
Emerging
Markets Securities. A security is
considered to be an “emerging market” security if issued by an issuer that Fund
management has determined meets one or more of the following
criteria:
•
is organized under
the laws of, or has its principal office in, an emerging market
country;
•
has its principal
securities trading market in an emerging market country; and/or
•
derives a majority
of its annual revenue or earnings or assets
100
from goods
produced, sales made or services performed in an emerging market
country.
An “emerging market” country is
any country determined by the Adviser to have an emerging market economy,
considering factors such as the country’s credit rating, its political and
economic stability and the development of its financial and capital markets.
These emerging market countries include every nation in the world except the
U.S., Canada, Israel, Japan, Australia, New Zealand, Hong Kong, Singapore and
all nations typically considered part of Western Europe.
Exchange Traded
Funds. An ETF is an
investment company that trades on a securities exchange and holds a portfolio of
investments. An ETF that is designed to track an index or benchmark may fail to
do so accurately and may trade at a discount to its net asset value. Other ETFs
are actively managed and instead of tracking a particular index or benchmark
they seek to outperform it.
Generally, investments in other
investment companies (including ETFs) are subject to statutory limitations
prescribed by the Investment Company Act of 1940, as amended (the “1940 Act”),
and the rules thereunder. These limitations include a prohibition on a Fund
acquiring more than 3% of the voting shares of any other investment company, and
a prohibition on investing more than 5% of the Fund’s total assets in the
securities of any one investment company or more than 10% of its total assets,
in the aggregate, in investment company securities. Rule 12d1-4 under the 1940
Act permits a Fund to invest in other investment companies beyond the statutory
limits, subject to certain conditions.
Foreign
Currency Transactions. The Funds may
conduct foreign currency exchange transactions, normally either on a spot
(i.e., cash) basis at
the spot rate prevailing in the foreign currency exchange market, or through
entering into forward contracts to purchase or sell foreign currencies. The
value of a Fund’s assets as measured in U.S. dollars may be affected favorably
or unfavorably by changes in currency exchange rates and exchange control
legislation. The Funds will generally not enter into a forward contract with a
term greater than one year.
Under unusual
circumstances, certain Funds may commit substantial assets to the consummation
of these contracts. Although forward contracts may be used to protect a Fund
from adverse currency movements, they also involve the risk that anticipated
currency movements will not be accurately predicted, and the Fund’s total
returns could be adversely affected as a result.
There are some
markets where it is not possible to engage in effective foreign currency
hedging. This is generally true, for example, for the currencies of various
emerging markets where the foreign exchange markets are not sufficiently
developed to permit hedging activity to take place.
Foreign
Securities. Foreign
securities are generally more volatile than their domestic counterparts, in part
because of the potential for higher political and economic risks, lack of
reliable information and fluctuations in currency exchange rates where
investments are denominated in currencies other than the U.S. dollar. These
risks are usually higher in less developed countries. Each of the Funds, except
Thrivent Money Market Fund, may use foreign currencies and related instruments,
including foreign currency exchange transactions, to hedge its foreign
investments.
In addition,
foreign securities may be more difficult to resell and less liquid than
comparable U.S. securities because the markets
for foreign
securities are less efficient. Even where a foreign security increases in price
in its local currency, the appreciation may be diluted by the negative effect of
exchange rates when the security’s value is converted to U.S. dollars. Foreign
withholding taxes also may apply and errors and delays may occur in the
settlement process for foreign securities.
Government
Bonds and Municipal Bonds. Each of the Funds
may invest in government bonds and municipal bonds. As a result, the Fund’s
performance may be affected by political and economic conditions at the state,
regional or Federal level. These may include budgetary problems, declines in the
tax base or changes in federal income tax laws or rates and other factors that
may cause rating agencies to downgrade the credit ratings on certain
issues.
High
Yield Bonds. High yield bonds
are debt securities rated below BBB- by S&P or Fitch, or Baa3 by Moody’s, or
unrated securities deemed to be of comparable quality by the Adviser. To the
extent that a Fund invests in high yield bonds, it takes on the following
risks:
•
The risk of a
bond’s issuer defaulting on principal or interest payments is greater than on
higher quality bonds.
•
Issuers of high
yield bonds are less secure financially and are more likely to be hurt by
interest rate increases and declines in the health of the issuer or the
economy.
•
High yield
securities generally have a less liquid resale market.
International
Exposure. Many U.S.
companies in which the Funds may invest generate significant revenues and
earnings from abroad. As a result, these companies and the prices of their
securities may be affected by weaknesses in global and regional economies and
the relative value of foreign currencies to the U.S. dollar. These factors,
taken as a whole, could adversely affect the performance of a
Fund.
Mortgage-Backed
and Asset-Backed Securities.
Mortgage-backed
securities are securities that are backed by pools of mortgages and which pay
income based on the payments of principal and income they receive from the
underlying mortgages. Asset-backed securities are similar but are backed by
other assets, such as pools of consumer loans. Both are sensitive to interest
rate changes as well as to changes in the repayment patterns of the underlying
securities. If the principal payment on the underlying asset is repaid faster or
slower than the holder of the mortgage-backed or asset-backed security
anticipates, the price of the security may fall, especially if the holder must
reinvest the repaid principal at lower rates or must continue to hold the
securities when interest rates rise.
Real
Estate Investment Trusts (“REITs”). REITs generally
can be divided into three types: equity REITs, mortgage REITs and hybrid REITs
(which combine the characteristics of equity REITs and mortgage REITs). Equity
REITs will be affected by changes in the values of and incomes from the
properties they own, while mortgage REITs may be affected by the credit quality
of the mortgage loans they hold. All types of REITs may be affected by changes
in interest rates. The effect of rising interest rates is generally more
pronounced for high dividend paying securities such as REITs. This may cause the
value of real estate securities to decline during periods of rising interest
rates, which would reduce the overall return of the Fund. REITs are subject to
other risks as well, including the fact that REITs are dependent on specialized
management skills which may affect their ability to generate cash flow for
operating purposes and to make distributions to shareholders or unitholders.
REITs may have
101
limited
diversification and are subject to the risks associated with obtaining financing
for real property. A REIT can pass its income through to shareholders or
unitholders without any tax at the entity level if it complies with various
requirements under the Internal Revenue Code. There is the risk that a REIT held
by a Fund will fail to qualify for this tax-free pass-through treatment of its
income. By investing in REITs indirectly through a Fund, in addition to bearing
a proportionate share of the expenses of the Fund, you will also indirectly bear
similar expenses of the REITs in which the Fund invests.
Securities
Ratings. When fixed-income
securities are rated by one or more independent rating agencies, a Fund uses
these ratings to determine bond quality. Investment grade bonds are those that
are rated at or above the BBB- rating category by S&P or Fitch, or the Baa3
rating category by Moody’s, or unrated but considered of equivalent quality by
the Fund’s adviser. High-yield bonds are below investment grade bonds in terms
of quality.
In cases where a
bond is rated in conflicting categories by different rating agencies, a Fund
(other than Thrivent Money Market Fund) may choose to follow the higher rating.
If a bond is unrated, the Fund may assign it to a given category based on its
own credit research. If a rating agency downgrades a security, the market price
and liquidity of such security may be adversely affected and the Fund will
determine whether to hold or sell the security, depending on all of the facts
and circumstances at that time.
Information About
Certain Non-Principal Investment Strategies
Defensive
Investing. In response to
market, economic, political or other conditions, each Fund (other than the Money
Market Fund) may invest without limitation in cash, preferred stocks, or
investment-grade debt securities for temporary defensive purposes that are not
part of the Fund’s principal investment strategies. The Money Market Fund may,
from time to time, take temporary defensive positions by holding cash or
shortening the Fund’s dollar-weighted average portfolio maturity. If the Fund
does this, different factors could affect the Fund’s performance and it may not
achieve its investment objective.
Illiquid
Investments. A Fund
may not acquire an illiquid investment if, immediately after the acquisition,
the Fund would have invested more than 15% of its net assets (5% of net assets
for Thrivent Money Market Fund subject to money market fund requirements) in
“illiquid investments” that are assets. An illiquid investment is an investment
that a Fund reasonably expects cannot be sold or disposed of in current market
conditions in seven calendar days or less without the sale or disposition
significantly changing the market value of the investment (for the Money Market
Fund, an illiquid security is a security that cannot be sold or disposed of in
the ordinary course of business within seven calendar days at approximately the
value ascribed to it by the Fund). Any securities that are thinly traded or
whose resale is restricted can be difficult to sell at a desired time and price.
Some of these securities are new and complex, and trade only among institutions.
The markets for these securities are still developing and may not function as
efficiently as established markets. Certain Funds may make investments in
private equity funds or securities that do not trade on public exchanges. These
securities are typically less liquid and more difficult to value.
Owning a large
percentage of illiquid investments could hamper a Fund’s ability to raise cash
to meet redemptions. Also, because there may not be an established market price
for these securities,
a Fund may have to
estimate their value, which means that their valuation (and, to a much smaller
extent, the valuation of the Fund) may have a subjective element.
Initial
Public Offerings. Each of the Funds
may purchase securities in initial public offerings (IPOs) of securities. IPOs
issued by unseasoned companies with little or no operating history are risky and
their prices are highly volatile, but they can result in very large gains in
their initial trading. Thus, when the Fund’s size is smaller, any gains from
IPOs will have an exaggerated impact on the Fund’s reported performance than
when the Fund is larger. Attractive IPOs are often oversubscribed and may not be
available to the Fund, or only in very limited quantities. There can be no
assurance that a Fund will have favorable IPO investment
opportunities.
In-Kind
Purchases. The Funds may
purchase shares of affiliated Funds through in-kind contributions of portfolio
securities held by the Fund, according to procedures adopted by the Funds’ Board
of Trustees (the “Board”) and subject to applicable regulatory requirements. The
procedures generally require, among other things, that the in-kind contribution
does not favor the Fund making the contribution over any other shareholder in
the receiving Fund and the contribution is in the best interests of the
affiliated Fund receiving the in-kind contribution. The securities contributed
must be valued according to the receiving Fund’s valuation procedures and be of
the appropriate type and amount for investment by the Fund receiving the
contribution. If these procedures are not followed or the shares purchased
decline in value, it could adversely affect the price of Fund
shares.
Securities
Lending. Each of the Funds
except Thrivent Money Market Fund may seek additional income by lending Fund
securities to qualified institutions. By reinvesting any cash collateral it
receives in these transactions, a Fund could realize additional gains or losses.
If the borrower fails to return the securities and the invested collateral has
declined in value, the Fund could lose money.
Short-Term
Trading. The investment
strategy for each Fund at times may include short-term trading. While a Fund
ordinarily does not trade securities for short-term profits, it will sell any
security at any time it believes best, which may result in short-term
trading.
Unusual
Opportunities. Each
of the Funds may purchase some securities that do not meet its normal investment
criteria when the Adviser perceives an unusual opportunity for gain, which could
include a variety of factors, including a change in management, an extraordinary
corporate event, or a temporary imbalance in the supply of or demand for the
securities.
When-Issued
Securities. A Fund may invest
in securities prior to their date of issue. These securities could fall in value
by the time they are actually issued, which may be any time from a few days to
over a year. In addition, no income will be earned on these securities until
they are actually delivered.
Zero
Coupons. A zero coupon
security is a debt security that does not make cash interest payments for some
or all of its life. Instead, it is sold and traded at a discount to its face
value. The interest consists of the gradual appreciation in price as the bond
approaches maturity and is reported as income to a Fund that has purchased the
security. The Fund is required to distribute to shareholders an amount equal to
the amount of income reported to the Fund even though such income may not be
received by the Fund as distributable cash. The shareholder distributions may
require the Fund to liquidate Fund securities at a
102
disadvantageous
time and incur a loss. Zero coupon bonds can be higher- or lower-quality debt
and are more volatile than coupon bonds.
Glossary of
Principal Risks
The main risks associated with
investing in each Fund are summarized in each Fund’s respective “Summary
Section” above. More detailed descriptions of risks are provided below in
alphabetical order for ease of reference. Additional risks are described in the
SAI.
Allocation
Risk.
Certain Funds’ investment performance depends upon how its assets are allocated
across broad asset categories and applicable sub-classes within such categories.
Some broad asset categories and sub-classes may perform below expectations or
the securities markets generally over short and extended periods. For example,
underperformance in the equity or debt markets could have a material adverse
effect on a Fund’s total return if it has a significant allocation to those
types of securities. Therefore, a principal risk of investing in the Fund is
that the allocation strategies used and the allocation decisions made will not
produce the desired results.
Closed-End
Fund (“CEF”) Risk. Investments in
CEFs are subject to various risks, including reliance on management’s ability to
meet a CEF’s investment objective and to manage a CEF’s portfolio; fluctuation
in the market value of a CEF’s shares compared to the changes in the value of
the underlying securities that the CEF owns (i.e., trading at a discount or
premium to its net asset value); and that CEFs are permitted to invest in a
greater amount of “illiquid” securities than typical mutual funds. A Fund is
subject to a pro-rata share of the management fees and expenses of each CEF in
addition to the Fund’s management fees and expenses, resulting in Fund
shareholders subject to higher expenses than if they invested directly in
CEFs.
Collateralized
Debt Obligations (“CDO”) Risk. The risks of an
investment in a CDO depend largely on the quality and type of the collateral and
the tranche of the CDO in which a Fund invests. In addition to the typical risks
associated with fixed income securities and asset-backed securities, CDOs carry
additional risks including, but not limited to: (i) the possibility that
distributions from collateral securities will not be adequate to make interest
or other payments; (ii) the risk that the collateral may default, decline in
value, and/or be downgraded; (iii) the Fund may invest in tranches of CDOs that
are subordinate to other tranches; (iv) the structure and complexity of the
transaction and the legal documents could lead to disputes among investors
regarding the characterization of proceeds; (v) the investment return achieved
by the Fund could be significantly different than those predicted by financial
models; (vi) the lack of a readily available secondary market for CDOs; (vii)
risk of forced “fire sale” liquidation due to technical defaults such as
coverage test failures; and (viii) the CDO’s manager may perform poorly. In
addition, investments in CDOs may be characterized by the Fund as illiquid
securities.
Conflicts of
Interest Risk. An
investment in the Funds is subject to a number of actual or potential conflicts
of interest. The following does not purport to be a comprehensive list or
complete explanation of all potential conflicts of interest which may affect the
Funds. A Fund may encounter circumstances, or enter into transactions, in which
conflicts of interest may arise, which are not listed or discussed
below.
The Adviser or its
affiliates may provide services to the Funds for which the Funds would
compensate the Adviser and/or such affiliates. The Funds may invest in other
pooled investment vehicles sponsored, managed, or otherwise affiliated with the
Adviser, including other Funds. The Adviser may have an incentive (financial or
otherwise) to enter into transactions or arrangements on behalf of the Fund with
itself or its affiliates in circumstances where it might not have done so
otherwise.
The Adviser or its
affiliates manage other investment funds and/or accounts (including proprietary
accounts) and have other clients with investment objectives and strategies that
are similar to, or overlap with, the investment objective and strategy of a
Fund, creating conflicts of interest in investment and allocation decisions
regarding the allocation of investments that could be appropriate for the Fund
and other clients of the Adviser or their affiliates. The Adviser and its
affiliates have no obligation to make available any information regarding their
proprietary activities or strategies, or the activities or strategies used for
other funds and/or accounts managed by them, for the benefit of the management
of the Funds. No affiliate of the Adviser is under any obligation to share any
investment opportunity, including an investment technique, idea, model or
strategy, with the Funds. The portfolio compositions and performance results
therefore will differ across the Funds and other such funds and/or accounts.
These conflicts of interest are exacerbated to the extent that the Adviser’s
other clients are proprietary or pay them higher fees or performance-based fees.
Further, the activities in which the Adviser and its affiliates are involved on
behalf of other accounts could limit or preclude the flexibility that the Funds
could otherwise have to participate in certain investments.
Convertible
Securities Risk. Convertible
securities are subject to the usual risks associated with debt securities, such
as interest rate risk and credit risk. Convertible securities also react to
changes in the value of the common stock into which they convert, and are thus
subject to market risk. A Fund may also be forced to convert a convertible
security at an inopportune time, which may decrease the Fund’s
return.
Credit
Risk.
Credit risk is the risk that an issuer of a debt security to which the Fund is
exposed may no longer be able or willing to pay its debt. As a result of such an
event, the debt security may decline in price and affect the value of a Fund.
Similarly, there is a risk that the value of a debt security may decline because
of concerns about the issuer’s ability or willingness to make interest and/or
principal payments. Debt securities are subject to varying degrees of credit
risk, which are often reflected in credit ratings. The credit rating of a debt
security may be lowered if the issuer suffers adverse changes in its financial
condition, which can lead to more volatility in the price of the security and in
shares of the Fund.
Cybersecurity
Risk. The Funds and
their service providers may be susceptible to operational, information security,
privacy, fraud, business disruption, and related risks. In general, cyber
incidents can result from deliberate attacks or unintentional events.
Cyber-attacks include, but are not limited to, gaining unauthorized access to
digital systems to misappropriate assets or sensitive information, corrupt data,
or otherwise disrupt operations. Cyber incidents affecting the
Adviser
or other service
providers (including, but not limited to, fund accountants, custodians, transfer
agents, and financial intermediaries) have the ability to disrupt and impact
business operations, potentially resulting in financial losses, by interfering
with the Funds’ ability to calculate their NAV, corrupting data or preventing
parties from sharing information necessary for the Funds’ operation,
103
preventing or slowing trades,
stopping shareholders from making transactions, potentially subjecting the Funds
or the Adviser to regulatory fines and penalties, and creating additional
compliance costs. Similar types of cybersecurity risks are also present for
issuers or securities in which the Funds may invest, which could result in
material adverse consequences for such issuers and may cause the Funds’
investments in such companies to lose value. While the Funds’ service providers
have established business continuity plans in the event of such cyber incidents,
there are inherent limitations in such plans and systems. Additionally, the
Funds cannot control the cybersecurity plans and systems put in place by their
service providers or any other third parties whose operations may affect the
Funds or their shareholders. Although each Fund attempts to minimize such
failures through controls and oversight, it is not possible to identify all of
the operational risks that may affect a Fund or to develop processes and
controls that completely eliminate or mitigate the occurrence of such failures
or other disruptions in service. The value of an investment in a Fund’s shares
may be adversely affected by the occurrence of the operational errors or
failures or technological issues or other similar events and a Fund and its
shareholders may bear costs tied to these risks.
Derivatives
Risk.
The use of derivatives (such as futures, options, credit default swaps, and
total return swaps) involves additional risks and transaction costs which could
leave a Fund in a worse position than if it had not used these instruments.
Changes in the value of the derivative may not correlate as intended with the
underlying asset, rate or index, and a Fund could lose much more than the
original amount invested. Derivatives can be highly volatile, illiquid and
difficult to value. Derivatives are also subject to the risk that the other
party in the transaction will not fulfill its contractual
obligations.
Some derivatives
may give rise to a form of economic leverage and may expose the Fund to greater
risk and increase its costs. Such leverage may cause the Fund to liquidate
portfolio positions when it may not be advantageous to do so to satisfy its
obligations. Increases and decreases in the value of the Fund’s portfolio will
be magnified when the Fund uses leverage. Futures contracts, options on futures
contracts, forward contracts, and options on derivatives can allow the Fund to
obtain large investment exposures in return for meeting relatively small margin
requirements. As a result, investments in those transactions may be highly
leveraged.
The success of a
Fund’s derivatives strategies will depend on the Adviser’s ability to assess and
predict the impact of market or economic developments on the underlying asset,
index or rate and the derivative itself, without the benefit of observing the
performance of the derivative under all possible market conditions. Swap
agreements may involve fees, commissions or other costs that may reduce a Fund’s
gains from a swap agreement or may cause a Fund to lose money. Futures contracts
are subject to the risk that an exchange may impose price fluctuation limits,
which may make it difficult or impossible for a Fund to close out a position
when desired.
Emerging
Markets Risk. The risks and
volatility of investing in foreign securities is increased in connection with
investments in emerging markets. The economic, political and market structures
of developing countries in emerging markets, in most cases, are not as strong as
the structures in the U.S. or other developed countries in terms of wealth,
stability, liquidity and transparency. A Fund may not achieve its investment
objective and portfolio performance will likely be negatively affected by
portfolio exposure to countries and corporations domiciled in, or with
revenue exposures
to, countries in the midst of, among other things, hyperinflation, currency
devaluation, trade disagreements, sudden political upheaval or interventionist
government policies, and the risks of such events are heightened within emerging
market countries. Fund performance may also be negatively affected by portfolio
exposure to countries and corporations domiciled in, or with revenue exposures
to, countries with less developed or unreliable legal, tax, regulatory,
accounting, recordkeeping and corporate governance systems and standards. In
particular, there may be less publicly available and transparent information
about issuers in emerging markets than would be available about issuers in more
developed capital markets because such issuers may not be subject to accounting,
auditing and financial reporting standards and requirements comparable to those
to which U.S. companies are subject. Emerging markets may also have differing
legal systems, many of which provide fewer security holder rights and practical
remedies to pursue claims than are available for securities of companies in the
U.S. or other developed countries, including class actions or fraud claims.
Significant buying or selling actions by a few major investors may also heighten
the volatility of emerging market securities.
Some emerging
market countries restrict to varying degrees foreign investment in their
securities markets. In some circumstances, these restrictions may limit or
preclude investment in certain countries or may increase the cost of investing
in securities of particular companies.
Equity Security
Risk. Equity
securities held by a Fund may decline significantly in price, sometimes rapidly
or unpredictably, over short or extended periods of time, and such declines may
occur because of declines in the equity market as a whole, or because of
declines in only a particular country, company, industry, or sector of the
market. From time to time, the Fund may invest a significant portion of its
assets in one particular sector, industry, or geographic region which would make
the Fund more vulnerable to adverse developments affecting such sectors,
industries, or geographic regions. Equity securities are generally more volatile
than most debt securities. The prices of individual stocks generally do not all
move in the same direction at the same time. Certain Funds may invest in private
equity funds, which are less liquid and more difficult to value than publicly
traded equity securities. A variety of factors can negatively affect the price
of a particular company’s stock. These factors may include, but are not limited
to: poor earnings reports, a loss of customers, litigation against the company,
general unfavorable performance of the company’s sector or industry, or changes
in government regulations affecting the company or its
industry.
ETF
Risk.
An ETF is subject to the risks of the underlying investments that it holds. For
index-based ETFs, while such ETFs seek to achieve the same returns as a
particular market index, the performance of an ETF may diverge from the
performance of such index (commonly known as tracking error). ETFs are subject
to fees and expenses (like management fees and operating expenses) and a Fund
will indirectly bear its proportionate share of any such fees and expenses paid
by the ETFs in which it invests. A Fund may exchange shares of an ETF “in kind”
for the underlying securities, which may result in transaction costs and
brokerage commissions. In addition, ETF shares may trade at a premium or
discount to their net asset value and investors may fail to bring the trading
price in line with the underlying shares (known as the arbitrage mechanism). As
ETFs trade on an exchange, they are subject to the risks of any exchange-traded
instrument, including: (i) an active trading market for its shares
104
may not develop or
be maintained, (ii) trading of its shares may be halted by the exchange, and
(iii) its shares may be delisted from the exchange. There is the possibility
that an ETF may experience a lack of liquidity that can result in greater
volatility than its underlying securities.
Financial
Sector Risk. Companies in the
financial sector of an economy are subject to extensive governmental regulation
and intervention, which may adversely affect the scope of their activities, the
prices they can charge, the amount of capital they must maintain and,
potentially, their size. Governmental regulation may change frequently and may
have significant adverse consequences for companies in the financial sector,
including effects not intended by such regulation. The impact of recent or
future regulation in various countries of any individual financial company or of
the financial sector as a whole cannot be predicted. Certain risks may impact
the value of investments in the financial sector more severely than those of
investments outside this sector, including the risks associated with companies
that operate with substantial financial leverage. Companies in the financial
sector may also be adversely affected by increases in interest rates and loan
losses, decreases in the availability of money or asset valuations, credit
rating downgrades and adverse conditions in other related markets. Insurance
companies, in particular, may be subject to severe price competition and/or rate
regulation, which may have an adverse impact on their profitability. During the
financial crisis that began in 2007, the deterioration of the credit markets
impacted a broad range of mortgage, asset-backed, auction rate, sovereign debt
and other markets, including U.S. and non-U.S. credit and interbank money
markets, thereby affecting a wide range of financial institutions and markets.
During the financial crisis, a number of large financial institutions failed,
merged with stronger institutions or had significant government infusions of
capital. Instability in the financial markets caused certain financial companies
to incur large losses. Some financial companies experienced declines in the
valuations of their assets, took actions to raise capital (such as the issuance
of debt or equity securities), or even ceased operations. Some financial
companies borrowed significant amounts of capital from government sources. Those
actions caused the securities of many financial companies to decline in value.
The financial sector is particularly sensitive to fluctuations in interest
rates. The financial sector is also a target for cyber attacks and may
experience technology malfunctions and disruptions. In recent years, cyber
attacks and technology failures have become increasingly frequent and have
caused significant losses.
Foreign
Currency Risk. The Fund is also
subject to the risk that the value of a foreign currency may decline against the
U.S. dollar, which would reduce the dollar value of securities denominated in
that currency. The overall impact of such a decline of foreign currency can be
significant, unpredictable, and long lasting, depending on the currencies
represented, how each one appreciates or depreciates in relation to the U.S.
dollar, and whether currency positions are hedged. Under normal conditions, the
Fund does not engage in extensive foreign currency hedging programs. Further,
exchange rate movements are volatile, and it is not possible to effectively
hedge the currency risks of many developing countries.
Foreign
Securities Risk. To the extent a
Fund is exposed to foreign securities, it is subject to various risks associated
with such securities. Foreign securities are generally more volatile than their
domestic counterparts, in part because of potential for higher political and
economic risks, lack of reliable information
and fluctuations
in currency exchange rates where investments are denominated in currencies other
than the U.S. dollar. Certain events in foreign markets may adversely affect
foreign and domestic issuers, including interruptions in the global supply
chain, market closures, war, terrorism, natural disasters and outbreak of
infectious diseases. Foreign securities also may be more difficult to resell
than comparable U.S. securities because the markets for foreign securities are
often less liquid. Even when a foreign security increases in price in its local
currency, the appreciation may be diluted by adverse changes in exchange rates
when the security’s value is converted to U.S. dollars. Foreign withholding
taxes also may apply and errors and delays may occur in the settlement process
for foreign securities.
Securities of
foreign companies in which the Fund invests generally carry more risk than
securities of U.S. companies. The economies and financial markets of certain
regions—such as Latin America, Asia, Europe and the Mediterranean region—can be
highly interdependent and may decline at the same time. Certain European
countries in which a Fund may invest have recently experienced significant
volatility in financial markets and may continue to do so in the future. The
potential departure of one or more countries from the European Union, such as
the United Kingdom’s departure from the European Union (“EU”) (commonly known as
“Brexit”), may have significant political and financial consequences for global
markets and may adversely impact Fund performance. The long-term impact of
Brexit is unknown and the risks related to Brexit could be more pronounced if
one or more additional EU member states seek to leave the EU.
Other risks result
from the varying stages of economic and political development of foreign
countries; the differing regulatory environments, trading days, and accounting
standards of foreign markets; and higher transaction costs. The Fund’s
investment in any country could be subject to governmental actions such as
capital or currency controls, nationalizing a company or industry, expropriating
assets, or imposing punitive taxes that would have an adverse effect on security
prices and impair the Fund’s ability to repatriate capital or
income.
Futures
Contract Risk. The value of a
futures contract tends to increase and decrease in tandem with the value of the
underlying instrument. The price of futures can be highly volatile; using them
could lower total return, and the potential loss from futures can exceed the
Fund’s initial investment in such contracts. In addition, the value of the
futures contract may not accurately track the value of the underlying
instrument.
Government
Securities Risk. Certain Funds
invest in securities issued or guaranteed by the U.S. government or its agencies
and instrumentalities (such as Ginnie Mae, Fannie Mae or Freddie Mac
securities). Securities issued or guaranteed by Ginnie Mae, Fannie Mae or
Freddie Mac are not issued directly by the U.S. government. Ginnie Mae is a
wholly owned U.S. corporation that is authorized to guarantee, with the full
faith and credit of the U.S. government, the timely payment of principal and
interest of its securities. By contrast, securities issued or guaranteed by U.S.
government-related organizations such as Fannie Mae and Freddie Mac are not
backed by the full faith and credit of the U.S. government. No assurance can be
given that the U.S. government would provide financial support to its agencies
and instrumentalities if not required to do so by law. In addition, the value of
U.S. government securities may be affected by changes in the credit rating of
the U.S. government, which may be negatively impacted by rising levels of
indebtedness. It is
105
possible that
issuers of U.S. government securities will not have the funds to meet their
payment obligations in the future.
Growth
Investing Risk. Growth style
investing includes the risk of investing in securities whose prices historically
have been more volatile than other securities, especially over the short term.
Growth stock prices reflect projections of future earnings or revenues and, if a
company’s earnings or revenues fall short of expectations, its stock price may
fall dramatically. Growth stocks may lack dividends that could help cushion
prices in a declining market. Growth style investing may be out of favor with
investors from time to time and growth stocks may underperform the securities of
other companies or the stock market in general.
High
Yield Risk. High yield
securities - commonly known as “junk bonds” - are considered predominantly
speculative with respect to the issuer’s continuing ability to make principal
and interest payments. If the issuer of the security is in default with respect
to interest or principal payments, the value of the Fund may be negatively
affected. High yield securities may be more susceptible to real or perceived
adverse economic conditions than investment grade securities, and they generally
have more volatile prices and carry more risk to principal. In addition, high
yield securities generally are less liquid than investment grade
securities.
Inflation-Linked
Security Risk. Inflation-linked
debt securities, such as TIPS, are subject to the effects of changes in market
interest rates caused by factors other than inflation (real interest rates). In
general, the price of an inflation-linked security tends to decrease when real
interest rates increase and can increase when real interest rates decrease.
Interest payments on inflation-linked securities are unpredictable and will
fluctuate as the principal and interest are adjusted for inflation. Any increase
in the principal amount of an inflation-linked debt security will be considered
taxable ordinary income, even though the Fund will not receive the principal
until maturity.
There can also be
no assurance that the inflation index used will accurately measure the real rate
of inflation in the prices of goods and services. The Fund’s investments in
inflation-linked securities may lose value in the event that the actual rate of
inflation is different than the rate of the inflation index. In addition,
inflation-linked securities are subject to the risk that the Consumer Price
Index for All Urban Consumers (CPI-U) or other relevant pricing index may be
discontinued, fundamentally altered in a manner materially adverse to the
interests of an investor in the securities, altered by legislation or Executive
Order in a materially adverse manner to the interests of an investor in the
securities or substituted with an alternative index.
Interest
Rate Risk. Interest rate
risk is the risk that prices of debt securities decline in value when interest
rates rise for debt securities that pay a fixed rate of interest. Debt
securities with longer durations or maturities tend to be more sensitive to
changes in interest rates than debt securities with shorter durations or
maturities. Changes in general economic conditions, inflation, and monetary
policies, such as certain types of interest rate changes by the Federal Reserve,
could affect interest rates and the value of some securities. The Fund may be
subject to a greater risk of rising interest rates during periods of low
interest rates or when inflation rates are high or rising.
Investing-in-Funds
Risk.
Each of the Thrivent Aggressive Allocation Fund, Thrivent Moderate Allocation
Fund, Thrivent Moderately Aggressive Allocation Fund and Thrivent Moderately
Conservative Allocation Fund (each, a “Thrivent Asset Allocation Fund”) allocate
their assets among certain other funds managed
by the Adviser or
an affiliate (“Affiliated Funds”). From time to time, one or more of the
Affiliated Funds may experience relatively large investments or redemptions due
to reallocations or rebalancings by the Thrivent Asset Allocation Funds or other
investors. These transactions may affect the Affiliated Funds since Affiliated
Funds that experience redemptions as a result of reallocations or rebalancings
may have to sell Fund securities and since Affiliated Funds that receive
additional cash will have to invest such cash. These effects may be particularly
important when one or more of the Thrivent Asset Allocation Funds owns a
substantial portion of any Affiliated Fund. While it is impossible to predict
the overall impact of these transactions over time, the performance of an
Affiliated Fund may be adversely affected if the Affiliated Fund is required to
sell securities or invest cash at inopportune times. These transactions could
also increase transaction costs and accelerate the realization of taxable income
if sales of securities resulted in gains. Because the Thrivent Asset Allocation
Funds may own substantial portions of some Affiliated Funds, a redemption or
reallocation by a Thrivent Asset Allocation Fund away from an Affiliated Fund
could cause the Affiliated Fund’s expenses to increase.
Investment
Adviser Risk. The
Funds are actively managed and the success of its investment strategy depends
significantly on the skills of the Adviser in assessing the potential of the
investments in which the Fund invests. The assessment of potential Fund
investments may prove incorrect, resulting in losses or poor performance, even
in rising markets.
Issuer
Risk.
Issuer risk is the possibility that factors specific to a company to which a
Fund’s portfolio is exposed will affect the market prices of the company’s
securities and therefore the value of the Fund. Some factors affecting the
performance of a company include demand for the company’s products or services,
the quality of management of the company and brand recognition and loyalty. To
the extent that a Fund invests in common stock, common stock of a company is
subordinate to other securities issued by the company. If a company becomes
insolvent, interests of investors owning common stock will be subordinated to
the interests of other investors in and general creditors of, the
company.
Large
Cap Risk. Large-sized
companies may be unable to respond quickly to new competitive challenges such as
changes in technology. They may also not be able to attain the high growth rate
of successful smaller companies, especially during extended periods of economic
expansion.
Large
Shareholder Risk. From time to
time, shareholders of a Fund (which may include institutional investors,
financial intermediaries, or affiliated Funds) may make relatively large
redemptions or purchases of shares. These transactions may cause a Fund to sell
securities at disadvantageous prices or invest additional cash, as the case may
be. While it is impossible to predict the overall impact of these transactions
over time, there could be adverse effects on a Fund’s performance to the extent
that a Fund may be required to sell securities or invest cash at times when it
would not otherwise do so. Redemptions of a large number of shares also may
increase transaction costs or have adverse tax consequences for shareholders of
the Fund by requiring a sale of portfolio securities. In addition, a large
redemption could result in a Fund's current expenses being allocated over a
smaller asset base, leading to an increase in the Fund's expense
ratio.
Leveraged
Loan Risk. Leveraged loans
are subject to the risks typically associated with debt securities. In addition,
leveraged
106
loans, which typically hold a
senior position in the capital structure of a borrower, are subject to the risk
that a court could subordinate such loans to presently existing or future
indebtedness or take other action detrimental to the holders of leveraged loans.
Leveraged loans are also subject to the risk that the value of the collateral,
if any, securing a loan may decline, be insufficient to meet the obligations of
the borrower, or be difficult to liquidate. Some leveraged loans are not as
easily purchased or sold as publicly-traded securities and others are illiquid,
which may make it more difficult for the Fund to value them or dispose of them
at an acceptable price. Below investment-grade leveraged loans are typically
more credit sensitive. Also, some leveraged loans are known as “covenant lite”
loans, which have contractual provisions that are more favorable to borrowers
and provide less protection for lenders such as the Fund. As a result, the Fund
could experience relatively greater difficulty or delays in enforcing its rights
on its holdings of covenant lite loans than its holdings of loans with financial
maintenance covenants, which may result in losses, especially during a downturn
in the credit cycle. Covenant lite loans also generally provide fewer investor
protections if certain criteria are breached. In the event of fraud or
misrepresentation, the Fund may not be protected under federal securities laws
with respect to leveraged loans that may not be in the form of
“securities.”
Liquidity
Risk. Liquidity is
the ability to sell a security relatively quickly for a price that most closely
reflects the actual value of the security. Certain securities (e.g., small-cap
stocks, foreign securities,
private equity funds,
and high-yield bonds) often have a less liquid resale market. Liquid investments
may become illiquid after purchase by the Adviser, particularly during periods
of market turmoil. As a result, the Adviser may have difficulty selling or
disposing of securities quickly in certain markets or may only be able to sell
the holdings at prices substantially less than what the Adviser believes they
are worth. Less liquid securities can also become more difficult to value. In
addition, when there is illiquidity in the market for certain securities, the
Fund, due to limitations on illiquid investments, may be subject to purchase and
sale restrictions.
To the extent that dealers do not
maintain inventories of bonds that keep pace with the growth of bond markets
over time, relatively low levels of dealer inventories could lead to decreased
liquidity and increased volatility in the fixed income markets, particularly
during periods of economic or market stress. In addition, inventories of
municipal bonds held by brokers and dealers have decreased in recent years,
lessening their ability to make a market in these securities. As a result of
this decreased liquidity, the Adviser may have to accept a lower price to sell a
security, sell other securities to raise cash, or give up an investment
opportunity, any of which could have a negative effect on
performance.
Market
Risk. Over time,
securities markets generally tend to move in cycles with periods when security
prices rise and periods when security prices decline. The value of a Fund’s
investments may move with these cycles and, in some instances, increase or
decrease more than the applicable market(s) as measured by a Fund’s benchmark
index(es). The securities markets may also decline because of factors that
affect a particular industry or market sector.
Price declines may
occur in response to general market and economic conditions or events, including
conditions and developments outside of the financial markets such as significant
changes in interest and inflation rates and the availability of credit. In
addition, domestic or global events, including
regulatory events, economic
downturn, government shutdowns,
the spread of an
infectious illness such as the outbreak of COVID-19, public health crises, war,
terrorism, social unrest, recessions, natural disasters or similar events could
reduce consumer demand or economic output, result in market closures, travel
restrictions or quarantines, and generally have a significant impact on the
world economies, which in turn could adversely affect a Fund's investments. Any
investment is subject to the risk that the financial markets as a whole may
decline in value, thereby depressing the investment’s price.
Mid
Cap Risk. Medium-sized
companies often have greater price volatility, lower trading volume, and less
liquidity than larger, more-established companies. These companies tend to have
smaller revenues, narrower product lines, less management depth and experience,
smaller shares of their product or service markets, fewer financial resources,
and less competitive strength than larger companies.
Money Market
Fund Risk. You could
lose money by investing in the Fund. Although the Fund seeks to preserve the
value of your investment at $1.00 per share, it cannot guarantee it will do so.
An investment in the Fund is not a bank account and is not insured or guaranteed
by the Federal Deposit Insurance Corporation or any other government agency. The
Fund’s sponsor is not required to reimburse the Fund for losses, and you should
not expect that the sponsor will provide financial support to the Fund at any
time, including during periods of market stress. While the Board of Trustees may
implement procedures to impose a discretionary liquidity fee upon the sale of
your shares in the future, the Board has not elected to do so at this time.
Should the Board elect to do so, such change would only become effective after
shareholders were provided with specific advance notice of the change in the
Fund's policy and provided with the opportunity to redeem their shares in
accordance with Rule 2a-7 before the policy change became
effective.
Mortgage-Backed
and Other Asset-Backed Securities Risk.
The value of
mortgage-related and asset-backed securities are
influenced by the
factors affecting the housing market and the assets underlying such securities.
As a result, during periods of declining asset value, difficult or frozen credit
markets, swings in interest rates, or deteriorating economic conditions,
mortgage-related and asset-backed securities may decline in value, face
valuation difficulties, become more volatile and/or become illiquid. In
addition, both mortgage-backed and asset-backed securities are sensitive to
changes in the repayment patterns of the underlying security. If the principal
payment on the underlying asset is repaid faster or slower than the holder of
the asset-backed or mortgage-backed security anticipates, the price of the
security may fall, particularly if the holder must reinvest the repaid principal
at lower rates or must continue to hold the security when interest rates rise.
This effect may cause the value of the Fund to decline and reduce the overall
return of the Fund. Mortgage-backed securities are also subject to extension
risk, which is the risk that when interest rates rise, certain mortgage-backed
securities are paid in full by the issuer more slowly than anticipated. This can
cause the market value of the security to fall because the market may view its
interest rate as low for a longer-term investment.
Municipal
Bond Risk. A Fund’s
performance may be affected by political and economic conditions at the state,
regional or federal level. These may include budgetary problems, decline in the
tax base and other factors that may cause rating agencies to downgrade the
credit ratings on certain issues. Bonds may also exhibit price fluctuations due
to changes in interest rate or bond
107
yield levels. Some
municipal bonds may be repaid prior to maturity if interest rates decrease. As a
result, the value of a Fund’s shares may fluctuate significantly in the short
term. The amount of public information available about municipal bonds is
generally less than for certain corporate equities or bonds, meaning that the
investment performance of a Fund may be more dependent on the analytical
abilities of the Adviser than funds that invest in stock or other corporate
investments. A Fund may make significant investments in a particular segment of
the municipal bond market or in the debt of issuers located in the same state or
territory. Adverse conditions in such industry or location could have a
correspondingly adverse effect on the financial condition of issuers. These
conditions may cause the value of a Fund’s shares to fluctuate more than the
values of shares of funds that invest in a greater variety of
investments.
Non-Diversified
Risk.
A Fund that is not “diversified” within the meaning of the 1940 Act may invest a
greater percentage of its assets in the securities of any single issuer compared
to other funds. A non-diversified portfolio is generally more susceptible than a
diversified portfolio to the risk that events or developments affecting a
particular issuer or industry will significantly affect the Fund’s
performance.
Other
Funds Risk. The performance
of Funds that invest in other funds is dependent, in part, upon the performance
of the other funds. As a result, the Fund is subject to the same risks as those
faced by the other funds’ underlying portfolios. Those risks may include, among
others, market risk, issuer risk, volatility risk, foreign securities risk,
foreign currency risk, emerging markets risk, derivatives risk, credit risk,
interest rate risk, high yield risk and investment adviser risk. As a
shareholder of the Fund, you will bear your share of the Fund’s operating
expenses as well as the Fund’s share of the other funds’ operating expenses.
Consequently, an investment in the Fund would result in higher aggregate
operating costs than investing directly in other funds that are also
portfolios.
Portfolio
Turnover Rate Risk. A Fund may engage
in active and frequent trading of portfolio securities in implementing its
principal investment strategies. A high rate of portfolio turnover (100% or
more) involves correspondingly greater expenses which are borne by the Fund and
its shareholders and may also result in short-term capital gains taxable to
shareholders. The expenses may include bid-ask spreads, dealer mark-ups, and
other transactional costs on the sale of securities and reinvestment in other
securities.
Preferred
Securities Risk.
There are certain additional risks associated with investing in preferred
securities, including, but not limited to, preferred securities may include
provisions that permit the issuer, at its discretion, to defer or omit
distributions for a stated period without any adverse consequences to the
issuer; preferred securities are generally subordinated to bonds and other debt
instruments in a company’s capital structure in terms of having priority to
corporate income and liquidation payments, and therefore are subject to greater
credit risk than more senior debt instruments; preferred securities may be
substantially less liquid than many other securities, such as common stocks or
U.S. Government securities; generally, traditional preferred securities offer no
voting rights with respect to the issuing company unless preferred dividends
have been in arrears for a specified number of periods, at which time the
preferred security holders may elect a number of directors to the issuer’s
board; and in certain varying circumstances, an issuer of preferred securities
may redeem the securities prior to a specified date.
Prepayment
Risk. When interest
rates fall, certain obligations are paid off by the obligor more quickly than
originally anticipated, and a Fund may have to invest the proceeds in securities
with lower yields. In periods of falling interest rates, the rate of prepayments
tends to increase (as does price fluctuation) as borrowers are motivated to pay
off debt and refinance at new lower rates. During such periods, reinvestment of
the prepayment proceeds by the management team will generally be at lower rates
of return than the return on the assets that were prepaid. Prepayment generally
reduces the yield to maturity and the average life of the security.
Quantitative
Investing Risk. Securities
selected according to a quantitative analysis methodology can perform
differently from the market as a whole based on the model and the factors used
in the analysis, the weight placed on each factor and changes in the factor’s
historical trends. Such models are based on assumptions relating to these and
other market factors, and the models may not take into account certain factors,
or perform as intended, and may result in a decline in the value of the Fund’s
portfolio. If models or data used in the models are incorrect or incomplete, any
decisions made in reliance thereon expose the Fund to potential risks. If
incorrect market data is entered into even a well-founded model, the resulting
information will be incorrect and could lead to losses for the Fund. For
example, the data on which a model is based may be imprecise or become stale due
to new events or changing circumstances. Market performance can be affected by
non-quantitative factors (for example, investor fear or over-reaction or other
emotional considerations) that are not easily integrated into quantitative
analysis, which could adversely affect performance of these models and, in turn,
the Fund. The performance of a model may also be impaired by technical issues
with the construction and implementation of quantitative models such as software
or other technology system malfunctions, or programming inaccuracies. Human
judgment plays a role in building, utilizing, testing and modifying the
financial algorithms and formulas underlying the models and accordingly such
models are subject to the risk of human error and biases.
Real
Estate Investment Trust (“REIT”) Risk. REITs generally
can be divided into three types: equity REITs, mortgage REITs and hybrid REITs
(which combine the characteristics of equity REITs and mortgage REITs). Equity
REITs will be affected by changes in the values of, and income from, the
properties they own, while mortgage REITs may be affected by the credit quality
of the mortgage loans they hold. All REIT types may be affected by changes in
interest rates. The effect of rising interest rates is generally more pronounced
for high dividend paying stock than for stocks that pay little or no dividends.
This may cause the value of real estate securities to decline during periods of
rising interest rates, which would reduce the overall return of the Fund. REITs
are subject to additional risks, including the fact that they are dependent on
specialized management skills that may affect the REITs’ abilities to generate
cash flows for operating purposes and for making investor distributions. REITs
may have limited diversification and are subject to the risks associated with
obtaining financing for real property. As with any investment, there is a risk
that REIT securities and other real estate industry investments may be
overvalued at the time of purchase. In addition, a REIT can pass its income
through to its investors without any tax at the entity level if it complies with
various requirements under the Internal Revenue Code. There is the risk,
however, that a REIT held by the Fund will fail to qualify for this tax-free
pass-through treatment of its income. By investing in REITs indirectly through
the Fund, in addition to bearing a
108
proportionate
share of the expenses of the Fund, you will also indirectly bear similar
expenses of the REITs in which the Fund invests.
Redemption
Risk.
A Fund may need to sell portfolio securities to meet redemption requests. The
Fund could experience a loss when selling portfolio securities to meet
redemption requests if there is (i) significant redemption activity by
shareholders, including, for example, when a single investor or few large
investors make a significant redemption of Fund shares, (ii) a disruption in the
normal operation of the markets in which the Fund buys and sells portfolio
securities or (iii) an inability of the Fund to sell portfolio securities
because such securities are illiquid. In such events, the Fund could be forced
to sell portfolio securities at unfavorable prices in an effort to generate
sufficient cash to pay redeeming shareholders.
Regulatory
Risk. Legal, tax, and
regulatory developments may adversely affect a Fund. Securities and futures
markets are subject to comprehensive statutes, regulations, and margin
requirements enforced by the SEC, other regulators and self-regulatory
organizations, and exchanges, which are authorized to take extraordinary actions
in the event of market emergencies. The regulatory environment is evolving, and
changes in the regulation of investment funds, managers, and their trading
activities and capital markets, or a regulator’s disagreement with a Fund’s
interpretation of the application of certain regulations, may adversely affect
the ability of the Fund to pursue its investment strategy, its ability to obtain
leverage and financing, and the value of investments held by the
Fund.
Repurchase
Agreement Risk. A repurchase
agreement, or repo, is a form of short-term borrowing that allows a dealer to
sell securities to an investor, such as the Fund, and buy them back (usually the
next day) at a slightly higher price. If the seller of a repurchase agreement
defaults or is otherwise unable to fulfill its obligations, the Fund may incur
losses as a result of selling the underlying securities, enforcing its rights,
or a decline in the value of collateral.
Small
Cap Risk. Smaller, less
seasoned companies often have greater price volatility, lower trading volume,
and less liquidity than larger, more established companies. A Fund may have
difficulty selling holdings of these companies at a desired time and price.
Smaller companies tend to have small revenues, narrower product lines, less
management depth and experience, small shares of their product or service
markets, fewer financial resources, and less competitive strength than larger
companies. Such companies seldom pay significant dividends that could soften the
impact of a falling market on returns. It may be a substantial period of time
before a Fund could realize a gain, if any, on an investment in a small cap
company.
Sovereign
Debt Risk. Sovereign debt
securities are issued or guaranteed by foreign governmental entities. These
investments are subject to the risk that a governmental entity may delay or
refuse to pay interest or repay principal on its sovereign debt, due, for
example, to cash flow problems, insufficient foreign currency reserves,
political considerations, the relative size of the governmental entity’s debt
position in relation to the economy or the failure to put in place economic
reforms required by the International Monetary Fund or other multilateral
agencies. If a governmental entity defaults, it may ask for more time in which
to pay or for further loans. There is no legal process for collecting sovereign
debts that a government does not pay nor are there
bankruptcy
proceedings through which all or part of the sovereign debt that a governmental
entity has not repaid may be collected.
Tax
Risk.
Changes in federal income tax laws or rates may affect both the net asset value
of a Fund and the taxable equivalent interest generated from securities in a
Fund. Since a Fund may invest in municipal securities subject to the federal
alternative minimum tax without limitation, a Fund may not be suitable for
investors who already are or could be subject to the federal alternative minimum
tax.
Technology-Oriented
Companies Risk. Common stocks of
companies that rely extensively on technology, science or communications in
their product development or operations may be more volatile than the overall
stock market and may or may not move in tandem with the overall stock market.
Technology, science and communications are rapidly changing fields, and stocks
of these companies, especially of smaller and unseasoned companies, may be
subject to more abrupt or erratic market movements than the stock market in
general. These are significant competitive pressures among technology-oriented
companies and the products or operations of such companies may become obsolete
quickly. In addition, these companies may have limited product lines, markets or
financial resources and the management of such companies may be more dependent
upon one or a few key people.
Value
Investing Risk. Value style
investing includes the risk that stocks of undervalued companies may not rise as
quickly as anticipated if the market doesn’t recognize their intrinsic value or
if value stocks are out of favor. Value style investing may be out of favor with
investors from time to time and value stocks may underperform the securities of
other companies or the stock market in general.
Glossary of
Investment Terms
Dollar-Weighted
Average Effective Maturity. Measure of the
fund that is determined by calculating the average maturity of each debt
security owned by the fund, weighting each security according to the amount that
it represents in the fund. In addition, for asset-backed and mortgage-backed
securities, as well as bonds with required prepayments or redemption rights, the
calculation considers the expected prepayments of the underlying securities
and/or the present value of a mandatory stream of prepayments.
Duration. A measure of
price sensitivity of a bond or bond fund to changes in interest rates. While
duration is similar to maturity in that the result is stated in years, it is a
better indicator of price sensitivity than maturity since it takes into account
the time value of future cash flows generated over the bond’s life. Since
duration can be computed for bond funds by using a weighted approach, the
approximate effect on a bond fund’s price can be estimated by multiplying the
fund’s duration by an expected change in interest rates. For example, if
interest rates were to rise by 1%, the net asset value of a bond fund with an
average duration of 5 years would be expected to fall 5%.
Fundamental
Investment Research Techniques. Research
techniques that generally assess a company or security’s value based on a broad
examination of financial data, quality of management, business concept and
competition.
Leverage. Leverage occurs
when a fund increases its assets available for investment, such as by using
reverse repurchase agreements or other investment techniques, including short
sales
109
and certain
derivative transactions. In general, the use of leverage exposes the investor to
a risk of loss that exceeds the amount invested.
Market
Capitalization. Market
capitalization is the most commonly used measure of the size and value of a
company. It is computed by multiplying the current market price of a share of
the company’s stock by the total number of its shares outstanding.
Maturity. A bond fund has
no real maturity, but it does have a dollar-weighted average effective maturity
that represents an average of the effective maturities of the underlying bonds,
with each bond’s effective maturity “weighted” by the percent of fund assets it
represents. For bonds that are most likely to be called before maturity, the
effective maturity of a bond is usually the call date.
Quantitative
Investment Research Techniques. Research
techniques that generally focus on a company’s financial statements and assess a
company or security’s value based on financial ratios that measure revenue,
profitability and financial structure.
Technical
Investment Research Techniques. Research
techniques that generally involve the study of trends and movements in a
security’s price, trading volume and other market-related factors in an attempt
to discern patterns.
Volatility. Volatility is a
statistical measure of the dispersion of returns for a given security, market
index or portfolio over a period of time.
110
Management
of the Funds
Investment
Adviser
The Funds are managed by Thrivent
Asset Mgt., 901 Marquette Avenue, Suite 2500, Minneapolis, Minnesota 55402-3211.
Thrivent Asset Mgt. had approximately $30 billion in assets under management as
of December 31, 2023. Thrivent Asset Mgt. is an indirect wholly owned subsidiary
of Thrivent Financial for Lutherans (“Thrivent”). Thrivent and its affiliates
have been in the investment advisory business since 1986 and had approximately
$150.7 billion in assets under management as of December 31,
2023.
Thrivent Asset Mgt. and Thrivent
Mutual Funds received an exemptive order from the SEC that permits Thrivent
Asset Mgt. and the Funds, with the approval of Thrivent Mutual Funds’ Board, to
retain one or more subadvisers for the Funds, or subsequently change a
subadviser, without submitting the respective investment subadvisory agreements,
or material amendments to those agreements, to a vote of the shareholders of the
applicable Fund. Thrivent Asset Mgt. will notify shareholders of a Fund of any
change in the identity of the subadviser for a Fund.
Management
Fees
Each Fund pays an
annual management fee to the Adviser. The Adviser received the following
management fees during the Fund’s most recent fiscal year, expressed as a
percentage of the Fund’s average daily net assets.1
|
Fund |
Management
Fee |
|
Thrivent
Aggressive Allocation Fund2 |
0.73% |
|
Thrivent
Balanced Income Plus Fund |
0.55% |
|
Thrivent
Diversified Income Plus Fund |
0.52% |
|
Thrivent
Global Stock Fund |
0.56% |
|
Thrivent
Government Bond Fund |
0.40% |
|
Thrivent
High Income Municipal Bond Fund |
0.50% |
|
Thrivent
High Yield Fund |
0.39% |
|
Thrivent
Income Fund |
0.34% |
|
Thrivent
International Allocation Fund |
0.67% |
|
Thrivent
Large Cap Growth Fund |
0.65% |
|
Thrivent
Large Cap Value Fund |
0.45% |
|
Thrivent
Limited Maturity Bond Fund |
0.28% |
|
Thrivent
Low Volatility Equity Fund |
0.60% |
|
Thrivent
Mid Cap Growth Fund |
0.75% |
|
Thrivent
Mid Cap Stock Fund |
0.60% |
|
Thrivent
Mid Cap Value Fund |
0.75% |
|
Thrivent
Moderate Allocation Fund2 |
0.62% |
|
Thrivent
Moderately Aggressive Allocation
Fund2 |
0.67% |
|
Thrivent
Moderately Conservative Allocation
Fund2 |
0.59% |
|
Thrivent
Money Market Fund3 |
0.24% |
|
Thrivent
Multidimensional Income Fund |
0.55% |
|
Thrivent
Municipal Bond Fund |
0.41% |
|
Thrivent
Opportunity Income Plus Fund |
0.44% |
|
Fund |
Management
Fee |
|
Thrivent
Small Cap Growth Fund |
0.80% |
|
Thrivent
Small Cap Stock Fund |
0.63% |
1
Thrivent Asset
Mgt. reimbursed certain expenses of some of the Funds. This table does not reflect
the effects of any reimbursements.
2
The Adviser has
contractually agreed, for as long as the current fee structure is in place and through
at least February 28, 2025, to waive an amount equal to any management fees
indirectly incurred by the Fund as a result of its investment in any other
mutual fund for which the Adviser or an affiliate serves as investment adviser,
other than Thrivent Cash Management Trust.
3
Management Fees
have been restated to reflect estimated fees anticipated to be incurred in the
current fiscal year.
Certain of the Funds have
breakpoints, which you can learn more about by consulting the SAI. In addition,
the Trust’s annual report (in the case of Thrivent Diversified Income Plus Fund
and Thrivent Multidimensional Income Fund) and semiannual report (in the case of
the other Funds) each discuss the basis for the Board’s approval of the
investment adviser agreement between the Trust and the Adviser.
The Adviser may
voluntarily reimburse expenses or waive all or a portion of the management fees
of Thrivent Money Market Fund from time to time, including to avoid a negative
yield. Any such voluntary expense reimbursement or waiver could be implemented,
increased or decreased, or discontinued at any time. There is no guarantee that
Thrivent Money Market Fund will be able to avoid a negative
yield.
Administrative
Service Fee
The Adviser is responsible for
providing certain administrative and accounting services to the Funds. Each Fund
pays the Adviser a fee equal to the sum of $80,000 ($70,000 prior to January 1,
2024) plus 0.017% of the Fund’s average daily net assets for providing such
services to the Fund. See “Other Services—Administration Contract” in the SAI
for additional information.
Portfolio
Management
Information about the portfolio
managers who are jointly and primarily responsible for the day-to-day management
for each of the Funds is shown below. The SAI for the Funds provides information
about the portfolio managers’ compensation, other accounts managed by the
portfolio managers, and the portfolio managers’ ownership of shares of the
Funds.
111
Thrivent
Aggressive Allocation Fund, Thrivent Moderate Allocation Fund, Thrivent
Moderately Aggressive Allocation Fund, Thrivent Moderately Conservative
Allocation Fund
|
Name |
Industry
Experience |
|
Stephen D.
Lowe, CFA |
Industry
professional since
1996;
joined Thrivent in 1997 |
|
David S.
Royal |
Industry
professional since
1997;
joined Thrivent in 2006 |
|
David R.
Spangler, CFA |
Industry
professional since
1989;
joined Thrivent in 2002 |
Thrivent
Balanced Income Plus Fund, Thrivent Diversified Income Plus Fund
|
Name |
Industry
Experience |
|
Stephen D.
Lowe, CFA |
Industry
professional since
1996;
joined Thrivent in 1997 |
|
David R.
Spangler, CFA |
Industry
professional since
1989;
joined Thrivent in 2002 |
|
Theron G.
Whitehorn, CFA |
Industry
professional since
2002;
joined Thrivent in 2018 |
Thrivent
Global Stock Fund
|
Name |
Industry
Experience |
|
Kurt J.
Lauber, CFA |
Industry
professional since
1990;
joined Thrivent in 2004 |
|
Noah J.
Monsen, CFA |
Industry
professional since
2008;
joined Thrivent in 2000 |
|
Lauri A.
Brunner |
Industry
professional since
1983;
joined Thrivent in 2007 |
|
David R.
Spangler, CFA |
Industry
professional since
1989;
joined Thrivent in 2002 |
Thrivent
Government Bond Fund
|
Name |
Industry
Experience |
|
Kent L.
White, CFA |
Industry
professional since
1999;
joined Thrivent in 1999 |
|
Jon-Paul
(JP) Gagne |
Industry
professional since
2004;
joined Thrivent in 2018 |
Thrivent High
Income Municipal Bond Fund, Thrivent Municipal Bond Fund
|
Name |
Industry
Experience |
|
Johan Å.
Åkesson, CFA |
Industry
professional since
1993;
joined Thrivent in 1993 |
|
Stephanie
L. Woeppel |
Industry
professional since
2004;
prior to joining Thrivent
in 2022,
at Northern Trust
from 2012
to 2022 |
Thrivent
High Yield Fund
|
Name |
Industry
Experience |
|
Paul J.
Ocenasek, CFA |
Industry
professional since
1987;
joined Thrivent in 1987 |
|
Paul S.
Tommerdahl, CFA |
Industry
professional since
2008;
joined Thrivent in 2016 |
Thrivent
Income Fund
|
Name |
Industry
Experience |
|
Kent L.
White, CFA |
Industry
professional since
1999;
joined Thrivent in 1999 |
|
Cortney L.
Swensen, CFA |
Industry
professional since
2005;
joined Thrivent in 2011 |
Thrivent
International Allocation Fund
|
Name |
Industry
Experience |
|
Noah J.
Monsen, CFA |
Industry
professional since
2008;
joined Thrivent in 2000 |
|
Brian W.
Bomgren, CQF |
Industry
professional since
2006;
joined Thrivent in 2006 |
|
Jing Wang,
CFA |
Industry
professional since
2008;
prior to joining Thrivent
in 2019,
at Pine River Capital
Management
from 2008 to
2019 |
|
Shu
Guo |
Industry
professional since
2011;
prior to joining Thrivent
in 2022,
at Pine River Capital
Management
from 2011 to
2022 |
Thrivent
Large Cap Growth Fund
|
Name |
Industry
Experience |
|
Lauri A.
Brunner |
Industry
professional since
1993;
joined Thrivent in 2007 |
|
Jaimin
Soni |
Industry
professional since
2008;
prior to joining Thrivent
in 2019,
at Aristotle Atlantic
Partners
from 2017 to 2019 |
Thrivent
Large Cap Value Fund
|
Name |
Industry
Experience |
|
Kurt J.
Lauber, CFA |
Industry
professional since
1990;
joined Thrivent in 2004 |
|
Thomas C.
Lieu, CFA |
Industry
professional since
1997;
prior to joining Thrivent
in 2019,
at Westwood
Management
from 2010 to
2019 |
112
Thrivent
Limited Maturity Bond Fund
|
Name |
Industry
Experience |
|
Cortney L.
Swensen, CFA |
Industry
professional since
2005;
joined Thrivent in 2011 |
|
Jon-Paul
(JP) Gagne |
Industry
professional since
2004;
joined Thrivent in 2018 |
Thrivent
Low Volatility Equity Fund
|
Name |
Industry
Experience |
|
Noah J.
Monsen, CFA |
Industry
professional since
2008;
joined Thrivent in 2000 |
|
Brian W.
Bomgren, CQF |
Industry
professional since
2006;
joined Thrivent in 2006 |
|
Jing Wang,
CFA |
Industry
professional since
2008;
prior to joining Thrivent
in 2019,
at Pine River Capital
Management
from 2008 to
2019 |
Thrivent
Mid Cap Growth Fund
|
Name |
Industry
Experience |
|
Siddharth
Sinha, CFA |
Industry
professional since
2012;
joined Thrivent in 2015 |
|
Mark C.
Militello, CFA |
Industry
professional since
1996;
prior to joining Thrivent
in 2022,
at Fort Washington
Investment
Advisors from
2015 to
2022 |
Thrivent
Mid Cap Stock Fund
|
Name |
Industry
Experience |
|
Brian J.
Flanagan, CFA |
Industry
professional since
1993;
joined Thrivent in 1994 |
|
Vikram
Kaura |
Industry
professional since
1999;
joined Thrivent in 2017 |
|
J.P.
McKim, CFA |
Industry
professional since
2011;
prior to joining Thrivent
in 2019,
at Piper Jaffray & Co
from 2015
to 2019 |
Thrivent
Mid Cap Value Fund
|
Name |
Industry
Experience |
|
Graham
Wong, CFA |
Industry
professional since
2001;
joined Thrivent in 2013 |
|
Nicholas
E. Griffith, MD, CFA |
Industry
professional since
2010;
prior to joining Thrivent
in 2021,
at Huber Capital
Management
from 2016 to
2021 |
Thrivent Money
Market Fund
|
Name |
Industry
Experience |
|
William D.
Stouten |
Industry
professional since
1993;
joined Thrivent in 2001 |
Thrivent
Multidimensional Income Fund, Thrivent Opportunity Income Plus Fund
|
Name |
Industry
Experience |
|
Stephen D.
Lowe, CFA |
Industry
professional since
1996;
joined Thrivent in 1997 |
|
Kent L.
White, CFA |
Industry
professional since
1999;
joined Thrivent in 1999 |
|
Theron G.
Whitehorn, CFA |
Industry
professional since
2002;
joined Thrivent in 2018 |
Thrivent
Small Cap Growth Fund
|
Name |
Industry
Experience |
|
Michael P.
Hubbard |
Industry
professional since
2007;
joined Thrivent in 2018 |
|
Patrick D.
Farley, CFA |
Industry
professional since
2018;
joined Thrivent in 2018 |
Thrivent
Small Cap Stock Fund
|
Name |
Industry
Experience |
|
Matthew D.
Finn, CFA |
Industry
professional since
1985;
joined Thrivent in 2004 |
|
James M.
Tinucci, CFA |
Industry
professional since
2008;
joined Thrivent in 2014 |
|
Katelyn R.
Young, CPA |
Industry
professional since
2010;
prior to joining Thrivent
in 2022,
at William Blair from
2014 to
2022 |
Personal
Securities Investments
Personnel of Thrivent Asset Mgt.
may invest in securities for their own account pursuant to codes of ethics that
establish procedures for personal investing and restrict certain transactions.
Transactions in securities that may be held by the Funds are permitted by
Thrivent Asset Mgt., subject to compliance with applicable provisions under the
applicable codes of ethics.
Trademarks
BLOOMBERG,
Bloomberg Indices and Bloomberg Fixed Income Indices (the “Indices”) are
trademarks or service marks of Bloomberg Finance L.P. Bloomberg Finance L.P. and
its affiliates, including Bloomberg Index Services Limited, the administrator of
the Indices (collectively, “Bloomberg”) or Bloomberg's licensors own all
proprietary rights in the Indices. Bloomberg does not guarantee the timeliness,
accuracy or completeness of any data or information relating to the Indices.
Bloomberg makes no warranty, express or implied, as to the Indices or any data
or values relating thereto or results to be obtained therefrom, and
113
expressly
disclaims all warranties of merchantability and fitness for a particular purpose
with respect thereto.
Global Industry
Classification standard ("GICS") was developed by and is the exclusive property
and a service mark of MSCI Inc. ("MSCI") and Standard & Poor's, a division
of The McGraw-Hill Companies, Inc. ("S&P"), and is licensed for use by the
Funds. Neither MSCI, S&P nor any third party involved in making or compiling
the GICS or any GICS classifications makes any express or implied warranties or
representations with respect to such standard or classification (or the results
to be obtained by the use thereof), and all such parties hereby expressly
disclaim all warranties or originality, accuracy, completeness, merchantability,
and fitness for a particular purpose with respect to any of such standard or
classification. Without limiting any of the foregoing, in no event shall MSCI,
S&P, any of their affiliates or any third party involved in making or
compiling the GICS or any GICS classifications have any liability for any
direct, indirect, special, punitive, consequential or any other damages
(including lost profits) even if notified of the possibility of such
damages.
MSCI makes no
express or implied warranties or representations and shall have no liability
whatsoever with respect to any MSCI data contained herein. The MSCI data may not
be further redistributed or used as a basis for other indexes or any securities
or financial products. This prospectus is not approved, endorsed, reviewed, or
produced by MSCI. None of the MSCI data is intended to constitute investment
advice or a recommendation to make (or refrain from making) any kind of
investment decision and may not be relied on as such.
Although MSCI
shall obtain information for inclusion in or for use in the calculation of the
MSCI Indexes from sources that MSCI considers reliable, neither MSCI, nor any of
its affiliates, nor any of its information providers or any other third party
involved in, or related to, compiling, computing or creating any MSCI Index
(collectively, the “MSCI Parties”) warrants or guarantees the originality,
accuracy and/or the completeness of any MSCI Index or any data included therein.
None of the MSCI Parties makes any warranty, express or implied, as to results
to be obtained by the issuer of the fund, owners of the fund, or any other
person or entity, from the use of any MSCI Index or any data included therein.
None of the MSCI Parties shall have any liability for any errors, omissions, or
interruptions of or in connection with any MSCI Index or any data included
therein. Further, none of the MSCI Parties makes any express or implied
warranties of any kind, and the MSCI Parties hereby expressly disclaim all
warranties of merchantability and fitness for a particular purpose, with respect
to each MSCI Index and any data included therein. Without limiting any of the
foregoing, in no event shall any of the MSCI Parties have any liability for any
direct, indirect, special, punitive, consequential or any other damages
(including lost profits) even if notified of the possibility of such
damages.
Frank Russell Company is the
source and owner of the trademarks, service marks and
copyrights related to the Russell Indexes. Russell® is a trademark of Frank Russell
Company. Russell 2000®, Russell 2000® Growth, Russell
Midcap®, Russell Midcap® Growth, Russell
Midcap® Value, Russell 1000®, Russell 1000® Value, and Russell
1000® Growth is/are a trademark(s) of
the relevant LSE Group companies and is/are used by any other LSE Group company
under license. All rights in the FTSE Russell
indexes or data vest in the
relevant LSE Group company which owns the index or the data. Neither London
Stock Exchange Group plc and its group undertakings (collectively the “LSE
Group”) nor its licensors accept any liability for any errors or omissions in
the indexes or data and no party may rely on any indexes or data contained in
this communication. No further distribution of data from the LSE Group is
permitted without the relevant LSE Group company’s express written consent. The
LSE Group does not promote, sponsor, or endorse the content of this
communication.
The S&P 500® Index, S&P SmallCap
600® Index, S&P SmallCap 600
Growth Index, S&P MidCap 400® Index, S&P MidCap 400 Growth
Index, S&P MidCap 400 Value Index, S&P 500 Growth Index, S&P 500
Value Index, and S&P U.S. Preferred Stock Index are products of S&P Dow
Jones Indices LLC and/or its affiliates and have been licensed for use by the
Funds. Copyright © 2024 S&P Dow Jones Indices LLC, a
subsidiary of McGraw Hill Financial Inc., and/or its affiliates. All rights
reserved. Redistribution, reproduction and/or photocopying in whole or in part
are prohibited without written permission of S&P Dow Jones Indices LLC. For
more information on any of S&P Dow Jones indices LLC's indices please visit
spdji.com. S&P® is a registered trademark of
Standard & Poor's Financial Services LLC and Dow Jones® is a registered
trademark of Dow Jones Trademark Holdings LLC. Neither S&P Dow Jones Indices
LLC, Dow Jones Trademark Holdings, LLC their affiliates nor their third party
licensors make any representation or warranty, express or implied, as to the
ability of any index to accurately represent the asset class or market sector
that it purports to represent and neither S&P Dow Jones Indices LLC, Dow
Jones Trademark Holdings LLC, their affiliates nor their third party licensors
shall have any liability for any errors, omissions, or interruptions of any
index or the data included therein.
This prospectus
may contain information obtained from third parties, including ratings from
credit ratings agencies such as Standard & Poor's. Reproduction and
distribution of third party content in any form is prohibited except with the
prior written permission of the related third party. Third party content
providers do not guarantee the accuracy, completeness, timeliness, or
availability of any information, including ratings, and are not responsible for
any errors or omissions (negligent or otherwise), regardless of the cause, or
for the results obtained from the use of such content. THIRD PARTY CONTENT
PROVIDERS GIVE NO EXPRESS OR IMPLIED WARRANTIES, INCLUDING, BUT NOT LIMITED TO,
ANY WARRANTIES OF MERCHANTABILITY OR FITNESS FOR A PARTICULAR PURPOSE OR USE.
THIRD PARTY CONTENT PROVIDERS SHALL NOT BE LIABLE FOR ANY DIRECT, INDIRECT,
INCIDENTAL, EXEMPLARY, COMPENSATORY, PUNITIVE, SPECIAL OR CONSEQUENTIAL DAMAGES,
COSTS, EXPENSES, LEGAL FEES, OR LOSSES (INCLUDING LOST INCOME OR PROFITS AND
OPPORTUNITY COSTS OR LOSSES CAUSED BY NEGLIGENCE) IN CONNECTION WITH ANY USE OF
THEIR CONTENT, INCLUDING RATINGS. Credit ratings are statements of opinions and
are not statements of fact or recommendations to purchase, hold, or sell
securities. They do not address the suitability of securities or the suitability
of securities for investment purposes and should not be relied on as investment
advice.
114
Shareholder
Information
How to Contact
Us
Internet:
thriventfunds.com
thriventfunds.com
Telephone:
800-847-4836
800-847-4836
Applications,
Redemptions, Exchanges & Other Requests:
Thrivent Mutual Funds
P.O. Box 219348
Kansas City, Missouri 64121-9348
Thrivent Mutual Funds
P.O. Box 219348
Kansas City, Missouri 64121-9348
Additional
Investments:
Thrivent Mutual Funds
P.O. Box 219334
Kansas City, Missouri 64121-9334
Thrivent Mutual Funds
P.O. Box 219334
Kansas City, Missouri 64121-9334
Express
Mail:
Thrivent Mutual Funds
430 West 7th Street
Kansas City, Missouri 64105
Thrivent Mutual Funds
430 West 7th Street
Kansas City, Missouri 64105
Fax:
866-278-8363
866-278-8363
Wire
Transfer Instructions:
State Street Corp.
225 Franklin Street
Boston, MA 02101
ABA #011000028
Account #4195-538-6
State Street Corp.
225 Franklin Street
Boston, MA 02101
ABA #011000028
Account #4195-538-6
Credit:
Thrivent Financial Investor Services Inc. as Agent for the benefit of Thrivent Mutual Funds
Thrivent Financial Investor Services Inc. as Agent for the benefit of Thrivent Mutual Funds
Further
Credit:
[Name of the Fund]
[Shareholder Account Number]
[Shareholder Registration/Name]
[Name of the Fund]
[Shareholder Account Number]
[Shareholder Registration/Name]
Pricing Fund
Shares
The price of a
Fund’s shares is based on the Fund’s net asset value (“NAV”). Each Fund
determines its NAV for a particular class of shares once daily at the close of
regular trading on the New York Stock Exchange (“NYSE”), which is normally 4:00
p.m. Eastern time. If the NYSE has an unscheduled early close but certain other
markets remain open until their regularly scheduled closing time, the NAV may be
determined as of the regularly scheduled closing time of the NYSE. If the NYSE
and/or certain other markets close early due to extraordinary circumstances
(e.g., weather, terrorism, etc.), the NAV may be calculated as of the early
close of the NYSE and/or certain other markets. The NAV generally will not be
determined on days when, due to extraordinary circumstances, the NYSE and/or
certain other markets do not open for trading. The Funds generally do not
determine NAV on holidays observed by the NYSE or on any other day when the NYSE
is closed. The NYSE is regularly closed on Saturdays and Sundays, New Year’s
Day, Martin Luther King, Jr. Day, Presidents’ Day, Good Friday, Memorial Day,
Juneteenth,
Independence Day,
Labor Day, Thanksgiving Day and Christmas Day. The price at which you purchase
or redeem shares of a Fund is based on the next calculation of the NAV after the
Fund receives your purchase or redemption request in good order.
Thrivent Money Market Fund seeks
to maintain a stable $1.00 NAV, pursuant to procedures established by the Board,
and generally utilizes the amortized cost method. Valuing securities held by
Thrivent Money Market Fund on the basis of amortized cost (which approximates
market value) involves a constant amortization of premium or accretion of
discount to maturity. This method is explained further in the SAI. The Fund will
not value a security at amortized cost, but will instead make a fair value
determination for such security, if it determines that amortized cost is not
approximately the same as the fair value of the security.
Each other Fund determines the NAV
for a particular class by dividing the total Fund assets attributable to that
class, less all liabilities attributable to such class, by the total number of
outstanding shares of that class. To determine the NAV, the other Funds
generally value their securities at current market value using readily available
market prices. If market prices are not readily available or if the Adviser
determines that they are not reliable, the Board has designated the Adviser to
make fair valuation determinations in accordance with Rule 2a-5 under the 1940
Act. Fair valuation of a particular security is an inherently subjective
process, with no single standard to utilize when determining a security’s fair
value. In each case where a security is fair valued, consideration is given to
the facts and circumstances relevant to the particular situation. This
consideration includes a review of various factors set forth in the pricing
policies. For any portion of a Fund’s assets that are invested in other mutual
funds, the NAV is calculated based upon the NAV of the mutual funds in which the
Fund invests, and the prospectuses for those mutual funds explain the
circumstances under which they will use fair value pricing and the effects of
such a valuation.
Because many
foreign markets close before the U.S. markets, significant events may occur
between the close of the foreign market and the close of the U.S. markets, when
the Fund’s assets are valued, that could have a material impact on the valuation
of foreign securities (i.e., available price
quotations for these securities may not necessarily reflect the occurrence of
the significant event). The Adviser evaluates the impact of these significant
events and adjusts the valuation of foreign securities to reflect the fair value
as of the close of the U.S. markets to the extent that the available price
quotations do not, in the Adviser’s opinion, adequately reflect the occurrence
of the significant events. For more information about how the Funds discourage
abusive trading practices (including those that may attempt to take advantage of
significant events, the occurrence of which are not necessarily reflected in
available price quotations of foreign securities), please see the section
entitled “Frequent Trading Policies and Monitoring Processes” in this
Prospectus.
115
Overview of Share
Classes
Thrivent Mutual
Funds offer Class S shares for each of the Funds and Class A shares for most of
the Funds. There is no sales charge imposed in connection with the purchase or
exchange of Class S shares, and such shares are not subject to any Rule 12b-1
fees. In contrast, Class A shares are subject to sales charges and Rule 12b-1
fees, although sales charges or Rule 12b-1 fees may be reduced or removed for
the purchase and exchange of some Funds. Because the sales charges and expenses
vary between the Class S shares and Class A shares, performance will vary with
respect to each class.
You may purchase,
redeem or exchange shares of the Funds in several ways. Shares may be purchased,
redeemed or exchanged through a broker-dealer or financial intermediary who
maintains a selling agreement with the Funds’ principal underwriter, Thrivent
Distributors, LLC (“Thrivent Distributors”), as well as through certain
retirement plans and deferred compensation plans. Shares also may be purchased,
redeemed or exchanged through mail; telephone; the Internet; the mobile app;
wire/ACH transfer; or an Automatic Investment, Redemption or Exchange Plan. New
purchases of Class A shares are available only to certain accounts maintained
with certain broker-dealers who have elected to offer Class A shares; existing
Class A shareholders may make additional purchases of Class A
shares.
Thrivent Mutual
Funds has authorized certain broker-dealers to receive purchase and redemption
orders on the Funds’ behalf, and such broker-dealers are authorized to designate
other intermediaries to receive orders on the Funds’ behalf. Such broker-dealers
and intermediaries may charge fees for effecting transactions or for other
services. If your Thrivent Mutual Funds shares are held in an account subject to
a broker-dealer’s investment advisory program or an account service fee
agreement, please contact your financial professional for information about
these fees and the services available for the different fees or for help with
transactions in, or changes to, your Thrivent Mutual Funds account.
Class S shares may
be available through certain fee-based investment advisory programs sponsored by
broker-dealers or financial intermediaries. Class S shares also may be
purchased, redeemed or exchanged through certain broker-dealers or
intermediaries who maintain selling agreements with Thrivent Distributors,
subject to an account service fee for certain services provided by the
broker-dealer and their financial professionals. If a shareholder elects to pay
such an account service fee, the shareholder will pay such fee directly to the
broker-dealer from the shareholder’s account (the fee is not deducted from the
Thrivent Mutual Funds).
For Class S
shares, if you do not utilize the services of a broker-dealer or financial
professional, or if you want to terminate an account service fee agreement, you
will manage your Thrivent Mutual Funds account online at thriventfunds.com or
you may call the Thrivent Mutual Funds Interaction Center (“Interaction Center”)
at 800-847-4836.
Buying
Shares
Opening an
Account
You must open an
account for each Fund that you want to purchase. If you have questions about the
Funds or if you would like assistance with opening an account, please contact
your financial professional or call the Interaction Center at
800-847-4836.
Generally, you can
purchase multiple Funds under one account registration type (e.g., an IRA). How you
register your account with the Funds can affect your legal interests as well as
the rights and interests of your family and beneficiaries. You should always
consult with your legal and/or tax advisor to determine the account registration
type that best meets your needs. You must clearly identify the type of account
you want on your application. Additional documentation may be necessary on any
account, including accounts such as a corporation, trust, estate, custodianship,
guardianship, partnership or pension and profit sharing plan. Your ability to
transfer Fund shares to another broker-dealer is limited to those broker-dealers
with whom Thrivent Distributors maintains a selling agreement. In the event that
your account has been abandoned or is no longer supported by your broker-dealer,
we will assist you in finding an alternative broker-dealer or exchanging your
shares, as appropriate.
Required Minimum
Investments
|
Regular
Account |
Initial
Purchase |
Additional
Purchases |
|
All
Funds |
$2,000 |
$50 |
|
IRA
or Tax-Deferred Plan |
|
|
|
All
Funds |
$1,000 |
$50 |
|
Employer
Sponsored
Qualified
Plans |
No
Minimum
Requirement |
|
Automatic
Investment Plan |
Minimum
Monthly
Amount
Per Fund
Account
Number |
|
All
Funds |
$50 |
Please note that
these minimums are not applicable to investors in certain fee-based investment
advisory programs that utilize Class S shares.
Class A Sales
Charges
Class A shares of
Thrivent Government Bond Fund are closed to all purchases and exchanges into the
Fund, other than the reinvestment of dividends by current Class A shareholders
in the Fund. Class A of both Thrivent Limited Maturity Bond Fund and Thrivent
Money Market Fund are offered without an initial sales charge. The table below
shows the sales charges you will pay if you purchase Class A shares of the other
Funds.
116
|
When
You Invest
This
Amount |
This
% is Deducted
for
Sales Charges |
Which
Equals This %
of
Your Investment* |
|
Less than
$50,000 |
4.5% |
4.71% |
|
$50,000
and above
but less
than
$100,000 |
3.5% |
3.63% |
|
$100,000
and
above but
less than
$250,000 |
2.5% |
2.56% |
|
$250,000
and
above but
less than
$500,000 |
1.5% |
1.52% |
|
$500,000
and
above but
less than
$1,000,000 |
1.0% |
1.01% |
|
$1,000,000
or more |
0% |
0% |
*
The actual sales
charge that may be paid by the investor may differ slightly from the sales
charge shown above due to rounding that occurs in the calculation of the
offering price and in the number of shares purchased.
Ways
to Eliminate or Reduce the Initial Class A Sales Charges
•
Rights
of Accumulation: You can combine
the value of existing Class A and Class S share accounts (except the Excluded
Shares as defined directly below) of Thrivent Mutual Funds in any eligible
account type that you or others that reside at the same mailing address
(“household”) own for the purpose of calculating the sales charge. To ensure you
receive any applicable reduced sales charge through Rights of Accumulation, you
must notify us at the time of purchase of the other existing accounts, and we
may ask you to provide us with account statements of these accounts.
Shares not
eligible for Rights of Accumulation privileges include Thrivent Limited Maturity
Bond Fund, Thrivent Money Market Fund and shares purchased directly by you or a
member of your household through thriventfunds.com (“Excluded
Shares”).
The value of all
shares in any multi-participant employer-sponsored retirement plan and certain
corporate and partnership accounts (except for the Excluded Shares) are not
available for individual Rights of Accumulation, but rather will be accumulated
for the purpose of determining the sales charge for shares purchased through
that retirement plan or organization.
•
Automatic
Reinvestments: Shares that you
purchase by automatically reinvesting dividends or capital gains distributions
from Class A shares of the Funds will not be subject to any initial sales
charge.
•
Thirteen-month
Letter of Intent: If you or a
member of your household intend to purchase at least $50,000 of Class A shares
of one or more of the Funds (except for Excluded Shares) within a 13-month
period, you may sign a Letter of Intent and receive the reduced Class A sales
charge on these purchases. The total amount of your intended purchases will
determine the sales charge that will apply. Purchases made within 90 days prior
to the execution of the
Letter of Intent
within Class A shares and Class S (the “90-day purchases”) will be used for
purposes of meeting the applicable threshold (e.g., $50,000). The
13-month period will begin on the trade date of the first 90-day
purchase.
You may combine
the value of all existing Class A and Class S share accounts (except for
Excluded Shares) in any eligible account type that you or a member of your
household own for purposes of determining the amount that must be purchased to
satisfy your commitment under the Class A Letter of Intent. Accounts will be
valued as of the day before the start date of the 13-month period. You must
notify us, however, of the other existing accounts, and we may ask that you
provide account statements for these other accounts. Please note that shares
held in certain types of accounts (e.g.,
multi-participant employer-sponsored retirement plans and certain partnership
and corporate accounts) are not included for purposes of taking advantage of
reduced sales charges offered by a Letter of Intent.
The Fund will hold
a certain portion of your investment in escrow until your commitment is met. If
your commitment is not met, a portion of your investment will be redeemed to
satisfy the higher Class A sales charge applicable to the amount actually
purchased.
The Funds may
waive your commitment in the Letter of Intent if the Funds place restrictions on
future purchases of Fund shares that impair your ability to fulfill your
commitment.
•
Purchases
by Tax-exempt Organizations: Shares of any
Fund are available at one-half of the regular Class A sales charge, if any, if
purchased by organizations qualifying for tax-exemption under Sections 501(c)(3)
and 501(c)(13) of the Internal Revenue Code. You must notify us, at the time of
initial purchase, if you are a tax-exempt organization under either 501(c)(3) or
501(c)(13). In addition, we may require that you provide proof of your
tax-exempt status.
•
Periodic
Waiver or Reduction of Initial Sales Charge:
Thrivent
Distributors may, from time to time, waive or reduce the initial Class A sales
charge on certain shares offered uniformly to the public for specific time
periods as specified in the disclosure documents of the applicable Fund
(e.g., prospectus or
supplement to the prospectus).
•
Certain
Retirement Plans: Thrivent
Distributors may waive the sales charge for purchases of Class A shares by
certain retirement plan accounts.
•
Certain
Financial Intermediaries: Thrivent
Distributors may waive the Class A sales charge for shares purchased by certain
banks, broker-dealers and other financial institutions, which have entered into
an agreement with Thrivent Distributors or one of its affiliates, on behalf of
clients participating in a fund supermarket, asset allocation program or other
program.
•
Information
on the Funds’ Website: Information
regarding the ways to eliminate or reduce the initial Class A sales charges is
also available at thriventfunds.com, including hyperlinks that facilitate access
to the information.
Placing an
Order
Shares of the
Funds are issued on days that the NYSE is open, which generally are weekdays
other than national holidays. If you are not purchasing through an omnibus or
networked account,
117
your order will be
considered received when it is received by the transfer agent in good order. If
you are purchasing through an omnibus or networked account, your order will be
considered received when an authorized broker (or its authorized designee)
receives it in good order. Good order means that your instructions and any
required payment have been received by the transfer agent or an authorized
broker (or its authorized designee) in the form required by the Funds, including
the name of the Fund, the account number, the amount of the transaction, and all
required signatures. Orders received in good order by the transfer agent, or by
an authorized broker (or its authorized designee) for omnibus or networked
accounts, before the close of trading on the NYSE (generally 4:00 p.m. Eastern
time) will be processed at the NAV calculated that day, less any sales charge
applicable to Class A shares. The Fund, its transfer agent, or any other
authorized Fund agent may, in its sole discretion, determine whether any
particular transaction request is in good order and reserves the right to change
or waive any good order requirement at any time.
Purchases by
Employer Sponsored Qualified Plans and IRAs or Other Tax-Deferred
Plans
While SEP and
SIMPLE plans (for Class A and S) and 403 (b) plans (for Class A only) do not
have a required minimum investment amount for purchases, we reserve the right to
limit purchases to a single Fund until a minimum investment of $1,000 is
achieved. In addition, the required minimum investment on a purchase for IRAs or
other Tax-Deferred Plans, as disclosed above in “Required Minimum Investments,”
may be waived.
Purchase
Policies
Your payment must
be in U.S. dollars drawn on a U.S. bank. Thrivent Mutual Funds does not accept
cash, virtual currency, traveler’s checks, debit/credit cards, credit card
courtesy checks or most third-party and starter/counter checks. If you purchase
shares by check, electronic funds transfer (other than bank wire) or automatic
investment plan and you elect to redeem those shares soon after their purchase,
a Fund may delay paying the redemption proceeds for up to 10 days from the date
of purchase to allow the Fund to collect payment for the purchase of
shares.
The Funds and
Thrivent Distributors reserve the right to suspend the offering of shares for a
period of time and the right to reject any specific purchase of
shares.
Under applicable
anti-money laundering rules and other regulations, the Fund, its transfer agent,
or any other authorized Fund agent may suspend, restrict or cancel your purchase
order and withhold the monies.
The Funds have
implemented procedures designed to reasonably ensure that instructions are
genuine. Procedures that may be used include, but are not limited to, recording
telephone conversations, logging electronic activity, using software to verify
bank information, verifying certain personal information and supplying
transaction verification information. Please note, however, that the Funds will
not be liable for losses suffered by a shareholder that result from following
instructions reasonably believed to be authentic after verification pursuant to
these procedures. If an account has multiple owners, the Funds may rely on the
instructions of any one account owner.
Initial
Purchases
You may purchase
initial shares through:
•
A financial
professional;
•
Mail;
•
Telephone;
•
Internet;
•
Mobile app;
or
•
Wire/ACH
transfer.
During periods of
extreme volume caused by dramatic economic or stock market changes or due to
unforeseen technology issues, it is possible that you may have difficulty
reaching the Interaction Center by phone or Internet for short periods of
time.
Initial
Purchases by Mail
(See
“How to Contact Us” for address information)
To buy shares of
the Funds by mail:
•
Complete and
submit your new account application for each different account registration. If
you do not complete the application properly, your purchase may be delayed or
rejected.
•
Make your check
payable to the Fund you are buying. If more than one Fund, make your check
payable to “Thrivent Mutual Funds.”
Initial
Purchases by Telephone
To buy initial
shares of the Funds by telephone, please note the following:
•
Complete and
submit your new account application for each different account registration. If
you do not complete the application properly, your purchase may be delayed or
rejected.
•
Complete all of
the bank information required on the application so that you may call the Fund
to withdraw money from your bank checking or savings account to make your
investment.
•
This feature may
not be available on certain accounts.
Initial
Purchases by Internet
To buy initial
shares of the Funds by the Internet, please note the following:
•
Complete and
submit your new account application for each different account registration. If
you do not complete the application properly, your purchase may be delayed or
rejected.
•
A User ID and
password is required prior to authorizing such transactions.
•
Bank instructions
must be established on the account through the Internet or by submitting the
bank information on the application prior to making a purchase.
•
This feature may
not be available on certain accounts.
Initial
Purchases Through Mobile App
You may buy initial shares of the
Funds through the Thrivent mobile app after you have completed and submitted
your new account application for each different account registration. In
addition to downloading the app, a User ID and password is required prior to
authorizing transactions on your Fund accounts. This feature may not be
available on certain accounts.
118
Initial
Purchases by Wire Transfer
To buy initial
shares of the Funds by wire transfer, please note the following:
•
Your bank must be
a member of, have a corresponding relationship with a member of, or use the
Federal Reserve System.
•
Complete and mail
your new account application for each account registration. If you do not
complete the application properly, your purchase may be delayed or
rejected.
•
Instruct your bank
to wire transfer the funds. (See
Wire Transfer Instructions under “How to Contact Us”)
•
This feature may
not be available on certain accounts.
•
Thrivent Mutual
Funds and its transfer agent are not responsible for the consequences of delays
resulting from the banking or Federal Reserve wire transfer system, or from
incomplete wiring instructions.
Additional
Purchases
You may purchase
additional shares through:
•
A financial
professional;
•
Mail;
•
Telephone;
•
Internet;
•
Mobile
app;
•
Wire/ACH transfer;
or
•
Automatic
investment plan.
During periods of
extreme volume caused by dramatic economic or stock market changes or due to
unforeseen technology issues, it is possible that shareholders may have
difficulty reaching the Interaction Center by phone or Internet for short
periods of time.
Additional
Purchases by Mail
(See
“How to Contact Us” for address information)
To make additional
purchases by mail, make your check payable to the specific Fund in which you are
investing. If more than one Fund, make your check payable to “Thrivent Mutual
Funds.” Please indicate your Fund account number on the face of your check. If
you have more than one account, always verify that you are investing in the
proper account. This will help ensure the proper handling of the
transaction.
Additional
Purchases by Telephone
The ability to
purchase shares by telephone is automatically extended to most shareholder
accounts, unless the option is specifically declined on your application.
Certain accounts are not extended this feature. If you do not want the telephone
purchase option on your account, please call the Interaction Center at
800-847-4836. By accepting this feature, you assume some risks for unauthorized
transactions.
Additional
Purchases by Internet
You may purchase
additional shares within your Fund accounts over the Internet. A User ID and
password is required prior to authorizing transactions on your Fund accounts.
This feature may not be available on certain accounts.
Additional
Purchases Through Mobile App
You may purchase
additional shares of the Funds through the Thrivent mobile app. In addition to
downloading the app, a User
ID and password is
required prior to authorizing transactions on your Fund accounts. This feature
may not be available on certain accounts.
Additional
Purchases by Wire Transfer
You may make
additional purchases in an existing Fund account by wire transfer. Please note
the following:
•
Your bank must be
a member of, have a corresponding relationship with a member of, or use the
Federal Reserve System.
•
Instruct your bank
to wire transfer the funds. (See Wire Transfer Instructions under “How to
Contact Us”)
•
This feature may
not be available on certain accounts.
•
Thrivent Mutual
Funds and its transfer agent are not responsible for the consequences of delays
resulting from the banking or Federal Reserve wire transfer system, or from
incomplete wiring instructions.
Automatic
Investment Plans
The Funds offer
several automatic investment plans to make periodic investing more convenient.
Using the Funds’ automatic investment plans, you may implement a strategy called
dollar cost averaging. Dollar cost averaging involves investing a fixed amount
of money at regular intervals. Generally, when you dollar cost average, you
purchase more shares when the price is low and fewer shares when the price is
high. Dollar cost averaging does not ensure a profit or protect against a loss
during declining markets.
For further
information regarding any of the following automatic investment plans, contact
your financial professional or the Interaction Center at
800-847-4836.
Automatic
Purchase Plan
The Funds’
Automatic Purchase Plan allows you to make regular additional investments in an
existing Fund account. Under this plan, the Funds will withdraw from an
investor’s bank checking or savings account in the amount specified (subject to
the required minimum investments) on specified dates. The proceeds will be
invested in shares of the specified Fund at the applicable offering price
determined on the date of the draw. To use this plan, you must authorize the
plan on your application form, or subsequently in writing, and may be required
to submit additional documents. This feature may not be available on certain
accounts.
Automatic
Payroll Deduction Savings and Investment Plan
The payroll
deduction savings and investment plan allows Social Security recipients, federal
employees and military personnel to invest in the Funds through direct deduction
from their paychecks or commission checks. For information about how to instruct
another institution to send payroll deduction amounts to your mutual fund
account, contact the Interaction Center at 800-847-4836.
Retirement
Plans
Certain types of
individual and employer-sponsored retirement plans may be established with
assets invested in Thrivent Mutual Funds. These accounts may offer you tax
advantages. You should consult your attorney and/or tax advisor before you
establish a retirement plan. Additional fees may apply to some retirement
accounts. Please review plan documents and/or
119
custodial account
agreements for more information. You may obtain these materials, documents and
forms by contacting your financial professional or the Interaction Center, or by
downloading the documents on thriventfunds.com. Please note, however, that each
Fund reserves the right to not make its shares available to certain retirement
plan accounts.
Redeeming
Shares
When the transfer
agent or an authorized broker (or its authorized designee) receives your
redemption request in good order, the Fund will redeem available shares at the
next calculation of the Fund’s NAV. Orders received by the transfer agent or an
authorized broker (or its authorized designee) in good order before the close of
trading on the NYSE (generally 4:00 p.m. Eastern time) will be processed at the
NAV calculated that day.
Except as
discussed below for redemptions of recently purchased shares, the Funds
typically expect to pay redemption proceeds within two business days after
receipt of a redemption request determined to be in good order, but payment may
take up to seven days. The right to redeem shares may be suspended or payment
upon redemption may be delayed for more than seven days only (i) for any period
during which trading on the NYSE is restricted as determined by the SEC or
during which the NYSE is closed (other than customary weekend and holiday
closings), (ii) for any period during which an emergency exists, as defined by
the SEC, as a result of which disposal of portfolio securities or determination
of the NAV of the Funds is not reasonably practicable, and (iii) for such other
periods as the SEC may by order permit for the protection of shareholders of the
Funds. If you purchased shares by check, electronic funds transfer (other than
bank wire) or automatic investment plan and you elect to redeem those shares
soon after their purchase, a Fund may delay paying the redemption proceeds for
up to 10 days from the date of purchase to allow the Fund to collect payment for
the purchase of shares.
The Funds
typically expect to meet redemption requests with cash or cash equivalents held
by the applicable Fund(s) or from proceeds from selling Fund assets in
connection with the normal course management of the Fund. In stressed or
otherwise abnormal market conditions, including to meet significant redemption
activity by shareholders, a Fund may need to sell portfolio assets. In this type
of situation, the Fund could be forced to sell portfolio securities at
unfavorable prices in an effort to generate sufficient cash to pay redeeming
shareholders.
A Fund may also, particularly in
stressed or otherwise abnormal market conditions, meet redemption requests with
cash obtained through short-term borrowing arrangements that may be available
from time to time. Such borrowing arrangements currently include a credit
facility in which the Funds and other portfolios managed by the Adviser or an
affiliate participate, and an interfund lending program maintained pursuant to
an exemptive order from the SEC. The Funds are limited under both arrangements
as to the amount that each may borrow. The SAI includes more information about
these borrowing arrangements.
Although the Funds typically
expect to pay redemption proceeds in cash, in certain circumstances when in the
best interests of a Fund, including if a Fund determines that a cash redemption
would be detrimental to remaining Fund shareholders, a Fund may pay all or a portion of
redemption proceeds to shareholders with in-kind distributions of a Fund’s
portfolio securities. Such
in-kind distributions may be pro rata or another method that is determined to be fair to both the
redeeming shareholder and the remaining shareholders in accordance with policies
and procedures adopted by a Fund. You may incur brokerage and other transaction
costs associated with converting into cash the portfolio securities distributed
to you for such in-kind redemptions. The portfolio securities you receive may
increase or decrease in value before you convert them into cash. You may incur
tax liability when you sell the portfolio securities you receive from an in-kind
redemption.
If an account has
multiple owners, the Fund may rely on the instructions of any one account owner
to redeem shares. Additional documentation may be necessary on any account,
including accounts such as a corporation, trust, estate, custodianship,
guardianship, partnership or pension and profit sharing plan.
You must have a
Medallion Signature Guarantee if you want to sell shares with a value of
$500,000 or more. A Medallion Signature Guarantee is a stamp provided by a
financial institution that verifies your signature. You endorse the applicable
form and have the signature(s) guaranteed by an eligible guarantor institution
such as a commercial bank, trust company, security broker or dealer, credit
union, or a savings association participating in the Medallion Signature
Guarantee Program. A Medallion Signature Guarantee may generally be obtained at
any national bank or brokerage firm. We may waive or alter the Medallion
Signature Guarantee requirement in certain limited circumstances. The Funds do
not accept Medallion Signature Guarantees by fax. Notarization by a Notary
Public does not constitute a Medallion Signature Guarantee.
A written
redemption request between $100,000 and $499,999.99 requires one of the
following three procedures:
•
Your notarized
signature;
•
A Medallion
Signature Guarantee; or
•
An attestation of
your signature by your financial professional.
One of these three
procedures would also be required for:
•
Requests to send
redemption proceeds to an address other than the one listed on the
account;
•
Requests to wire
funds or directly deposit funds to a bank account with a bank name registration
different than the bank name of the account;
•
Requests to make
redemption proceeds payable to someone other than the current account
owner;
•
Requests to sell
shares if there has been a change of address on the account within the preceding
15 days; and
•
Requests to sell
shares if there has been a new bank of record added on the account within the
preceding 15 days.
In limited
instances, we may waive these requirements. If you have any questions regarding
the foregoing, please contact your financial professional or the Interaction
Center at 800-847-4836.
Please note that
an additional fee of $12.50 will be assessed for a redemption delivered by
weekday overnight mail and a fee of $20 will be assessed for a redemption
delivered by overnight mail for Saturday delivery. In addition, if you request a
redemption by wire transfer, a fee of up to $50 may be assessed. These fees will
be satisfied by the redemption of account shares.
A Fund will mail
payment proceeds within seven days following receipt of all required documents.
A mailing of redemption
120
proceeds may be
delayed for up to 10 days from the date of purchase to allow the Fund to collect
payment for the purchase of shares.
Under applicable
anti-money laundering rules and other regulations, redemptions may be suspended,
restricted, cancelled or processed by the Fund, its transfer agent, or any other
authorized Fund agent, and any proceeds may be withheld.
You may redeem
shares through:
•
A financial
professional;
•
Mail or
fax;
•
Telephone;
•
Internet;
•
Mobile app;
or
•
Automatic
Redemption Plan.
During periods of
extreme volume caused by dramatic economic or stock market changes or due to
unforeseen technology issues, it is possible that shareholders may have
difficulty reaching the Interaction Center by phone or Internet for short
periods of time.
Redemptions from
certain accounts may be subject to additional plan
provisions.
Redemptions
by Mail or Fax
(See
“How to Contact Us” for address or fax information)
Complete a
Thrivent Mutual Funds redemption form. You may obtain these materials, documents
and forms by contacting your financial professional or the Interaction Center,
or by downloading the documents on thriventfunds.com. As an alternative, you may
prepare a written request including the following information:
•
Name(s) of the
account owner(s);
•
The account
number;
•
The name of the
Fund(s) whose shares are being redeemed;
•
Dollar amount or number of shares
you wish to redeem;
•
Destination of redemption
proceeds; and
•
Signature of
authorized signer(s).
Redemptions
by Telephone
The ability to
redeem shares by telephone is automatically extended to most shareholder
accounts, unless the option is specifically declined on your application.
Certain accounts are not extended this feature. If you do not want the telephone
redemption option on your account, please call the Interaction Center at
800-847-4836. By accepting this feature, you assume some risks for unauthorized
transactions.
Telephone
redemption checks will be issued to the same payee(s) as the account
registration and sent to the address of record.
Telephone
redemptions are not allowed if, among other things:
•
You have not
expressly selected the option to permit telephone or Internet
redemptions;
•
There has been a
change of address in the preceding 15 days;
•
There has been new
or changed bank information in the preceding 15 days; or
•
The request is for
$500,000 or more.
Redemptions
by Internet
To redeem shares
from your accounts over the Internet, a User ID and password is required prior
to authorizing transactions on your Fund accounts. This feature may not be
available on certain accounts.
Internet
redemption checks will be issued to the same payee(s) as the account
registration and sent only to the address of record.
Internet
redemptions are not allowed if, among other things:
•
You have not
expressly selected the option to permit telephone or Internet
redemptions;
•
There has been a
change of address in the preceding 15 days;
•
There has been new
or changed bank information in the preceding 15 days; or
•
The request is for
$100,000 or more.
Redemptions
Through Mobile App
To redeem shares
from your accounts through the Thrivent mobile app, in addition to downloading
the app, a User ID and password is required prior to authorizing transactions on
your Fund accounts. This feature may not be available on certain
accounts.
Mobile app
redemption checks will be issued to the same payee(s) as the account
registration and sent only to the address of record.
Mobile app
redemptions are not allowed if, among other things:
•
You have not
expressly selected the option to permit telephone or Internet
redemptions;
•
There has been a
change of address in the preceding 15 days;
•
There has been new
or changed bank information in the preceding 15 days; or
•
The request is for
$100,000 or more.
Automatic
Redemption Plan
The Automatic
Redemption Plan allows you to have money automatically withdrawn from your Fund
account(s) on a regular basis. The plan allows you to receive funds or direct
payments at regular intervals. The following rules and/or guidelines
apply:
•
You need a minimum
of $5,000 in your account to start the plan.
•
To stop or change
your plan, please notify Thrivent Mutual Funds 10 days prior to the next
withdrawal.
•
Because of Class A
sales charges, you must consider carefully the costs of frequent investments in
and withdrawals of Class A shares from your account.
•
This feature may
not be available on certain accounts.
Receipt
of Redemption Proceeds by Wire Transfer
To receive your
redemption proceeds by wire transfer, the following conditions
apply:
•
Your bank must be
a member of, have a corresponding relationship with a member of, or use the
Federal Reserve System.
•
A fee of up to $50
may be assessed for redemptions by wire.
•
Other restrictions
may apply if Thrivent Mutual Funds does not already have information related to
your bank account.
•
This feature may
not be available on certain accounts.
121
Thrivent
Money Market Fund Checks
Class A shares of
the Thrivent Money Market Fund allow you to write checks against your existing
Class A shares in the account if you complete a check writing signature card and
agreement. You can request checks on your application or in writing. You may
obtain these materials, documents and forms by contacting your financial
professional or the Interaction Center. The Fund does not charge a fee for
supplying your checks. The following rules and/or guidelines apply:
•
The checks you
write on Class A of Thrivent Money Market Fund must be for $500 or more.
(Because the Fund is not a bank, some features, such as stop payment, may not be
available.)
•
The transfer agent
may impose reasonable fees for each check that is returned.
•
Unless you
purchased shares by wire, you must wait up to 10 days after you purchase Class A
shares of Thrivent Money Market Fund to write checks against that
purchase.
•
Unless you redeem
via the Internet, mobile app or phone, Class A shareholders need a written
request—not a check—to close a Thrivent Money Market Fund account.
•
You may earn daily
income dividends on Class A shares of the Fund up to the date they are
redeemed.
•
This feature may
not be available on certain account types.
•
This feature is
not available for Class S shares of Thrivent Money Market
Fund.
Exchanging Shares
Between Funds
You may exchange
some or all of your shares of one Fund for shares of the same class of any of
the other Funds. You may make exchanges by using the options described in this
section or by using the Automatic Exchange Plan, which allows you to make
exchanges on a regular basis. If you exchange Class A shares of a Fund for which
you have previously paid an initial sales charge for shares of another Fund, you
will not be charged an initial sales charge for the exchange. If the Class A
shares to be exchanged have not previously paid a sales charge, that portion of
the shares acquired through reinvested dividends and capital gains will not be
subject to a sales charge. In certain circumstances, exchanges between different
share classes of the same Fund may be permitted. A conversion between share
classes of the same Fund is a nontaxable event. All exchanges will be based on
the NAV of the shares you are exchanging and acquiring and will be subject to
the minimum investment requirements.
The Funds reserve
the right to terminate the exchange feature of any shareholder who is believed
to be engaging in abusive trading activity, as discussed in “Frequent Trading
Policy and Monitoring Process.” Further, the Funds reserve the right to modify
or terminate the exchange feature at any time with respect to any Fund, if the
Funds’ Trustees determine that continuing the feature may be detrimental to
shareholders. If the exchange policies are materially modified or terminated,
the Fund will give you at least 60 days’ prior notice.
You may receive
more information about making exchanges between Funds by contacting your
financial professional or the Interaction Center. Orders received by the
transfer agent or an authorized broker (or its authorized designee) in good
order before the close of trading on the NYSE (generally 4:00 p.m. Eastern time)
will be processed at the NAV calculated that day.
Under applicable
anti-money laundering rules and other regulations, exchange requests may be
suspended, restricted, cancelled or processed by the Fund, its transfer agent,
or any other authorized Fund agent, and any proceeds may be
withheld.
You may exchange
Funds through:
•
A financial
professional;
•
Mail or
fax;
•
Telephone;
•
Internet;
•
Mobile app;
or
•
Automatic Exchange
Plan.
During periods of
extreme volume caused by dramatic economic or stock market changes or due to
unforeseen technology issues, shareholders may have difficulty reaching the
Interaction Center by phone or Internet for short periods of
time.
Exchanges
by Mail or Fax
Complete a
Thrivent Mutual Funds exchange form. You may obtain these materials, documents
and forms by contacting your financial professional or the Interaction Center,
or by downloading the documents on thriventfunds.com. As an alternative, you may
prepare a written request including the following information:
•
Name(s) of the
account owner(s);
•
The Fund(s) and
account number(s);
•
Dollar or share
amount you wish to exchange;
•
The name of the
Fund(s) and account number(s) you are exchanging into; and
•
Signatures of all
account owners.
Exchanges
by Telephone
The ability to
exchange shares by telephone is automatically extended to most accounts, unless
the option is specifically declined on your application. This option may not be
available on certain accounts. If you do not want the telephone exchange option
on your account, please call the Interaction Center at 800-847-4836. By
accepting this feature, you assume some risks for unauthorized
transactions.
Exchanges
by the Internet
To exchange shares
within your Fund accounts over the Internet, a User ID and password is required
prior to authorizing an exchange on your Fund accounts. This feature may not be
available on certain accounts.
Exchanges
Through Mobile App
To exchange shares
within your Fund accounts through the Thrivent mobile app, in addition to
downloading the app, a User ID and password is required prior to authorizing an
exchange on your Fund accounts. This feature may not be available on certain
accounts.
Automatic
Exchange Plans
The Automatic
Exchange Plan allows you to exchange shares on a regular basis. The plan allows
you to exchange funds at regular intervals, on dates you select, between the
different funds of the Thrivent Mutual Funds. To start the plan, you will, in
most cases, be required to complete paperwork.
To start, stop or
change your plan, notify Thrivent Mutual Funds at least 10 days prior to the
next exchange date.
122
For further
instructions on how to start, stop, or make changes to the plan, call the
Interaction Center at 800-847-4836, or notify the Fund in writing.
Transaction
Confirmations
Typically, you
will receive written confirmation of your transaction within five business days
following the date of your transaction. You will receive confirmation of certain
transactions at least quarterly, including purchases under an automatic
investment plan, purchases and sales under an automatic exchange plan, purchases
of shares from reinvested dividends and/or capital gains, and automatic
redemptions. You can check your account activity at any time either on
thriventfunds.com if you purchased your shares directly online,
or thrivent.com if you purchased your shares through your financial
professional. Contact your
intermediary if you purchased your shares through a broker-dealer or other
financial intermediary.
Uncashed Checks
on Your Account
The Funds reserve
the right to reinvest any dividend, distribution or redemption proceeds amounts
that you have elected to receive by check should your check remain uncashed for
more than 180 days. Such checks will be reinvested in your account at the NAV on
the day of the reinvestment. When reinvested, those amounts are subject to the
risk of loss like any Fund investment. No interest will accrue on amounts
represented by uncashed checks. If you elect to receive distributions in cash
and a check remains uncashed for more than 180 days, your cash election may be
changed automatically to reinvest and your future dividend and capital gains
distributions will be reinvested in the Fund at the NAV as of the date of
payment of the distribution. This provision may not apply to certain retirement
or qualified accounts, accounts with a non-U.S. address or closed accounts. Your
participation in the Automatic Redemption Plan may be terminated if a check
remains uncashed.
Accounts with Low
Balances
Due to the high
cost to shareholders of maintaining accounts with low balances, a Fund may, by
redeeming account shares, charge a semiannual account maintenance fee of $10 (a
“low balance fee”) if the value of shares in the account falls below the
required minimum investment amount shown in the “Buying Shares” section of this
prospectus. The low balance fee may be waived for certain accounts (e.g. certain
retirement plans and investors in certain fee-based investment advisory
programs). Low balance fees will be automatically deducted from your account
twice per year. Alternatively, your account could be closed (rather than being
assessed a low balance fee) by redeeming the shares in your account. Before your
account is closed, however, you will be notified in writing and allowed 60 days
to purchase additional shares. If additional shares are not purchased, any such
close-out redemption may be at a time that is not favorable to you and may have
tax consequences.
Important
Information Regarding Unclaimed/Abandoned Property
It is important
that the Fund maintains a correct address for each shareholder. An incorrect
address may cause a shareholder’s account statements and other mailings to be
returned to the
Fund. Please be
advised that certain state escheatment laws may require the Fund to turn over
your Fund account to the state listed in your account registration as abandoned
property if no shareholder initiated activity occurs in the account within the
time frame specified by the applicable state law.
Escheatment laws vary by state,
and states have different criteria for defining inactivity and unclaimed or
abandoned property. You should check with your state of residence for specifics.
Depending on the laws in your jurisdiction, for shareholders that invest in the
Fund through an account held directly with the Fund’s transfer agent,
shareholder initiated activity might be achieved by one of the following
methods:
•
Sending a letter
to Thrivent Mutual Funds via the U.S. Post Office;
•
Logging in to your online account
on thrivent.com or through the mobile app;
•
Speaking to a
Customer Service Representative on the phone after you go through a security
verification process. For residents of certain states, contact cannot be made by
phone but must be in writing or through the Fund’s secure web
application;
•
Cashing checks
that are received and are made payable to the owner of the account;
or
•
Taking action on
letters received in the mail from the Fund concerning account inactivity,
outstanding checks and/or escheatment or abandoned property and promptly
following the directions in such letters.
If you do not hold your shares
directly with the Fund, you should contact your broker-dealer, retirement plan,
or other third-party intermediary regarding applicable state escheatment
laws.
The Fund, the Adviser, and the
transfer agent will not be liable to shareholders or their representatives for
good faith compliance with escheatment laws. To learn more about the escheatment
rules for your particular state, please contact your attorney or State
Treasurer’s and/or Controller’s Offices. Residents of certain states, including
Texas, may designate a representative to receive escheatment or abandoned
property notices regarding Fund shares. If you hold shares directly with the
Fund, a completed designation form may be
mailed to the below address.
Thrivent Mutual Funds
P.O. Box 21934
Kansas City, Missouri 64121-9348
P.O. Box 21934
Kansas City, Missouri 64121-9348
If you do not hold shares directly
with a Fund, you should contact your financial intermediary for more information
regarding completing a designation form.
Frequent Trading
Policies and Monitoring Processes
Because short-term or excessive
trading in Fund shares may disrupt management of a Fund and increase Fund
expenses, the Funds place certain limits on frequent trading in the Funds. The
Funds do not accommodate frequent purchases and redemptions of Fund shares by
Fund shareholders, except with respect to systematic purchases and redemptions,
transactions solely in your Thrivent Money Market Fund, omnibus accounts and
other specifically approved accounts. In addition, the policy set forth below
will not apply to a redemption transaction in which a Fund distributes portfolio
securities to a shareholder in-kind,
123
where the redemption will not
disrupt the efficient portfolio management of the Fund and the redemption is
consistent with the interests of the remaining shareholders of the Fund. The
Board has adopted the policy set forth below to deter frequent trading
activity.
Several different
tactics are used to reduce the frequency and effect that frequent trading can
have on the Funds. The Funds may use a combination of monitoring shareholder
activity and restricting shareholder transactions on certain accounts to combat
such trading practices. The Funds’ use of effective fair value pricing
procedures also reduces the opportunities for short term traders, especially for
the Funds with securities that pose more frequent pricing challenges, such as
international securities, high yield securities, and other securities whose
market prices may not accurately reflect their fair value (see “Pricing Funds’
Shares”).
When monitoring
shareholder activity, the Funds may consider several factors to evaluate
shareholder activity including, but not limited to, the amount and frequency of
transactions, the amount of time between purchases and redemptions (including
exchanges), trading patterns, and total assets in the Funds that are purchased
and redeemed. In making this evaluation, the Funds may consider trading in
multiple accounts under common ownership or control. The Funds reserve the
right, in their sole discretion, to consider other relevant factors when
monitoring shareholder activity.
If a shareholder
is believed to be engaging in frequent trading activity, the Funds may request
the shareholder to cease such activity, restrict the frequency and number of
exchanges allowed on an account, or take other action as the Funds deem
necessary to limit or restrict the account privileges to the shareholder. The
Funds may also reject or cancel any purchase request, including the purchase
side of an exchange, without notice for any reason. If it becomes necessary to
cancel a transaction of a shareholder whose account has been restricted, the
Funds will promptly reverse the exchange or (if the purchase request is not
associated with an exchange) refund the full purchase price to the
shareholder.
Although the Funds
seek to deter frequent trading practices, there are no guarantees that all
activity can be detected or prevented. Shareholders engaging in such trading
practices use an evolving variety of strategies to avoid detection and it may
not be possible for operational and technological systems to reasonably identify
all frequent trading activity. Omnibus accounts like those maintained by brokers
and retirement plans aggregate purchases and redemptions for multiple investors
whose identities may not be known to the Funds. The Funds monitor aggregate
trading activity of the omnibus accounts, and if suspicious activity is
detected, the Funds will contact the intermediary associated with the account to
determine if short-term or excessive trading has occurred. If the Funds believe
that its frequent trading policy has been violated, it will ask the intermediary
to impose restrictions on excessive trades. However, the financial intermediary
associated with the omnibus account may be limited in its ability to restrict
trading practices of its clients.
In addition, transactions by
certain institutional accounts, asset allocation programs and Funds in other
Funds may be exempt from the policies discussed above, subject to approval by
designated persons at Thrivent.
Anti-Money
Laundering
You may be asked
to provide additional information in order for the Funds to verify your identity
in accordance with requirements under anti-money laundering and other laws and
regulations. Accounts may be restricted and/or closed, and the monies withheld,
pending verification of this information or as otherwise required or permitted
under these and other regulations. Additionally, the Funds reserve the right to
involuntarily redeem an account in the case of: (i) actual or suspected
threatening conduct or actual or suspected fraudulent, illegal or suspicious
activity by the account owner or any other individual associated with the
account; or (ii) the failure of the account owner to provide information to the
Funds, the Funds’ transfer agent, or any other authorized Fund agent related to
opening the accounts.
Disclosure of
Fund Holdings
A description of the Funds’
policies and procedures with respect to the disclosure of their portfolio
securities is available in the SAI for the Funds, which can be
obtained at thriventfunds.com.
Payments to
Financial Intermediaries
Rule
12b-1 Fees: Class A
Class A shares of
Funds have an annual Rule 12b-1 fee for distribution and shareholder servicing
activities. The Rule 12b-1 fee is 0.25% each year of average daily net assets
for all Funds that offer Class A shares other than Thrivent Government Bond Fund
and Thrivent Limited Maturity Bond Fund, which have a Rule 12b-1 fee of 0.125%,
and Thrivent Money Market Fund, which does not have a Rule 12b-1 fee. The Funds
pay the Rule 12b-1 fees to Thrivent Distributors. Those fees are paid out of a
Fund’s assets attributable to the Class A shares on an ongoing basis. As a
result, these fees will increase the cost of your investment in Class A shares
and may cost you more than paying other types of sales charges.
Thrivent
Distributors may pay all or a portion of the fees to any broker-dealer,
financial institution or any other person who renders assistance in distributing
or promoting the sale of Class A shares, or who provides certain shareholder
services to Class A shareholders. Payments of the distribution and/or service
fee may be made without regard to expenses actually incurred.
Sub-Accounting
Services
The Adviser may
make arrangements for a Fund to make payments, directly or through the Adviser
or its affiliates, to selected financial intermediaries (such as brokers or
third party administrators) for providing certain sub-transfer agency and
related administrative services to shareholders holding Fund shares in nominee
or street name, including, without limitation, the following services:
maintaining investor accounts at the financial intermediary level and keeping
track of purchases, redemptions and exchanges by such accounts; processing and
mailing trade confirmations, monthly statements, prospectuses, annual reports,
semiannual reports, and shareholder notices and other SEC-required
communications; capturing and processing tax data; issuing and mailing dividend
checks to shareholders who have selected cash distributions; preparing record
date shareholder lists for proxy solicitations; collecting and posting
distributions to shareholder accounts; and establishing and maintaining
systematic withdrawals and automated investment
124
plans and
shareholder account registrations. A Fund may pay a fee for these services,
directly or through the Adviser or its affiliates, to financial intermediaries
selected by the Adviser and/or its affiliates. The actual services provided, and
the fees paid for such services, may vary from firm to firm.
The payments
described above may be material to financial intermediaries relative to other
compensation paid by the Funds and/or Thrivent Distributors, the Adviser and
their affiliates and may be in addition to any (i) distribution and/or servicing
(12b-1) fees and (ii) revenue sharing fees described herein. Thrivent
Distributors and the Adviser rely primarily on contractual arrangements with
financial intermediaries to verify whether such intermediaries are providing the
services for which they are receiving such payments. Although Thrivent
Distributors and the Adviser do not audit such financial intermediaries, they
may make periodic information requests to verify certain information about the
services provided.
Other
Payments
Thrivent Asset Mgt. has entered
into an agreement with Thrivent Distributors pursuant to which Thrivent Asset
Mgt. pays (from its
own resources, not the resources
of the Funds) Thrivent Distributors for services relating to the promotion,
offering, marketing or distribution of the Funds and/or retention of assets
maintained in the Funds. Compensation paid by Thrivent Asset Mgt. to Thrivent
Distributors and its sales personnel may vary by Fund and other factors as
agreed upon from time to time. In addition, Thrivent Asset Mgt. and Thrivent
Distributors make payments, out of their own resources, to financial
intermediaries that sell shares of the Funds in order to promote the
distribution and retention of Fund shares. The payments are typically based on
cumulative shares purchased by financial intermediaries’ clients and may vary by
Fund, share class, and other factors. These payments create an incentive for the
financial intermediary or its financial professionals to recommend or offer
shares of the Funds to you. The aforementioned arrangements are sometimes
referred to as “revenue sharing.”
Revenue sharing
arrangements are separately negotiated between the Adviser and/or its
affiliates, and the recipients of these payments. Revenue sharing payments are
not borne directly by the Funds, and are not reflected as additional expenses in
the fee table in this prospectus.
125
Distributions
Dividends
Income dividends are derived from
investment income, including dividends, interest, and certain foreign currency
gains, if any, received by the Fund. Dividends of the Funds, if any, are
generally declared and paid as follows:
|
Declared
Daily and
Paid
Monthly |
•Thrivent
Government Bond Fund
•Thrivent
High Income Municipal
Bond
Fund
•Thrivent
High Yield Fund
•Thrivent
Income Fund
•Thrivent
Limited Maturity Bond Fund
•Thrivent
Money Market Fund
•Thrivent
Municipal Bond Fund
•Thrivent
Opportunity Income Plus
Fund |
|
Declared
and Paid
Monthly |
•Thrivent
Diversified Income Plus
Fund
•Thrivent
Multidimensional Income
Fund |
|
Declared
and Paid
Quarterly |
•Thrivent
Balanced Income Plus
Fund
•Thrivent
Moderate Allocation Fund
•Thrivent
Moderately Conservative
Allocation
Fund |
|
Declared
and Paid
Annually |
•Thrivent
Aggressive Allocation Fund
•Thrivent
Global Stock Fund
•Thrivent
International Allocation
Fund
•Thrivent
Large Cap Growth Fund
•Thrivent
Large Cap Value Fund
•Thrivent
Low Volatility Equity Fund
•Thrivent
Mid Cap Growth Fund
•Thrivent
Mid Cap Stock Fund
•Thrivent
Mid Cap Value Fund
•Thrivent
Moderately Aggressive
Allocation
Fund
•Thrivent
Small Cap Growth Fund
•Thrivent
Small Cap Stock Fund |
Capital
Gains
Capital gains
distributions, if any, usually will be declared and paid in December for the
prior twelve-month period ending October 31, except for Thrivent Diversified
Income Plus Fund and Thrivent Multidimensional Income Fund, which are for the
prior twelve-month period ending December 31.
Distribution
Options
When completing
your application, you may select one of the following options for dividends and
capital gains distributions.
Notify your Fund
of a change in your distribution option 10 days before the record date of the
dividend or distribution.
•
Full
Reinvestment. Distributions
from a Fund will be reinvested in additional shares of the same class of that
Fund. This option will be selected automatically unless one of the other options
is specified.
•
Full
Reinvestment in a Different Fund. You may also
choose to have your distributions reinvested into an existing account of the
same class of another Fund within the Thrivent Mutual Funds.
•
Part
Cash and Part Reinvestment. You may request
to have part of your distributions paid in cash and part of your distributions
reinvested in additional shares of the same class of the Fund.
•
All
Cash.
Distributions will be paid in cash. You may choose to send your distributions
directly to your bank account or request to have a check sent to
you.
The Funds reserve
the right to automatically reinvest any distributions into your account that are
less than $10.
Distributions paid
in shares will be credited to your account at the next determined NAV per
share.
See “Shareholder
Information—Uncashed Checks on Your Account” for information about uncashed
distribution checks.
126
Taxes
General
The Funds intend to make
distributions that may be taxed as ordinary income or capital gains. In general,
any net investment income and short-term capital gain distributions you receive
from a Fund are taxable as ordinary income. To the extent a Fund receives and
distributes qualified dividend income, you may be eligible for a tax rate lower
than that on other ordinary income distributions, if certain requirements are
satisfied. Distributions of other net capital gains by the Fund are generally
taxable as capital gains—in most cases, at different rates from those that apply
to ordinary income. In addition, there is a possibility that some of the
distributions of Thrivent Diversified Income Plus Fund and Thrivent
Multidimensional Income Fund may be classified as return of capital.
The tax you pay on
a given capital gains distribution generally depends on how long a Fund has held
the Fund securities it sold. It does not depend on how long you have owned your
Fund shares or whether you reinvest your distributions or take them in
cash.
Every year, the
Funds will send you a statement detailing the tax status of all your
distributions for the previous year. The tax statement for all Funds except
Thrivent Diversified Income Plus Fund and Thrivent Multidimensional Income Fund
will be mailed in January. The REIT investments of Thrivent Diversified Income
Plus Fund and Thrivent Multidimensional Income Fund do not provide complete tax
information until after the calendar year-end. Consequently, Thrivent
Diversified Income Plus Fund and Thrivent Multidimensional Income Fund expect to
send your tax statement in late February.
For tax purposes,
an exchange between Funds is the same as a sale. The sale of shares in your
account may produce a gain or loss, which may be a taxable event.
For Fund shares
purchased on or after January 1, 2012 through 1099-B reportable accounts
(“covered shares”), the Fund (other than the Money Market Fund) tracks the cost
basis of these shares pursuant to your cost basis election (e.g., average cost;
last-in, first-out (LIFO)). In the event that you do not elect a particular
method, the average cost method will be used on your covered shares. When you
redeem your covered shares, the Fund will provide you with a tax statement
indicating your capital gains or losses, if any, on the redemption of covered
shares during the applicable tax period and will also report this information to
the Internal Revenue Service. You are required to use this provided information
when filling out your Federal tax return. For more information about the Funds’
practices regarding cost basis, please visit
thriventfunds.com.
Retirement
Plans
Pre-tax
contributions to traditional/SEP/SIMPLE IRAs, 403(b) plans, and tax-qualified
retirement plans are taxable upon
withdrawal.
Investment earnings inside traditional/SEP/SIMPLE IRAs, 403(b) plans, and
tax-qualified retirement plans accumulate on a tax-deferred basis and are
taxable upon withdrawal. The investment earnings portion of any “non-qualified”
Roth IRA withdrawal is also taxable upon withdrawal. If you have any questions
regarding your tax status, please consult with a tax professional.
Back-up
Withholding
By law, the Funds
must withhold 24% of your distributions and proceeds as a prepayment of federal
income tax if you have not provided complete, correct taxpayer information. In
addition, to the extent that a Fund invests less than 50% of its total assets in
municipal bonds, income generated from those bonds and distributed to Fund
shareholders would generally be subject to federal income
tax.
Municipal
Bonds
Dividend
distributions from Thrivent High Income Municipal Bond Fund and Thrivent
Municipal Bond Fund, when not held in an IRA, 403(b) plan, or tax-qualified
retirement plan, are generally exempt from federal income tax. These Funds may,
however, invest a portion of its assets in securities that generate income that
is not exempt from federal income tax or securities that are subject to the
alternative minimum tax. In addition, income of these Funds that is exempt from
federal income tax may be subject to state and local income tax. Any capital
gains distributed by these Funds will be subject to federal and state
taxes.
When held in an
IRA, 403(b) plan, or tax-qualified retirement plan, these Funds are treated like
any other IRA, 403(b) plan, or tax-qualified retirement plan
investment—accumulating on a tax-deferred basis and taxable upon withdrawal. By
electing to invest your IRA, 403(b) plan, or tax-qualified retirement plan in
these Funds, you are not able to take advantage of the federal tax exemption on
any earnings (dividends and capital gains) upon withdrawal. Dividends and
capital gains distributions from these Funds, when held in an IRA, 403(b) plan,
or tax-qualified retirement plan, are reported as taxable income when received.
Please consult with your tax professional for more
information.
Foreign
Securities
Foreign
investments pose special tax issues for Thrivent Global Stock Fund and Thrivent
International Allocation Fund and their shareholders. For example, certain gains
and losses from currency fluctuations may be taxable as ordinary income. Also,
certain foreign countries withhold taxes on some interest and dividends that
otherwise would be payable to these Funds. If the amount withheld is material,
these Funds may elect to pass through a credit to shareholders.
127
Index
Descriptions
The following
table provides additional information about the Funds’ benchmark indices (if
any) listed under “Investment Objective,” the “Average Annual Total Returns”
table, or referenced under “Principal Investment Strategies” in the Fund
summaries.
|
Index |
Description |
Fund |
|
Bloomberg
65% High Grade/35% High
Yield
Bond Index |
The
Bloomberg 65% High Grade/35%
High Yield
Bond Index is a blend of the
Bloomberg
Municipal Bond Index and
the
Bloomberg High Yield Bond Index.
The high
grade index is composed of
investment
grade municipal bonds with
maturities
of one year or more. The high
yield
index is composed of non-
investment
grade or unrated bonds. |
Thrivent
High Income Municipal Bond
Fund |
|
Bloomberg
Government/Credit 1-3
Year
Bond Index |
The
Bloomberg Government/Credit 1-3
Year Bond
Index is an index that
measures
the performance of
government
and corporate fixed-rate
debt
securities with maturities of 1-3
years. |
Thrivent
Limited Maturity Bond Fund |
|
Bloomberg
Emerging Markets USD
Sovereign
Bond Index |
The
Bloomberg Emerging Markets USD
Sovereign
Bond Index is an index that
tracks
fixed and floating-rate U.S. dollar-
denominated
debt issued by emerging
market
governments. |
Thrivent
Multidimensional Income Fund |
|
Bloomberg
Municipal Bond Index |
The
Bloomberg Municipal Bond Index is
a market
value-weighted index of
investment-grade
municipal bonds with
maturities
of one year or more. |
Thrivent
Municipal Bond Fund |
|
Bloomberg
U.S. Agency Index |
The
Bloomberg U.S. Agency Index is an
index that
measures the performance of
the agency
sector of the U.S.
government
bond market. |
Thrivent
Government Bond Fund |
|
Bloomberg
U.S. Aggregate Bond
Index |
The
Bloomberg U.S. Aggregate Bond
Index is
an index that measures the
performance
of U.S. investment grade
bonds. |
Thrivent
Aggressive Allocation Fund |
|
Thrivent
Moderately Aggressive
Allocation
Fund | ||
|
Thrivent
Moderate Allocation Fund | ||
|
Thrivent
Moderately Conservative
Allocation
Fund | ||
|
Bloomberg
U.S. Corporate Bond
Index |
The
Bloomberg U.S. Corporate Bond
Index
measures the investment grade,
fixed-rate,
taxable corporate bond
market and
includes USD denominated
securities
publicly issued by US and
non-US
industrial, utility and financial
issuers. |
Thrivent
Income Fund |
|
Bloomberg
U.S. Corporate High Yield
Bond
Index |
The
Bloomberg U.S. Corporate High
Yield Bond
Index is an index that
measures
the performance of fixed-rate
non-investment
grade bonds. |
Thrivent
High Yield Fund |
|
Thrivent
Multidimensional Income Fund | ||
|
Bloomberg
U.S. High Yield Ba/B 2%
Issuer
Capped Index |
The
Bloomberg U.S. High Yield Ba/B 2%
Issuer
Capped Index is an index that
represents
the performance of high yield
corporate
bonds rated Ba or B, with a
maximum
allocation of 2% to any one
issuer. |
Thrivent
Balanced Income Plus Fund |
|
Thrivent
Diversified Income Plus Fund | ||
|
Thrivent
Opportunity Income Plus Fund
|
128
|
Index |
Description |
Fund |
|
Bloomberg
U.S. Mortgage-Backed
Securities
Index |
The
Bloomberg U.S. Mortgage-Backed
Securities
Index is an index that covers
the
mortgage-backed securities
component
of the Bloomberg
U.S.
Aggregate Bond Index. |
Thrivent
Balanced Income Plus Fund |
|
Thrivent
Diversified Income Plus Fund | ||
|
Thrivent
Opportunity Income Plus Fund | ||
|
Bloomberg
U.S. Treasury Index |
The
Bloomberg U.S. Treasury Index is
an index
that measures the performance
of the
U.S. Treasury bond market. |
Thrivent
Government Bond Fund |
|
MSCI
All Country World Index – USD
Net
Returns |
The MSCI
All Country World Index -
USD Net
Returns is an index that
measures
the performance of developed
and
emerging stock markets throughout
the
world. |
Thrivent
Global Stock Fund |
|
MSCI
All Country World Index ex-USA
–
USD Net Returns |
The MSCI
All Country World Index ex-
USA
– USD Net
Returns is an index that
measures
the performance of stock
markets in
developed and emerging
markets
countries throughout the world
(excluding
the U.S.). |
Thrivent
Aggressive Allocation Fund |
|
Thrivent
International Allocation Fund | ||
|
Thrivent
Moderate Allocation Fund | ||
|
Thrivent
Moderately Aggressive
Allocation
Fund | ||
|
Thrivent
Moderately Conservative
Allocation
Fund | ||
|
MSCI
World Index – USD Net Returns |
The MSCI
World Index – USD Net
Returns is
an index that measures the
performance
of stock markets in
developed
countries throughout the
world. |
Thrivent
Balanced Income Plus Fund |
|
Thrivent
Diversified Income Plus Fund | ||
|
MSCI
World Minimum Volatility Index
–
USD Net Returns |
The MSCI
World Minimum Volatility
Index
– USD Net
Returns is an index
that
measures the performance
characteristics
of a minimum variance
strategy
applied to a universe of large-
and
mid-cap stocks in developed market
countries. |
Thrivent
Low Volatility Equity Fund |
|
Russell
1000®
Growth Index |
The
Russell 1000® Growth
Index is an
unmanaged
market capitalization-
weighted
index of growth-oriented stocks
of the
largest companies that are
included
in the Russell 1000 Index. |
Thrivent
Large Cap Growth Fund |
|
Russell
1000®
Value Index |
The
Russell 1000® Value
Index is an
unmanaged
market capitalization-
weighted
index of value-oriented stocks
of the
largest companies that are
included
in the Russell 1000 Index. |
Thrivent
Large Cap Value Fund |
|
Russell
2000®
Growth Index |
The
Russell 2000® Growth
Index is an
unmanaged
market capitalization-
weighted
index of small-capitalization
growth-oriented
stocks of U.S. based
companies
that are included in the
Russell
2000 Index. |
Thrivent
Small Cap Growth Fund |
|
Russell
2000®
Index |
The
Russell 2000® Index is
an
unmanaged
market capitalization-
weighted
index measuring approximately
2,000 of
the smallest companies in the
Russell
3000 Index. |
Thrivent
Small Cap Stock Fund |
|
Russell
Midcap®
Growth Index |
The
Russell Midcap® Growth
Index is an
unmanaged
market capitalization-
weighted
index of medium-capitalization
growth-oriented
stocks in the Russell
Midcap
Index. |
Thrivent
Mid Cap Growth Fund
|
129
|
Index |
Description |
Fund |
|
Russell
Midcap®
Index |
The
Russell Midcap® Index is
an
unmanaged
market capitalization-
weighted
index measuring the
performance
of approximately 800 of the
smallest
companies in the Russell 1000
Index. |
Thrivent
Mid Cap Stock Fund |
|
Russell
Midcap®
Value Index |
The
Russell Midcap® Value
Index is an
unmanaged
market capitalization-
weighted
index of medium-capitalization
value-oriented
stocks in the Russell
Midcap
Index. |
Thrivent
Mid Cap Value Fund |
|
S&P
500®
Index |
The
S&P 500® Index is
an index that
measures
the performance of 500 widely
held,
publicly traded stocks. |
Thrivent
Aggressive Allocation Fund |
|
Thrivent
Moderately Aggressive
Allocation
Fund | ||
|
Thrivent
Moderate Allocation Fund | ||
|
Thrivent
Moderately Conservative
Allocation
Fund | ||
|
S&P
500 Growth Index |
The
S&P 500 Growth Index is an index
that
measures the performance of the
growth
stocks in the S&P 500 Index. |
Thrivent
Large Cap Growth Fund |
|
S&P
500 Value Index |
The
S&P 500 Value Index is an index
that
measures the performance of the
value
stocks in the S&P 500 Index. |
Thrivent
Large Cap Value Fund |
|
S&P
MidCap 400®
Index |
The
S&P MidCap 400® Index is
an
index that
measures the performance of
400
mid-cap stocks. |
Thrivent
Mid Cap Stock Fund |
|
S&P
MidCap 400 Growth Index |
The
S&P MidCap 400 Growth Index is
an index
that measures the performance
of the
growth stocks in the S&P MidCap
400
Index. |
Thrivent
Mid Cap Growth Fund |
|
S&P
MidCap 400 Value Index |
The
S&P Midcap 400 Value Index is an
index that
measures the performance of
the value
stocks in the S&P MidCap 400
Index. |
Thrivent
Mid Cap Value Fund |
|
S&P
SmallCap 600 Growth Index |
The
S&P SmallCap 600 Growth Index is
an index
that represents the average
performance
of 600 small-capitalization
U.S.
stocks. |
Thrivent
Small Cap Growth Fund |
|
S&P
SmallCap 600®
Index |
The
S&P SmallCap 600® Index is
an
index that
measures the performance of
a group of
600 small-cap stocks. |
Thrivent
Small Cap Stock Fund |
|
S&P
U.S. Preferred Stock Index |
The
S&P U.S. Preferred Stock Index is
an index
that represents the U.S.
preferred
stock market. |
Thrivent
Multidimensional Income Fund |
130
Financial
Highlights
The financial
highlights tables for each of the Funds are intended to help you understand the
Funds’ financial performance for the past five complete fiscal years or, if
shorter, the period of the Funds’ operations. Certain information reflects
financial results for a single Fund share. The total returns in the tables
represent the rate that an investor would have earned or lost on an investment
in a Fund (assuming reinvestment of all dividends and distributions). This
information has been audited by PricewaterhouseCoopers LLP, an independent
registered public accounting firm, whose reports, along with the Funds’
financial statements, are included in the annual reports to
shareholders
for the fiscal year ended October
31, 2023 (for all Funds except Thrivent Diversified Income Plus Fund and
Thrivent Multidimensional Income Fund, whose reports, along with the Funds'
financial statements, are included in the annual report to shareholders for the
fiscal year ended December 31, 2023), which are available upon request. The
financial highlights should be read in conjunction with the financial statements
and notes thereto. The tables do not show the effect of a Class A sales charge
for any of the Funds.
131
Thrivent
Mutual Funds
Financial
Highlights
|
|
PER SHARE
OUTSTANDING THROUGHOUT EACH PERIOD* | |||||
|
|
|
Income
From Investment Operations |
Less
Distributions From | |||
|
|
Net
Asset
Value,
Beginning
of
Period |
Net
Investment
Income/(Loss) |
Net
Realized
and
Unrealized
Gain/(Loss)
on Investments(a) |
Total
from
Investment
Operations |
Net
Investment
Income |
Net
Realized
Gain
on
Investments |
|
Aggressive
Allocation Fund |
| |||||
|
Class
S Shares |
|
|
|
|
|
|
|
Year Ended
10/31/2023 |
$15.65 |
$0.21 |
$0.52 |
$0.73 |
$(0.13) |
$(0.26) |
|
Year Ended
10/31/2022 |
21.04 |
0.14 |
(3.54) |
(3.40) |
(0.22) |
(1.77) |
|
Year Ended
10/31/2021 |
15.58 |
0.06 |
5.95 |
6.01 |
(0.08) |
(0.47) |
|
Year Ended
10/31/2020 |
15.77 |
0.11 |
0.71 |
0.82 |
(0.16) |
(0.85) |
|
Year Ended
10/31/2019 |
15.68 |
0.13 |
1.24 |
1.37 |
(0.16) |
(1.12) |
|
Class
A Shares |
|
|
|
|
|
|
|
Year Ended
10/31/2023 |
15.45 |
0.19 |
0.52 |
0.71 |
(0.11) |
(0.26) |
|
Year Ended
10/31/2022 |
20.79 |
0.09 |
(3.47) |
(3.38) |
(0.19) |
(1.77) |
|
Year Ended
10/31/2021 |
15.41 |
0.03 |
5.88 |
5.91 |
(0.06) |
(0.47) |
|
Year Ended
10/31/2020 |
15.60 |
0.08 |
0.71 |
0.79 |
(0.13) |
(0.85) |
|
Year Ended
10/31/2019 |
15.51 |
0.11 |
1.22 |
1.33 |
(0.12) |
(1.12) |
|
Balanced
Income Plus Fund |
| |||||
|
Class
S Shares |
|
|
|
|
|
|
|
Year Ended
10/31/2023 |
12.10 |
0.41 |
0.02 |
0.43 |
(0.40) |
— |
|
Year Ended
10/31/2022 |
15.30 |
0.32 |
(2.41) |
(2.09) |
(0.32) |
(0.79) |
|
Year Ended
10/31/2021 |
12.60 |
0.24 |
2.71 |
2.95 |
(0.25) |
— |
|
Year Ended
10/31/2020 |
12.66 |
0.29 |
(0.07) |
0.22 |
(0.28) |
— |
|
Year Ended
10/31/2019 |
12.90 |
0.34 |
0.58 |
0.92 |
(0.38) |
(0.78) |
|
Class
A Shares |
|
|
|
|
|
|
|
Year Ended
10/31/2023 |
12.13 |
0.38 |
0.02 |
0.40 |
(0.36) |
— |
|
Year Ended
10/31/2022 |
15.33 |
0.29 |
(2.41) |
(2.12) |
(0.29) |
(0.79) |
|
Year Ended
10/31/2021 |
12.63 |
0.21 |
2.70 |
2.91 |
(0.21) |
— |
|
Year Ended
10/31/2020 |
12.69 |
0.26 |
(0.07) |
0.19 |
(0.25) |
— |
|
Year Ended
10/31/2019 |
12.93 |
0.31 |
0.58 |
0.89 |
(0.35) |
(0.78) |
|
Diversified
Income Plus Fund |
| |||||
|
Class
S Shares |
|
|
|
|
|
|
|
Year Ended
12/31/2023 |
6.45 |
0.28 |
0.35 |
0.63 |
(0.28) |
— |
|
Year Ended
12/31/2022 |
7.62 |
0.21 |
(1.16) |
(0.95) |
(0.22) |
— |
|
Year Ended
12/31/2021 |
7.63 |
0.18 |
0.32 |
0.50 |
(0.18) |
(0.33) |
|
Year Ended
12/31/2020 |
7.34 |
0.20 |
0.30 |
0.50 |
(0.21) |
— |
|
Year Ended
12/31/2019 |
6.73 |
0.23 |
0.66 |
0.89 |
(0.24) |
(0.04) |
|
Class
A Shares |
|
|
|
|
|
|
|
Year Ended
12/31/2023 |
6.53 |
0.27 |
0.35 |
0.62 |
(0.27) |
— |
|
Year Ended
12/31/2022 |
7.70 |
0.20 |
(1.17) |
(0.97) |
(0.20) |
— |
|
Year Ended
12/31/2021 |
7.71 |
0.16 |
0.32 |
0.48 |
(0.16) |
(0.33) |
|
Year Ended
12/31/2020 |
7.42 |
0.19 |
0.29 |
0.48 |
(0.19) |
— |
|
Year Ended
12/31/2019 |
6.80 |
0.21 |
0.67 |
0.88 |
(0.22) |
(0.04) |
(a)The amount
shown may not correlate with the change in aggregate gains and losses of
portfolio securities due to the timing of sales and redemptions of fund
shares.
*All per share
amounts have been rounded to the nearest cent.
132
Thrivent
Mutual Funds
Financial
Highlights – continued
|
|
RATIOS /
SUPPLEMENTAL DATA | |||||||
|
|
|
|
|
Ratio to
Average
Net
Assets** |
Ratios to
Average Net Assets
Before
Expenses Waived,
Credited
or Acquired Fund
Fees and
Expenses** |
| ||
|
Total
Distributions |
Net
Asset
Value,
End
of
Period |
Total Return(b) |
Net
Assets,
End of
Period
(in
millions) |
Expenses |
Net
Investment
Income/(Loss) |
Expenses |
Net
Investment
Income/(Loss) |
Portfolio
Turnover Rate(c) |
|
|
|
|
|
|
|
|
|
|
|
|
|
|
|
|
|
|
|
|
|
$(0.39) |
$15.99 |
4.76% |
$1,013.5 |
0.77% |
1.28% |
0.95% |
1.10% |
43% |
|
(1.99) |
15.65 |
(17.80)% |
865.1 |
0.77% |
0.67% |
0.96% |
0.49% |
42% |
|
(0.55) |
21.04 |
39.35% |
887.9 |
0.74% |
0.29% |
0.94% |
0.09% |
50% |
|
(1.01) |
15.58 |
5.25% |
543.6 |
0.78% |
0.68% |
0.98% |
0.48% |
48% |
|
(1.28) |
15.77 |
9.80% |
445.1 |
0.76% |
0.87% |
0.97% |
0.66% |
58% |
|
|
|
|
|
|
|
|
|
|
|
(0.37) |
15.79 |
4.63% |
1,030.1 |
0.94% |
1.14% |
1.12% |
0.96% |
43% |
|
(1.96) |
15.45 |
(17.92)% |
1,017.5 |
0.93% |
0.54% |
1.12% |
0.35% |
42% |
|
(0.53) |
20.79 |
39.05% |
1,261.7 |
0.91% |
0.15% |
1.11% |
(0.05)% |
50% |
|
(0.98) |
15.41 |
5.12% |
951.7 |
0.95% |
0.57% |
1.15% |
0.37% |
48% |
|
(1.24) |
15.60 |
9.60% |
955.0 |
0.94% |
0.74% |
1.15% |
0.52% |
58% |
|
|
|
|
|
|
|
|
|
|
|
|
|
|
|
|
|
|
|
|
|
(0.40) |
12.13 |
3.46% |
161.1 |
0.76% |
3.23% |
0.76% |
3.23% |
77% |
|
(1.11) |
12.10 |
(14.55)% |
162.3 |
0.74% |
2.42% |
0.74% |
2.42% |
211% |
|
(0.25) |
15.30 |
23.56% |
171.7 |
0.75% |
1.64% |
0.75% |
1.64% |
157% |
|
(0.28) |
12.60 |
1.88% |
108.5 |
0.78% |
2.30% |
0.78% |
2.30% |
85% |
|
(1.16) |
12.66 |
7.92% |
140.1 |
0.77% |
2.75% |
0.77% |
2.75% |
113% |
|
|
|
|
|
|
|
|
|
|
|
(0.36) |
12.17 |
3.28% |
219.2 |
1.00% |
2.99% |
1.01% |
2.98% |
77% |
|
(1.08) |
12.13 |
(14.75)% |
231.8 |
1.00% |
2.16% |
1.00% |
2.16% |
211% |
|
(0.21) |
15.33 |
23.19% |
283.4 |
1.01% |
1.41% |
1.01% |
1.41% |
157% |
|
(0.25) |
12.63 |
1.61% |
235.0 |
1.04% |
2.04% |
1.04% |
2.04% |
85% |
|
(1.13) |
12.69 |
7.60% |
250.2 |
1.04% |
2.49% |
1.04% |
2.49% |
113% |
|
|
|
|
|
|
|
|
|
|
|
|
|
|
|
|
|
|
|
|
|
(0.28) |
6.80 |
10.05% |
549.2 |
0.68% |
4.17% |
0.68% |
4.17% |
80% |
|
(0.22) |
6.45 |
(12.55)% |
571.1 |
0.69% |
3.07% |
0.69% |
3.07% |
278% |
|
(0.51) |
7.62 |
6.55% |
679.1 |
0.68% |
2.28% |
0.68% |
2.28% |
268% |
|
(0.21) |
7.63 |
7.01% |
504.0 |
0.71% |
2.83% |
0.71% |
2.83% |
156% |
|
(0.28) |
7.34 |
13.39% |
464.2 |
0.71% |
3.18% |
0.71% |
3.18% |
153% |
|
|
|
|
|
|
|
|
|
|
|
(0.27) |
6.88 |
9.65% |
470.4 |
0.93% |
3.92% |
0.93% |
3.92% |
80% |
|
(0.20) |
6.53 |
(12.64)% |
495.4 |
0.94% |
2.82% |
0.94% |
2.82% |
278% |
|
(0.49) |
7.70 |
6.22% |
623.5 |
0.93% |
2.01% |
0.93% |
2.01% |
268% |
|
(0.19) |
7.71 |
6.67% |
609.6 |
0.95% |
2.58% |
0.95% |
2.58% |
156% |
|
(0.26) |
7.42 |
13.12% |
620.6 |
0.96% |
2.96% |
0.96% |
2.96% |
153% |
(b)Total return
assumes
dividend
reinvestment
and does not reflect
any deduction for applicable sales charges.
Not annualized for
periods less than one year.
(c)Portfolio turnover rate may
include mortgage dollar roll purchase and sale transactions which may increase
portfolio turnover rates.
Additional
information can be found in the accompanying Notes to Financial
Statements.
**Computed on an annualized basis
for periods less than one year.
133
Thrivent
Mutual Funds
Financial
Highlights – continued
|
|
PER SHARE
OUTSTANDING THROUGHOUT EACH PERIOD* | |||||
|
|
|
Income
From Investment Operations |
Less
Distributions From | |||
|
|
Net
Asset
Value,
Beginning
of
Period |
Net
Investment
Income/(Loss) |
Net
Realized
and
Unrealized
Gain/(Loss)
on Investments(a) |
Total
from
Investment
Operations |
Net
Investment
Income |
Net
Realized
Gain
on
Investments |
|
Global
Stock Fund |
|
|
|
|
|
|
|
Class
S Shares |
|
|
|
|
|
|
|
Year Ended
10/31/2023 |
$23.00 |
$0.51 |
$1.45 |
$1.96 |
$(0.30) |
$(0.50) |
|
Year Ended
10/31/2022 |
33.09 |
0.30 |
(6.17) |
(5.87) |
(0.32) |
(3.90) |
|
Year Ended
10/31/2021 |
24.14 |
0.23 |
9.62 |
9.85 |
(0.27) |
(0.63) |
|
Year Ended
10/31/2020 |
26.46 |
0.24 |
0.64 |
0.88 |
(0.41) |
(2.79) |
|
Year Ended
10/31/2019 |
26.88 |
0.43 |
1.46 |
1.89 |
(0.39) |
(1.92) |
|
Class
A Shares |
|
|
|
|
|
|
|
Year Ended
10/31/2023 |
22.64 |
0.43 |
1.42 |
1.85 |
(0.22) |
(0.50) |
|
Year Ended
10/31/2022 |
32.65 |
0.20 |
(6.08) |
(5.88) |
(0.23) |
(3.90) |
|
Year Ended
10/31/2021 |
23.82 |
0.14 |
9.51 |
9.65 |
(0.19) |
(0.63) |
|
Year Ended
10/31/2020 |
26.16 |
0.15 |
0.62 |
0.77 |
(0.32) |
(2.79) |
|
Year Ended
10/31/2019 |
26.59 |
0.34 |
1.45 |
1.79 |
(0.30) |
(1.92) |
|
Government
Bond Fund |
|
|
|
|
|
|
|
Class
S Shares |
|
|
|
|
|
|
|
Year Ended
10/31/2023 |
8.64 |
0.28 |
(0.37) |
(0.09) |
(0.28) |
— |
|
Year Ended
10/31/2022 |
10.08 |
0.18 |
(1.44) |
(1.26) |
(0.18) |
— |
|
Year Ended
10/31/2021 |
10.53 |
0.11 |
(0.23) |
(0.12) |
(0.11) |
(0.22) |
|
Year Ended
10/31/2020 |
10.11 |
0.15 |
0.44 |
0.59 |
(0.15) |
(0.02) |
|
Year Ended
10/31/2019 |
9.47 |
0.20 |
0.64 |
0.84 |
(0.20) |
— |
|
Class
A Shares |
|
|
|
|
|
|
|
Year Ended
10/31/2023 |
8.64 |
0.26 |
(0.37) |
(0.11) |
(0.26) |
— |
|
Year Ended
10/31/2022 |
10.07 |
0.16 |
(1.43) |
(1.27) |
(0.16) |
— |
|
Year Ended
10/31/2021 |
10.53 |
0.09 |
(0.24) |
(0.15) |
(0.09) |
(0.22) |
|
Year Ended
10/31/2020 |
10.11 |
0.14 |
0.44 |
0.58 |
(0.14) |
(0.02) |
|
Year Ended
10/31/2019 |
9.47 |
0.19 |
0.64 |
0.83 |
(0.19) |
— |
|
High
Income Municipal Bond Fund |
|
|
|
|
|
|
|
Class
S Shares |
|
|
|
|
|
|
|
Year Ended
10/31/2023 |
8.63 |
0.34 |
(0.04) |
0.30 |
(0.34) |
— |
|
Year Ended
10/31/2022 |
10.95 |
0.28 |
(2.32) |
(2.04) |
(0.28) |
— |
|
Year Ended
10/31/2021 |
10.29 |
0.31 |
0.66 |
0.97 |
(0.31) |
— |
|
Year Ended
10/31/2020 |
10.66 |
0.30 |
(0.36) |
(0.06) |
(0.31) |
— |
|
Year Ended
10/31/2019 |
9.86 |
0.31 |
0.81 |
1.12 |
(0.32) |
— |
(a)The amount
shown may not correlate with the change in aggregate gains and losses of
portfolio securities due to the timing of sales and redemptions of fund
shares.
*All per share
amounts have been rounded to the nearest cent.
134
Thrivent
Mutual Funds
Financial
Highlights – continued
|
|
RATIOS /
SUPPLEMENTAL DATA | |||||||
|
|
|
|
|
Ratio to
Average
Net
Assets** |
Ratios to
Average Net Assets
Before
Expenses Waived,
Credited
or Acquired Fund
Fees and
Expenses** |
| ||
|
Total
Distributions |
Net
Asset
Value,
End
of
Period |
Total Return(b) |
Net
Assets,
End of
Period
(in
millions) |
Expenses |
Net
Investment
Income/(Loss) |
Expenses |
Net
Investment
Income/(Loss) |
Portfolio
Turnover Rate(c) |
|
|
|
|
|
|
|
|
|
|
|
|
|
|
|
|
|
|
|
|
|
$(0.80) |
$24.16 |
8.72% |
$371.6 |
0.66% |
2.07% |
0.66% |
2.07% |
62% |
|
(4.22) |
23.00 |
(20.24)% |
343.9 |
0.65% |
1.18% |
0.65% |
1.18% |
58% |
|
(0.90) |
33.09 |
41.67% |
429.9 |
0.64% |
0.78% |
0.64% |
0.78% |
60% |
|
(3.20) |
24.14 |
3.18% |
301.3 |
0.66% |
1.10% |
0.66% |
1.10% |
59% |
|
(2.31) |
26.46 |
8.12% |
296.7 |
0.65% |
1.75% |
0.65% |
1.75% |
73% |
|
|
|
|
|
|
|
|
|
|
|
(0.72) |
23.77 |
8.34% |
1,327.5 |
0.98% |
1.75% |
0.98% |
1.75% |
62% |
|
(4.13) |
22.64 |
(20.51)% |
1,325.5 |
0.97% |
0.85% |
0.97% |
0.85% |
58% |
|
(0.82) |
32.65 |
41.28% |
1,802.8 |
0.96% |
0.45% |
0.96% |
0.45% |
60% |
|
(3.11) |
23.82 |
2.78% |
1,383.1 |
1.02% |
0.75% |
1.02% |
0.75% |
59% |
|
(2.22) |
26.16 |
7.73% |
1,478.5 |
1.01% |
1.39% |
1.01% |
1.39% |
73% |
|
|
|
|
|
|
|
|
|
|
|
|
|
|
|
|
|
|
|
|
|
(0.28) |
8.27 |
(1.21)% |
79.1 |
0.53% |
3.16% |
0.70% |
2.99% |
230% |
|
(0.18) |
8.64 |
(12.60)% |
80.8 |
0.59% |
1.89% |
0.68% |
1.80% |
372% |
|
(0.33) |
10.08 |
(1.21)% |
104.5 |
0.65% |
1.07% |
0.65% |
1.07% |
427% |
|
(0.17) |
10.53 |
5.88% |
83.9 |
0.73% |
1.39% |
0.73% |
1.39% |
322% |
|
(0.20) |
10.11 |
8.95% |
49.9 |
0.75% |
2.04% |
0.77% |
2.02% |
274% |
|
|
|
|
|
|
|
|
|
|
|
(0.26) |
8.27 |
(1.43)% |
2.1 |
0.75% |
2.91% |
1.21% |
2.45% |
230% |
|
(0.16) |
8.64 |
(12.68)% |
2.5 |
0.77% |
1.69% |
1.18% |
1.28% |
372% |
|
(0.31) |
10.07 |
(1.50)% |
3.6 |
0.85% |
0.86% |
1.09% |
0.62% |
427% |
|
(0.16) |
10.53 |
5.76% |
4.1 |
0.85% |
1.32% |
1.08% |
1.10% |
322% |
|
(0.19) |
10.11 |
8.84% |
4.5 |
0.85% |
1.94% |
1.06% |
1.73% |
274% |
|
|
|
|
|
|
|
|
|
|
|
|
|
|
|
|
|
|
|
|
|
(0.34) |
8.59 |
3.36% |
34.9 |
0.60% |
3.77% |
1.22% |
3.15% |
72% |
|
(0.28) |
8.63 |
(18.90)% |
31.1 |
0.60% |
2.77% |
1.20% |
2.18% |
49% |
|
(0.31) |
10.95 |
9.51% |
33.6 |
0.60% |
2.80% |
1.37% |
2.03% |
47% |
|
(0.31) |
10.29 |
(0.56)% |
18.2 |
0.61% |
2.99% |
1.62% |
1.98% |
94% |
|
(0.32) |
10.66 |
11.51% |
13.8 |
0.66% |
3.07% |
2.36% |
1.37% |
93% |
(b)Total return
assumes dividend reinvestment and does not reflect any deduction for applicable
sales charges. Not annualized for periods less than one
year.
(c)Portfolio
turnover rate may include mortgage dollar roll purchase and sale transactions
which may increase portfolio turnover rates. Additional information
can be found in the accompanying Notes to Financial Statements.
**Computed on an
annualized basis for periods less than one year.
135
Thrivent
Mutual Funds
Financial
Highlights – continued
|
|
PER SHARE
OUTSTANDING THROUGHOUT EACH PERIOD* | |||||
|
|
|
Income
From Investment Operations |
Less
Distributions From | |||
|
|
Net
Asset
Value,
Beginning
of
Period |
Net
Investment
Income/(Loss) |
Net
Realized
and
Unrealized
Gain/(Loss)
on Investments(a) |
Total
from
Investment
Operations |
Net
Investment
Income |
Net
Realized
Gain
on
Investments |
|
High
Yield Fund |
|
|
|
|
|
|
|
Class
S Shares |
|
|
|
|
|
|
|
Year Ended
10/31/2023 |
$3.98 |
$0.23 |
$(0.03) |
$0.20 |
$(0.24) |
$— |
|
Year Ended
10/31/2022 |
4.68 |
0.22 |
(0.70) |
(0.48) |
(0.22) |
— |
|
Year Ended
10/31/2021 |
4.49 |
0.22 |
0.19 |
0.41 |
(0.22) |
— |
|
Year Ended
10/31/2020 |
4.73 |
0.24 |
(0.24) |
0.00 |
(0.24) |
— |
|
Year Ended
10/31/2019 |
4.64 |
0.26 |
0.09 |
0.35 |
(0.26) |
— |
|
Class
A Shares |
|
|
|
|
|
|
|
Year Ended
10/31/2023 |
3.97 |
0.22 |
(0.02) |
0.20 |
(0.23) |
— |
|
Year Ended
10/31/2022 |
4.67 |
0.20 |
(0.69) |
(0.49) |
(0.21) |
— |
|
Year Ended
10/31/2021 |
4.49 |
0.20 |
0.18 |
0.38 |
(0.20) |
— |
|
Year Ended
10/31/2020 |
4.73 |
0.22 |
(0.23) |
(0.01) |
(0.23) |
— |
|
Year Ended
10/31/2019 |
4.63 |
0.25 |
0.10 |
0.35 |
(0.25) |
— |
|
Income
Fund |
|
|
|
|
|
|
|
Class
S Shares |
|
|
|
|
|
|
|
Year Ended
10/31/2023 |
7.53 |
0.32 |
(0.07) |
0.25 |
(0.32) |
— |
|
Year Ended
10/31/2022 |
9.79 |
0.27 |
(2.09) |
(1.82) |
(0.28) |
(0.16) |
|
Year Ended
10/31/2021 |
9.98 |
0.27 |
0.08 |
0.35 |
(0.27) |
(0.27) |
|
Year Ended
10/31/2020 |
9.55 |
0.29 |
0.47 |
0.76 |
(0.29) |
(0.04) |
|
Year Ended
10/31/2019 |
8.70 |
0.32 |
0.85 |
1.17 |
(0.32) |
— |
|
Class
A Shares |
|
|
|
|
|
|
|
Year Ended
10/31/2023 |
7.53 |
0.30 |
(0.08) |
0.22 |
(0.29) |
— |
|
Year Ended
10/31/2022 |
9.80 |
0.25 |
(2.11) |
(1.86) |
(0.25) |
(0.16) |
|
Year Ended
10/31/2021 |
9.99 |
0.25 |
0.07 |
0.32 |
(0.24) |
(0.27) |
|
Year Ended
10/31/2020 |
9.56 |
0.26 |
0.47 |
0.73 |
(0.26) |
(0.04) |
|
Year Ended
10/31/2019 |
8.70 |
0.29 |
0.86 |
1.15 |
(0.29) |
— |
|
International
Allocation Fund |
|
|
|
|
|
|
|
Class
S Shares |
|
|
|
|
|
|
|
Year Ended
10/31/2023 |
8.36 |
0.27 |
0.74 |
1.01 |
(0.19) |
— |
|
Year Ended
10/31/2022 |
12.21 |
0.19 |
(2.97) |
(2.78) |
(0.26) |
(0.81) |
|
Year Ended
10/31/2021 |
9.19 |
0.18 |
3.01 |
3.19 |
(0.17) |
— |
|
Year Ended
10/31/2020 |
10.23 |
0.14 |
(0.92) |
(0.78) |
(0.26) |
— |
|
Year Ended
10/31/2019 |
9.87 |
0.23 |
0.67 |
0.90 |
(0.22) |
(0.32) |
|
Class
A Shares |
|
|
|
|
|
|
|
Year Ended
10/31/2023 |
8.29 |
0.25 |
0.73 |
0.98 |
(0.15) |
— |
|
Year Ended
10/31/2022 |
12.13 |
0.15 |
(2.97) |
(2.82) |
(0.21) |
(0.81) |
|
Year Ended
10/31/2021 |
9.13 |
0.15 |
2.98 |
3.13 |
(0.13) |
— |
|
Year Ended
10/31/2020 |
10.16 |
0.12 |
(0.93) |
(0.81) |
(0.22) |
— |
|
Year Ended
10/31/2019 |
9.80 |
0.20 |
0.65 |
0.85 |
(0.17) |
(0.32) |
(a)The amount
shown may not correlate with the change in aggregate gains and losses of
portfolio securities due to the timing of sales and redemptions of fund
shares.
*All per share
amounts have been rounded to the nearest cent.
136
Thrivent
Mutual Funds
Financial
Highlights – continued
|
|
RATIOS /
SUPPLEMENTAL DATA | |||||||
|
|
|
|
|
Ratio to
Average
Net
Assets** |
Ratios to
Average Net Assets
Before
Expenses Waived,
Credited
or Acquired Fund
Fees and
Expenses** |
| ||
|
Total
Distributions |
Net
Asset
Value,
End
of
Period |
Total Return(b) |
Net
Assets,
End of
Period
(in
millions) |
Expenses |
Net
Investment
Income/(Loss) |
Expenses |
Net
Investment
Income/(Loss) |
Portfolio
Turnover Rate(c) |
|
|
|
|
|
|
|
|
|
|
|
|
|
|
|
|
|
|
|
|
|
$(0.24) |
$3.94 |
4.99% |
$339.6 |
0.54% |
5.78% |
0.54% |
5.78% |
28% |
|
(0.22) |
3.98 |
(10.45)% |
327.9 |
0.53% |
5.01% |
0.53% |
5.01% |
37% |
|
(0.22) |
4.68 |
9.15% |
422.8 |
0.52% |
4.62% |
0.52% |
4.62% |
64% |
|
(0.24) |
4.49 |
0.11% |
401.2 |
0.53% |
5.22% |
0.53% |
5.22% |
62% |
|
(0.26) |
4.73 |
7.79% |
342.1 |
0.54% |
5.55% |
0.54% |
5.55% |
42% |
|
|
|
|
|
|
|
|
|
|
|
(0.23) |
3.94 |
4.97% |
312.8 |
0.81% |
5.51% |
0.81% |
5.51% |
28% |
|
(0.21) |
3.97 |
(10.73)% |
327.1 |
0.80% |
4.75% |
0.80% |
4.75% |
37% |
|
(0.20) |
4.67 |
8.63% |
402.6 |
0.79% |
4.36% |
0.79% |
4.36% |
64% |
|
(0.23) |
4.49 |
(0.16)% |
407.1 |
0.80% |
4.96% |
0.80% |
4.96% |
62% |
|
(0.25) |
4.73 |
7.74% |
437.9 |
0.80% |
5.30% |
0.80% |
5.30% |
42% |
|
|
|
|
|
|
|
|
|
|
|
|
|
|
|
|
|
|
|
|
|
(0.32) |
7.46 |
3.12% |
659.6 |
0.47% |
4.09% |
0.47% |
4.09% |
48% |
|
(0.44) |
7.53 |
(19.20)% |
622.3 |
0.46% |
3.14% |
0.46% |
3.14% |
39% |
|
(0.54) |
9.79 |
3.51% |
833.6 |
0.46% |
2.78% |
0.46% |
2.78% |
54% |
|
(0.33) |
9.98 |
8.11% |
732.9 |
0.46% |
2.98% |
0.46% |
2.98% |
105% |
|
(0.32) |
9.55 |
13.66% |
598.6 |
0.46% |
3.49% |
0.46% |
3.49% |
99% |
|
|
|
|
|
|
|
|
|
|
|
(0.29) |
7.46 |
2.82% |
215.6 |
0.77% |
3.79% |
0.77% |
3.79% |
48% |
|
(0.41) |
7.53 |
(19.52)% |
232.0 |
0.75% |
2.84% |
0.75% |
2.84% |
39% |
|
(0.51) |
9.80 |
3.23% |
327.9 |
0.74% |
2.50% |
0.74% |
2.50% |
54% |
|
(0.30) |
9.99 |
7.79% |
337.9 |
0.75% |
2.69% |
0.75% |
2.69% |
105% |
|
(0.29) |
9.56 |
13.43% |
313.7 |
0.77% |
3.19% |
0.77% |
3.19% |
99% |
|
|
|
|
|
|
|
|
|
|
|
|
|
|
|
|
|
|
|
|
|
(0.19) |
9.18 |
12.15% |
588.4 |
0.80% |
2.64% |
0.81% |
2.62% |
92% |
|
(1.07) |
8.36 |
(24.90)% |
644.7 |
0.81% |
2.03% |
0.81% |
2.03% |
90% |
|
(0.17) |
12.21 |
34.98% |
849.7 |
0.82% |
1.55% |
0.82% |
1.55% |
124% |
|
(0.26) |
9.19 |
(7.90)% |
632.9 |
0.81% |
1.47% |
0.81% |
1.47% |
105% |
|
(0.54) |
10.23 |
9.84% |
743.0 |
0.87% |
2.45% |
0.87% |
2.45% |
106% |
|
|
|
|
|
|
|
|
|
|
|
(0.15) |
9.12 |
11.89% |
98.5 |
1.16% |
2.32% |
1.34% |
2.14% |
92% |
|
(1.02) |
8.29 |
(25.28)% |
97.2 |
1.20% |
1.62% |
1.34% |
1.48% |
90% |
|
(0.13) |
12.13 |
34.52% |
143.6 |
1.20% |
1.17% |
1.34% |
1.03% |
124% |
|
(0.22) |
9.13 |
(8.21)% |
117.0 |
1.20% |
1.07% |
1.38% |
0.89% |
105% |
|
(0.49) |
10.16 |
9.36% |
144.3 |
1.27% |
2.04% |
1.43% |
1.89% |
106% |
(b)Total return
assumes dividend reinvestment and does not reflect any deduction for applicable
sales charges. Not annualized for periods less than one
year.
(c)Portfolio
turnover rate may include mortgage dollar roll purchase and sale transactions
which may increase portfolio turnover rates. Additional information
can be found in the accompanying Notes to Financial Statements.
**Computed on an
annualized basis for periods less than one year.
137
Thrivent
Mutual Funds
Financial
Highlights – continued
|
|
PER SHARE
OUTSTANDING THROUGHOUT EACH PERIOD* | |||||
|
|
|
Income
From Investment Operations |
Less
Distributions From | |||
|
|
Net
Asset
Value,
Beginning
of
Period |
Net
Investment
Income/(Loss) |
Net
Realized
and
Unrealized
Gain/(Loss)
on Investments(a) |
Total
from
Investment
Operations |
Net
Investment
Income |
Net
Realized
Gain
on
Investments |
|
Large
Cap Growth Fund |
|
|
|
|
|
|
|
Class
S Shares |
|
|
|
|
|
|
|
Year Ended
10/31/2023 |
$13.91 |
$0.03 |
$2.79 |
$2.82 |
$— |
$(0.99) |
|
Year Ended
10/31/2022 |
21.57 |
(0.05) |
(6.40) |
(6.45) |
— |
(1.21) |
|
Year Ended
10/31/2021 |
16.30 |
(0.08) |
6.54 |
6.46 |
— |
(1.19) |
|
Year Ended
10/31/2020 |
12.82 |
(0.02) |
4.13 |
4.11 |
— |
(0.63) |
|
Year Ended
10/31/2019 |
12.47 |
0.01 |
1.48 |
1.49 |
— |
(1.14) |
|
Class
A Shares |
|
|
|
|
|
|
|
Year Ended
10/31/2023 |
12.01 |
0.02 |
2.34 |
2.36 |
— |
(0.99) |
|
Year Ended
10/31/2022 |
18.84 |
(0.07) |
(5.55) |
(5.62) |
— |
(1.21) |
|
Year Ended
10/31/2021 |
14.42 |
(0.10) |
5.71 |
5.61 |
— |
(1.19) |
|
Year Ended
10/31/2020 |
11.45 |
(0.04) |
3.64 |
3.60 |
— |
(0.63) |
|
Year Ended
10/31/2019 |
11.30 |
(0.02) |
1.31 |
1.29 |
— |
(1.14) |
|
Large
Cap Value Fund |
|
|
|
|
|
|
|
Class
S Shares |
|
|
|
|
|
|
|
Year Ended
10/31/2023 |
26.77 |
0.53 |
(0.32) |
0.21 |
(0.47) |
(1.15) |
|
Year Ended
10/31/2022 |
30.00 |
0.52 |
(1.52) |
(1.00) |
(0.36) |
(1.87) |
|
Year Ended
10/31/2021 |
20.59 |
0.40 |
10.54 |
10.94 |
(0.35) |
(1.18) |
|
Year Ended
10/31/2020 |
22.70 |
0.43 |
(2.10) |
(1.67) |
(0.44) |
— |
|
Year Ended
10/31/2019 |
22.90 |
0.43 |
0.89 |
1.32 |
(0.35) |
(1.17) |
|
Class
A Shares |
|
|
|
|
|
|
|
Year Ended
10/31/2023 |
26.51 |
0.47 |
(0.34) |
0.13 |
(0.39) |
(1.15) |
|
Year Ended
10/31/2022 |
29.73 |
0.41 |
(1.49) |
(1.08) |
(0.27) |
(1.87) |
|
Year Ended
10/31/2021 |
20.42 |
0.30 |
10.47 |
10.77 |
(0.28) |
(1.18) |
|
Year Ended
10/31/2020 |
22.51 |
0.37 |
(2.10) |
(1.73) |
(0.36) |
— |
|
Year Ended
10/31/2019 |
22.71 |
0.36 |
0.88 |
1.24 |
(0.27) |
(1.17) |
|
Limited
Maturity Bond Fund |
|
|
|
|
|
|
|
Class
S Shares |
|
|
|
|
|
|
|
Year Ended
10/31/2023 |
11.65 |
0.35 |
0.23 |
0.58 |
(0.36) |
— |
|
Year Ended
10/31/2022 |
12.65 |
0.21 |
(0.98) |
(0.77) |
(0.22) |
(0.01) |
|
Year Ended
10/31/2021 |
12.67 |
0.19 |
(0.02) |
0.17 |
(0.19) |
— |
|
Year Ended
10/31/2020 |
12.52 |
0.28 |
0.15 |
0.43 |
(0.28) |
— |
|
Year Ended
10/31/2019 |
12.30 |
0.33 |
0.22 |
0.55 |
(0.33) |
— |
|
Class
A Shares |
|
|
|
|
|
|
|
Year Ended
10/31/2023 |
11.66 |
0.34 |
0.21 |
0.55 |
(0.34) |
— |
|
Year Ended
10/31/2022 |
12.65 |
0.19 |
(0.97) |
(0.78) |
(0.20) |
(0.01) |
|
Year Ended
10/31/2021 |
12.67 |
0.17 |
(0.02) |
0.15 |
(0.17) |
— |
|
Year Ended
10/31/2020 |
12.53 |
0.25 |
0.14 |
0.39 |
(0.25) |
— |
|
Year Ended
10/31/2019 |
12.30 |
0.30 |
0.24 |
0.54 |
(0.31) |
— |
(a)The amount
shown may not correlate with the change in aggregate gains and losses of
portfolio securities due to the timing of sales and redemptions of fund
shares.
*All per share
amounts have been rounded to the nearest cent.
138
Thrivent
Mutual Funds
Financial
Highlights – continued
|
|
RATIOS /
SUPPLEMENTAL DATA | |||||||
|
|
|
|
|
Ratio to
Average
Net
Assets** |
Ratios to
Average Net Assets
Before
Expenses Waived,
Credited
or Acquired Fund
Fees and
Expenses** |
| ||
|
Total
Distributions |
Net
Asset
Value,
End
of
Period |
Total Return(b) |
Net
Assets,
End of
Period
(in
millions) |
Expenses |
Net
Investment
Income/(Loss) |
Expenses |
Net
Investment
Income/(Loss) |
Portfolio
Turnover Rate(c) |
|
|
|
|
|
|
|
|
|
|
|
|
|
|
|
|
|
|
|
|
|
$(0.99) |
$15.74 |
21.97% |
$1,751.7 |
0.76% |
0.25% |
0.76% |
0.25% |
52% |
|
(1.21) |
13.91 |
(31.65)% |
1,339.4 |
0.76% |
(0.25)% |
0.76% |
(0.25)% |
51% |
|
(1.19) |
21.57 |
41.62% |
1,799.2 |
0.76% |
(0.38)% |
0.76% |
(0.38)% |
40% |
|
(0.63) |
16.30 |
33.39% |
1,136.4 |
0.77% |
(0.08)% |
0.77% |
(0.08)% |
44% |
|
(1.14) |
12.82 |
13.49% |
839.6 |
0.79% |
0.08% |
0.79% |
0.08% |
58% |
|
|
|
|
|
|
|
|
|
|
|
(0.99) |
13.38 |
21.60% |
382.7 |
1.06% |
(0.04)% |
1.06% |
(0.04)% |
52% |
|
(1.21) |
12.01 |
(31.84)% |
318.8 |
1.06% |
(0.55)% |
1.06% |
(0.55)% |
51% |
|
(1.19) |
18.84 |
41.13% |
480.2 |
1.06% |
(0.67)% |
1.06% |
(0.67)% |
40% |
|
(0.63) |
14.42 |
32.91% |
351.2 |
1.12% |
(0.42)% |
1.12% |
(0.42)% |
44% |
|
(1.14) |
11.45 |
13.09% |
259.0 |
1.14% |
(0.26)% |
1.17% |
(0.29)% |
58% |
|
|
|
|
|
|
|
|
|
|
|
|
|
|
|
|
|
|
|
|
|
(1.62) |
25.36 |
0.75% |
1,640.0 |
0.56% |
2.08% |
0.56% |
2.08% |
21% |
|
(2.23) |
26.77 |
(3.61)% |
1,556.5 |
0.55% |
1.96% |
0.55% |
1.96% |
21% |
|
(1.53) |
30.00 |
55.43% |
1,520.4 |
0.54% |
1.56% |
0.54% |
1.56% |
23% |
|
(0.44) |
20.59 |
(7.61)% |
869.6 |
0.54% |
2.00% |
0.54% |
2.00% |
34% |
|
(1.52) |
22.70 |
6.61% |
927.3 |
0.54% |
2.03% |
0.54% |
2.03% |
19% |
|
|
|
|
|
|
|
|
|
|
|
(1.54) |
25.10 |
0.46% |
267.9 |
0.85% |
1.79% |
0.85% |
1.79% |
21% |
|
(2.14) |
26.51 |
(3.89)% |
288.6 |
0.85% |
1.65% |
0.85% |
1.65% |
21% |
|
(1.46) |
29.73 |
54.89% |
296.5 |
0.86% |
1.25% |
0.86% |
1.25% |
23% |
|
(0.36) |
20.42 |
(7.90)% |
193.5 |
0.91% |
1.64% |
0.91% |
1.64% |
34% |
|
(1.44) |
22.51 |
6.22% |
225.1 |
0.90% |
1.67% |
0.90% |
1.67% |
19% |
|
|
|
|
|
|
|
|
|
|
|
|
|
|
|
|
|
|
|
|
|
(0.36) |
11.87 |
5.01% |
1,052.2 |
0.43% |
2.98% |
0.43% |
2.98% |
53% |
|
(0.23) |
11.65 |
(6.16)% |
1,113.7 |
0.42% |
1.69% |
0.42% |
1.69% |
50% |
|
(0.19) |
12.65 |
1.31% |
1,346.8 |
0.41% |
1.45% |
0.41% |
1.45% |
169% |
|
(0.28) |
12.67 |
3.45% |
1,025.0 |
0.43% |
2.19% |
0.43% |
2.19% |
153% |
|
(0.33) |
12.52 |
4.51% |
729.2 |
0.43% |
2.63% |
0.43% |
2.63% |
109% |
|
|
|
|
|
|
|
|
|
|
|
(0.34) |
11.87 |
4.76% |
240.9 |
0.58% |
2.82% |
0.58% |
2.82% |
53% |
|
(0.21) |
11.66 |
(6.22)% |
285.3 |
0.57% |
1.54% |
0.57% |
1.54% |
50% |
|
(0.17) |
12.65 |
1.16% |
365.9 |
0.56% |
1.31% |
0.56% |
1.31% |
169% |
|
(0.25) |
12.67 |
3.20% |
342.2 |
0.60% |
2.03% |
0.60% |
2.03% |
153% |
|
(0.31) |
12.53 |
4.40% |
292.0 |
0.61% |
2.45% |
0.61% |
2.45% |
109% |
(b)Total return
assumes dividend reinvestment and does not reflect any deduction for applicable
sales charges. Not annualized for periods less than one
year.
(c)Portfolio
turnover rate may include mortgage dollar roll purchase and sale transactions
which may increase portfolio turnover rates. Additional information
can be found in the accompanying Notes to Financial Statements.
**Computed on an
annualized basis for periods less than one year.
139
Thrivent
Mutual Funds
Financial
Highlights – continued
|
|
PER SHARE
OUTSTANDING THROUGHOUT EACH PERIOD* | |||||
|
|
|
Income
From Investment Operations |
Less
Distributions From | |||
|
|
Net
Asset
Value,
Beginning
of
Period |
Net
Investment
Income/(Loss) |
Net
Realized
and
Unrealized
Gain/(Loss)
on Investments(a) |
Total
from
Investment
Operations |
Net
Investment
Income |
Net
Realized
Gain
on
Investments |
|
Low
Volatility Equity Fund |
|
|
|
|
|
|
|
Class
S Shares |
|
|
|
|
|
|
|
Year Ended
10/31/2023 |
$11.85 |
$0.25 |
$0.27 |
$0.52 |
$(0.17) |
$(0.15) |
|
Year Ended
10/31/2022 |
14.16 |
0.15 |
(1.65) |
(1.50) |
(0.15) |
(0.66) |
|
Year Ended
10/31/2021 |
11.58 |
0.16 |
2.62 |
2.78 |
(0.20) |
— |
|
Year Ended
10/31/2020 |
12.20 |
0.18 |
(0.57) |
(0.39) |
(0.14) |
(0.09) |
|
Year Ended
10/31/2019 |
10.85 |
0.14 |
1.52 |
1.66 |
(0.13) |
(0.18) |
|
Mid
Cap Growth Fund |
|
|
|
|
|
|
|
Class
S Shares |
|
|
|
|
|
|
|
Year Ended
10/31/2023 |
11.74 |
(0.03) |
(0.23) |
(0.26) |
— |
— |
|
Year Ended
10/31/2022 |
17.34 |
(0.05) |
(5.05) |
(5.10) |
— |
(0.50) |
|
Year Ended
10/31/2021 |
12.65 |
(0.07) |
5.18 |
5.11 |
— |
(0.42) |
|
Year Ended
10/31/2020(d) |
10.00 |
(0.05) |
2.70 |
2.65 |
— |
— |
|
Mid
Cap Stock Fund |
|
|
|
|
|
|
|
Class
S Shares |
|
|
|
|
|
|
|
Year Ended
10/31/2023 |
31.71 |
0.13 |
(1.38) |
(1.25) |
(0.11) |
(0.76) |
|
Year Ended
10/31/2022 |
41.63 |
0.05 |
(5.87) |
(5.82) |
(0.04) |
(4.06) |
|
Year Ended
10/31/2021(e) |
28.04 |
0.05 |
14.62 |
14.67 |
(0.09) |
(0.99) |
|
Year Ended
10/31/2020 |
27.10 |
0.10 |
1.61 |
1.71 |
(0.10) |
(0.67) |
|
Year Ended
10/31/2019 |
28.06 |
0.01 |
1.71 |
1.72 |
(0.11) |
(2.57) |
|
Class
A Shares |
|
|
|
|
|
|
|
Year Ended
10/31/2023 |
26.95 |
0.07 |
(1.19) |
(1.12) |
(0.05) |
(0.76) |
|
Year Ended
10/31/2022 |
36.05 |
0.04 |
(5.08) |
(5.04) |
— |
(4.06) |
|
Year Ended
10/31/2021 |
24.40 |
(0.04) |
12.71 |
12.67 |
(0.03) |
(0.99) |
|
Year Ended
10/31/2020 |
23.68 |
0.01 |
1.42 |
1.43 |
(0.04) |
(0.67) |
|
Year Ended
10/31/2019 |
24.87 |
0.06 |
1.36 |
1.42 |
(0.04) |
(2.57) |
|
Mid
Cap Value Fund |
|
|
|
|
|
|
|
Class
S Shares |
|
|
|
|
|
|
|
Year Ended
10/31/2023 |
15.09 |
0.20 |
(0.55) |
(0.35) |
(0.13) |
(0.32) |
|
Year Ended
10/31/2022 |
16.16 |
0.14 |
(0.55) |
(0.41) |
(0.04) |
(0.62) |
|
Year Ended
10/31/2021 |
10.20 |
0.07 |
5.97 |
6.04 |
(0.08) |
— |
|
Year Ended
10/31/2020(d)
|
10.00 |
0.05 |
0.15 |
0.20 |
— |
— |
(a)The amount
shown may not correlate with the change in aggregate gains and losses of
portfolio securities due to the timing of sales and redemptions of fund
shares.
(d)Since fund
inception, February 28, 2020.
(e)Per share
amounts have been calculated using the average shares method.
*All per share
amounts have been rounded to the nearest cent.
140
Thrivent
Mutual Funds
Financial
Highlights – continued
|
|
RATIOS /
SUPPLEMENTAL DATA | |||||||
|
|
|
|
|
Ratio to
Average
Net
Assets** |
Ratios to
Average Net Assets
Before
Expenses Waived,
Credited
or Acquired Fund
Fees and
Expenses** |
| ||
|
Total
Distributions |
Net
Asset
Value,
End
of
Period |
Total Return(b) |
Net
Assets,
End of
Period
(in
millions) |
Expenses |
Net
Investment
Income/(Loss) |
Expenses |
Net
Investment
Income/(Loss) |
Portfolio
Turnover Rate(c) |
|
|
|
|
|
|
|
|
|
|
|
|
|
|
|
|
|
|
|
|
|
$(0.32) |
$12.05 |
4.38% |
$26.0 |
0.95% |
1.84% |
1.42% |
1.37% |
88% |
|
(0.81) |
11.85 |
(11.33)% |
29.2 |
0.95% |
1.28% |
1.41% |
0.82% |
76% |
|
(0.20) |
14.16 |
24.25% |
29.5 |
0.95% |
1.15% |
1.43% |
0.67% |
75% |
|
(0.23) |
11.58 |
(3.33)% |
28.5 |
0.98% |
1.68% |
1.44% |
1.21% |
72% |
|
(0.31) |
12.20 |
15.75% |
19.3 |
1.20% |
1.59% |
1.96% |
0.83% |
58% |
|
|
|
|
|
|
|
|
|
|
|
|
|
|
|
|
|
|
|
|
|
— |
11.48 |
(2.21)% |
25.1 |
0.90% |
(0.36)% |
1.82% |
(1.28)% |
42% |
|
(0.50) |
11.74 |
(30.15)% |
20.3 |
0.90% |
(0.50)% |
2.08% |
(1.69)% |
33% |
|
(0.42) |
17.34 |
41.11% |
19.3 |
0.92% |
(0.58)% |
2.33% |
(1.99)% |
61% |
|
— |
12.65 |
26.50% |
6.0 |
1.00% |
(0.62)% |
3.60% |
(3.23)% |
57% |
|
|
|
|
|
|
|
|
|
|
|
|
|
|
|
|
|
|
|
|
|
(0.87) |
29.59 |
(4.05)% |
2,274.6 |
0.75% |
0.50% |
0.75% |
0.50% |
32% |
|
(4.10) |
31.71 |
(15.41)% |
2,083.1 |
0.75% |
0.29% |
0.75% |
0.29% |
27% |
|
(1.08) |
41.63 |
53.40% |
2,148.8 |
0.74% |
0.14% |
0.74% |
0.14% |
48% |
|
(0.77) |
28.04 |
6.37% |
1,100.6 |
0.76% |
0.37% |
0.76% |
0.37% |
40% |
|
(2.68) |
27.10 |
7.25% |
1,081.0 |
0.77% |
0.50% |
0.77% |
0.50% |
28% |
|
|
|
|
|
|
|
|
|
|
|
(0.81) |
25.02 |
(4.28)% |
1,235.3 |
0.97% |
0.28% |
0.97% |
0.28% |
32% |
|
(4.06) |
26.95 |
(15.62)% |
1,370.5 |
0.97% |
0.07% |
0.97% |
0.07% |
27% |
|
(1.02) |
36.05 |
53.09% |
1,651.7 |
0.98% |
(0.11)% |
0.98% |
(0.11)% |
48% |
|
(0.71) |
24.40 |
6.08% |
1,146.3 |
1.04% |
0.10% |
1.04% |
0.10% |
40% |
|
(2.61) |
23.68 |
6.89% |
1,174.7 |
1.04% |
0.22% |
1.04% |
0.22% |
28% |
|
|
|
|
|
|
|
|
|
|
|
|
|
|
|
|
|
|
|
|
|
(0.45) |
14.29 |
(2.40)% |
33.2 |
0.90% |
1.42% |
1.56% |
0.76% |
43% |
|
(0.66) |
15.09 |
(2.70)% |
19.8 |
0.90% |
1.07% |
2.04% |
(0.07)% |
31% |
|
(0.08) |
16.16 |
59.38% |
12.0 |
0.92% |
0.53% |
2.73% |
(1.28)% |
36% |
|
— |
10.20 |
2.00% |
5.0 |
1.00% |
0.75% |
3.80% |
(2.04)% |
58% |
(b)Total return
assumes dividend reinvestment and does not reflect any deduction for applicable
sales charges. Not annualized for periods less than one
year.
(c)Portfolio
turnover rate may include mortgage dollar roll purchase and sale transactions
which may increase portfolio turnover rates. Additional information
can be found in the accompanying Notes to Financial Statements.
**Computed on an
annualized basis for periods less than one year.
141
Thrivent
Mutual Funds
Financial
Highlights – continued
|
|
PER SHARE
OUTSTANDING THROUGHOUT EACH PERIOD* | |||||
|
|
|
Income
From Investment Operations |
Less
Distributions From | |||
|
|
Net
Asset
Value,
Beginning
of
Period |
Net
Investment
Income/(Loss) |
Net
Realized
and
Unrealized
Gain/(Loss)
on Investments(a) |
Total
from
Investment
Operations |
Net
Investment
Income |
Net
Realized
Gain
on
Investments |
|
Moderate
Allocation Fund |
|
|
|
|
|
|
|
Class
S Shares |
|
|
|
|
|
|
|
Year Ended
10/31/2023 |
$13.26 |
$0.29 |
$0.30 |
$0.59 |
$(0.29) |
$— |
|
Year Ended
10/31/2022 |
16.94 |
0.20 |
(2.81) |
(2.61) |
(0.27) |
(0.80) |
|
Year Ended
10/31/2021 |
14.33 |
0.18 |
3.05 |
3.23 |
(0.18) |
(0.44) |
|
Year Ended
10/31/2020 |
14.19 |
0.21 |
0.67 |
0.88 |
(0.22) |
(0.52) |
|
Year Ended
10/31/2019 |
13.41 |
0.25 |
1.11 |
1.36 |
(0.27) |
(0.31) |
|
Class
A Shares |
|
|
|
|
|
|
|
Year Ended
10/31/2023 |
13.22 |
0.26 |
0.30 |
0.56 |
(0.26) |
— |
|
Year Ended
10/31/2022 |
16.89 |
0.16 |
(2.80) |
(2.64) |
(0.23) |
(0.80) |
|
Year Ended
10/31/2021 |
14.29 |
0.14 |
3.05 |
3.19 |
(0.15) |
(0.44) |
|
Year Ended
10/31/2020 |
14.15 |
0.18 |
0.66 |
0.84 |
(0.18) |
(0.52) |
|
Year Ended
10/31/2019 |
13.37 |
0.21 |
1.12 |
1.33 |
(0.24) |
(0.31) |
|
Moderately
Aggressive Allocation Fund |
|
|
|
|
|
|
|
Class
S Shares |
|
|
|
|
|
|
|
Year Ended
10/31/2023 |
14.61 |
0.25 |
0.42 |
0.67 |
(0.18) |
(0.28) |
|
Year Ended
10/31/2022 |
18.97 |
0.18 |
(3.27) |
(3.09) |
(0.27) |
(1.00) |
|
Year Ended
10/31/2021 |
15.31 |
0.13 |
4.24 |
4.37 |
(0.15) |
(0.56) |
|
Year Ended
10/31/2020 |
15.38 |
0.17 |
0.72 |
0.89 |
(0.20) |
(0.76) |
|
Year Ended
10/31/2019 |
14.75 |
0.20 |
1.25 |
1.45 |
(0.23) |
(0.59) |
|
Class
A Shares |
|
|
|
|
|
|
|
Year Ended
10/31/2023 |
14.45 |
0.22 |
0.41 |
0.63 |
(0.15) |
(0.28) |
|
Year Ended
10/31/2022 |
18.78 |
0.13 |
(3.23) |
(3.10) |
(0.23) |
(1.00) |
|
Year Ended
10/31/2021 |
15.16 |
0.10 |
4.20 |
4.30 |
(0.12) |
(0.56) |
|
Year Ended
10/31/2020 |
15.24 |
0.15 |
0.70 |
0.85 |
(0.17) |
(0.76) |
|
Year Ended
10/31/2019 |
14.62 |
0.17 |
1.23 |
1.40 |
(0.19) |
(0.59) |
|
Moderately
Conservative Allocation Fund |
|
|
|
|
|
|
|
Class
S Shares |
|
|
|
|
|
|
|
Year Ended
10/31/2023 |
11.27 |
0.32 |
0.01 |
0.33 |
(0.31) |
— |
|
Year Ended
10/31/2022 |
13.97 |
0.22 |
(2.36) |
(2.14) |
(0.26) |
(0.30) |
|
Year Ended
10/31/2021 |
12.80 |
0.19 |
1.49 |
1.68 |
(0.19) |
(0.32) |
|
Year Ended
10/31/2020 |
12.74 |
0.23 |
0.47 |
0.70 |
(0.23) |
(0.41) |
|
Year Ended
10/31/2019 |
12.02 |
0.27 |
0.93 |
1.20 |
(0.29) |
(0.19) |
|
Class
A Shares |
|
|
|
|
|
|
|
Year Ended
10/31/2023 |
11.23 |
0.29 |
0.01 |
0.30 |
(0.28) |
— |
|
Year Ended
10/31/2022 |
13.92 |
0.19 |
(2.35) |
(2.16) |
(0.23) |
(0.30) |
|
Year Ended
10/31/2021 |
12.76 |
0.16 |
1.48 |
1.64 |
(0.16) |
(0.32) |
|
Year Ended
10/31/2020 |
12.70 |
0.20 |
0.47 |
0.67 |
(0.20) |
(0.41) |
|
Year Ended
10/31/2019 |
11.98 |
0.24 |
0.93 |
1.17 |
(0.26) |
(0.19) |
(a)The amount
shown may not correlate with the change in aggregate gains and losses of
portfolio securities due to the timing of sales and redemptions of fund
shares.
*All per share
amounts have been rounded to the nearest cent.
142
Thrivent
Mutual Funds
Financial
Highlights – continued
|
|
RATIOS /
SUPPLEMENTAL DATA | |||||||
|
|
|
|
|
Ratio to
Average
Net
Assets** |
Ratios to
Average Net Assets
Before
Expenses Waived,
Credited
or Acquired Fund
Fees and
Expenses** |
| ||
|
Total
Distributions |
Net
Asset
Value,
End
of
Period |
Total Return(b) |
Net
Assets,
End of
Period
(in
millions) |
Expenses |
Net
Investment
Income/(Loss) |
Expenses |
Net
Investment
Income/(Loss) |
Portfolio
Turnover Rate(c) |
|
|
|
|
|
|
|
|
|
|
|
|
|
|
|
|
|
|
|
|
|
$(0.29) |
$13.56 |
4.42% |
$1,416.0 |
0.56% |
2.10% |
0.75% |
1.91% |
41% |
|
(1.07) |
13.26 |
(16.35)% |
1,328.1 |
0.56% |
1.32% |
0.74% |
1.14% |
96% |
|
(0.62) |
16.94 |
23.07% |
1,456.3 |
0.54% |
1.08% |
0.74% |
0.89% |
120% |
|
(0.74) |
14.33 |
6.40% |
973.0 |
0.58% |
1.48% |
0.76% |
1.30% |
117% |
|
(0.58) |
14.19 |
10.57% |
712.2 |
0.57% |
1.78% |
0.77% |
1.59% |
145% |
|
|
|
|
|
|
|
|
|
|
|
(0.26) |
13.52 |
4.19% |
1,737.4 |
0.79% |
1.88% |
0.98% |
1.69% |
41% |
|
(1.03) |
13.22 |
(16.54)% |
1,791.8 |
0.79% |
1.10% |
0.98% |
0.91% |
96% |
|
(0.59) |
16.89 |
22.78% |
2,246.9 |
0.78% |
0.88% |
0.97% |
0.68% |
120% |
|
(0.70) |
14.29 |
6.16% |
1,888.6 |
0.81% |
1.32% |
0.99% |
1.14% |
117% |
|
(0.55) |
14.15 |
10.34% |
1,884.8 |
0.80% |
1.59% |
1.00% |
1.39% |
145% |
|
|
|
|
|
|
|
|
|
|
|
|
|
|
|
|
|
|
|
|
|
(0.46) |
14.82 |
4.68% |
1,448.5 |
0.60% |
1.63% |
0.83% |
1.39% |
34% |
|
(1.27) |
14.61 |
(17.47)% |
1,296.1 |
0.60% |
1.03% |
0.83% |
0.80% |
62% |
|
(0.71) |
18.97 |
29.32% |
1,399.0 |
0.59% |
0.72% |
0.83% |
0.48% |
76% |
|
(0.96) |
15.31 |
6.00% |
924.3 |
0.63% |
1.18% |
0.85% |
0.96% |
81% |
|
(0.82) |
15.38 |
10.62% |
782.5 |
0.62% |
1.36% |
0.86% |
1.12% |
98% |
|
|
|
|
|
|
|
|
|
|
|
(0.43) |
14.65 |
4.43% |
2,150.4 |
0.80% |
1.45% |
1.03% |
1.22% |
34% |
|
(1.23) |
14.45 |
(17.66)% |
2,168.1 |
0.80% |
0.86% |
1.03% |
0.62% |
62% |
|
(0.68) |
18.78 |
29.10% |
2,740.2 |
0.79% |
0.56% |
1.03% |
0.32% |
76% |
|
(0.93) |
15.16 |
5.77% |
2,234.1 |
0.83% |
1.03% |
1.05% |
0.81% |
81% |
|
(0.78) |
15.24 |
10.36% |
2,251.4 |
0.83% |
1.21% |
1.06% |
0.98% |
98% |
|
|
|
|
|
|
|
|
|
|
|
|
|
|
|
|
|
|
|
|
|
(0.31) |
11.29 |
2.88% |
459.6 |
0.58% |
2.67% |
0.73% |
2.53% |
49% |
|
(0.56) |
11.27 |
(15.80)% |
471.9 |
0.58% |
1.76% |
0.72% |
1.62% |
140% |
|
(0.51) |
13.97 |
13.40% |
525.5 |
0.58% |
1.37% |
0.72% |
1.22% |
159% |
|
(0.64) |
12.80 |
5.69% |
350.0 |
0.59% |
1.81% |
0.73% |
1.66% |
146% |
|
(0.48) |
12.74 |
10.33% |
267.1 |
0.58% |
2.18% |
0.73% |
2.03% |
182% |
|
|
|
|
|
|
|
|
|
|
|
(0.28) |
11.25 |
2.63% |
572.4 |
0.82% |
2.43% |
0.97% |
2.29% |
49% |
|
(0.53) |
11.23 |
(16.00)% |
621.1 |
0.82% |
1.52% |
0.96% |
1.38% |
140% |
|
(0.48) |
13.92 |
13.09% |
797.2 |
0.81% |
1.16% |
0.96% |
1.01% |
159% |
|
(0.61) |
12.76 |
5.45% |
725.8 |
0.83% |
1.60% |
0.97% |
1.46% |
146% |
|
(0.45) |
12.70 |
10.09% |
701.9 |
0.82% |
1.98% |
0.98% |
1.83% |
182% |
(b)Total return
assumes dividend reinvestment and does not reflect any deduction for applicable
sales charges. Not annualized for periods less than one
year.
(c)Portfolio
turnover rate may include mortgage dollar roll purchase and sale transactions
which may increase portfolio turnover rates. Additional information
can be found in the accompanying Notes to Financial Statements.
**Computed on an
annualized basis for periods less than one year.
143
Thrivent
Mutual Funds
Financial
Highlights – continued
|
|
PER SHARE
OUTSTANDING THROUGHOUT EACH PERIOD* | |||||
|
|
|
Income
From Investment Operations |
Less
Distributions From | |||
|
|
Net
Asset
Value,
Beginning
of
Period |
Net
Investment
Income/(Loss) |
Net
Realized
and
Unrealized
Gain/(Loss)
on Investments(a) |
Total
from
Investment
Operations |
Net
Investment
Income |
Net
Realized
Gain
on
Investments |
|
Money
Market Fund |
|
|
|
|
|
|
|
Class
S Shares |
|
|
|
|
|
|
|
Year Ended
10/31/2023 |
$1.00 |
$0.04 |
$— |
$0.04 |
$(0.04) |
$— |
|
Year Ended
10/31/2022 |
1.00 |
0.01 |
— |
0.01 |
(0.01) |
— |
|
Year Ended
10/31/2021 |
1.00 |
— |
— |
— |
— |
— |
|
Year Ended
10/31/2020 |
1.00 |
0.01 |
— |
0.01 |
(0.01) |
— |
|
Year Ended
10/31/2019 |
1.00 |
0.02 |
— |
0.02 |
(0.02) |
— |
|
Class
A Shares |
|
|
|
|
|
|
|
Year Ended
10/31/2023 |
1.00 |
0.04 |
— |
0.04 |
(0.04) |
— |
|
Year Ended
10/31/2022 |
1.00 |
0.01 |
— |
0.01 |
(0.01) |
— |
|
Year Ended
10/31/2021 |
1.00 |
— |
— |
— |
— |
— |
|
Year Ended
10/31/2020 |
1.00 |
0.01 |
— |
0.01 |
(0.01) |
— |
|
Year Ended
10/31/2019 |
1.00 |
0.02 |
— |
0.02 |
(0.02) |
— |
|
Multidimensional
Income Fund |
|
|
|
|
|
|
|
Class
S Shares |
|
|
|
|
|
|
|
Year Ended
12/31/2023 |
8.46 |
0.40 |
0.30 |
0.70 |
(0.41) |
— |
|
Year Ended
12/31/2022 |
10.24 |
0.37 |
(1.74) |
(1.37) |
(0.39) |
— |
|
Year Ended
12/31/2021 |
10.17 |
0.36 |
0.21 |
0.57 |
(0.36) |
(0.13) |
|
Year Ended
12/31/2020 |
10.06 |
0.43 |
0.11 |
0.54 |
(0.41) |
— |
|
Year Ended
12/31/2019 |
9.13 |
0.38 |
0.99 |
1.37 |
(0.40) |
— |
|
Municipal
Bond Fund |
|
|
|
|
|
|
|
Class
S Shares |
|
|
|
|
|
|
|
Year Ended
10/31/2023 |
9.58 |
0.33 |
(0.19) |
0.14 |
(0.34) |
— |
|
Year Ended
10/31/2022 |
11.51 |
0.30 |
(1.91) |
(1.61) |
(0.32) |
— |
|
Year Ended
10/31/2021 |
11.42 |
0.34 |
0.08 |
0.42 |
(0.33) |
— |
|
Year Ended
10/31/2020 |
11.47 |
0.34 |
(0.04) |
0.30 |
(0.35) |
— |
|
Year Ended
10/31/2019 |
10.89 |
0.37 |
0.59 |
0.96 |
(0.38) |
— |
|
Class
A Shares |
|
|
|
|
|
|
|
Year Ended
10/31/2023 |
9.58 |
0.30 |
(0.18) |
0.12 |
(0.32) |
— |
|
Year Ended
10/31/2022 |
11.51 |
0.27 |
(1.90) |
(1.63) |
(0.30) |
— |
|
Year Ended
10/31/2021 |
11.42 |
0.29 |
0.11 |
0.40 |
(0.31) |
— |
|
Year Ended
10/31/2020 |
11.47 |
0.30 |
(0.02) |
0.28 |
(0.33) |
— |
|
Year Ended
10/31/2019 |
10.89 |
0.33 |
0.61 |
0.94 |
(0.36) |
— |
(a)The amount
shown may not correlate with the change in aggregate gains and losses of
portfolio securities due to the timing of sales and redemptions of fund
shares.
*All per share
amounts have been rounded to the nearest cent.
144
Thrivent
Mutual Funds
Financial
Highlights – continued
|
|
RATIOS /
SUPPLEMENTAL DATA | ||||||||
|
|
|
|
|
|
Ratio to
Average
Net
Assets** |
Ratios to
Average Net Assets
Before
Expenses Waived,
Credited
or Acquired Fund
Fees and
Expenses** |
| ||
|
Return
of
Capital |
Total
Distributions |
Net
Asset
Value,
End
of
Period |
Total Return(b) |
Net
Assets,
End of
Period
(in
millions) |
Expenses |
Net
Investment
Income/(Loss) |
Expenses |
Net
Investment
Income/(Loss) |
Portfolio
Turnover Rate(c) |
|
|
|
|
|
|
|
|
|
|
|
|
|
|
|
|
|
|
|
|
|
|
|
$— |
$(0.04) |
$1.00 |
4.56% |
$1,405.1 |
0.37% |
4.63% |
0.37% |
4.63% |
$N/A |
|
— |
(0.01) |
1.00 |
0.67% |
536.4 |
0.40% |
0.85% |
0.41% |
0.84% |
N/A |
|
— |
— |
1.00 |
0.00% |
276.0 |
0.11% |
0.00% |
0.50% |
(0.40)% |
N/A |
|
— |
(0.01) |
1.00 |
0.56% |
355.5 |
0.33% |
0.52% |
0.49% |
0.35% |
N/A |
|
— |
(0.02) |
1.00 |
1.97% |
298.1 |
0.40% |
1.94% |
0.50% |
1.84% |
N/A |
|
|
|
|
|
|
|
|
|
|
|
|
— |
(0.04) |
1.00 |
4.55% |
616.6 |
0.39% |
4.52% |
0.44% |
4.47% |
N/A |
|
— |
(0.01) |
1.00 |
0.61% |
409.5 |
0.44% |
0.65% |
0.50% |
0.58% |
N/A |
|
— |
— |
1.00 |
0.00% |
349.4 |
0.11% |
(0.01)% |
0.59% |
(0.49)% |
N/A |
|
— |
(0.01) |
1.00 |
0.52% |
399.4 |
0.37% |
0.49% |
0.61% |
0.25% |
N/A |
|
— |
(0.02) |
1.00 |
1.87% |
359.4 |
0.50% |
1.85% |
0.64% |
1.71% |
N/A |
|
|
|
|
|
|
|
|
|
|
|
|
|
|
|
|
|
|
|
|
|
|
|
— |
(0.41) |
8.75 |
8.51% |
52.8 |
0.74% |
4.73% |
1.08% |
4.39% |
94% |
|
(0.02) |
(0.41) |
8.46 |
(13.49)% |
59.8 |
0.73% |
4.16% |
1.01% |
3.89% |
59% |
|
(0.01) |
(0.50) |
10.24 |
5.72% |
70.2 |
0.85% |
3.38% |
1.09% |
3.14% |
44% |
|
(0.02) |
(0.43) |
10.17 |
5.74% |
37.5 |
0.85% |
4.14% |
1.36% |
3.63% |
61% |
|
(0.04) |
(0.44) |
10.06 |
15.18% |
20.6 |
1.00% |
3.89% |
1.60% |
3.29% |
113% |
|
|
|
|
|
|
|
|
|
|
|
|
|
|
|
|
|
|
|
|
|
|
|
— |
(0.34) |
9.38 |
1.32% |
341.8 |
0.52% |
3.29% |
0.56% |
3.26% |
37% |
|
— |
(0.32) |
9.58 |
(14.22)% |
357.1 |
0.54% |
2.81% |
0.54% |
2.81% |
42% |
|
— |
(0.33) |
11.51 |
3.73% |
440.0 |
0.54% |
2.72% |
0.54% |
2.72% |
16% |
|
— |
(0.35) |
11.42 |
2.68% |
335.4 |
0.54% |
2.86% |
0.54% |
2.86% |
29% |
|
— |
(0.38) |
11.47 |
8.98% |
285.4 |
0.54% |
3.14% |
0.54% |
3.14% |
31% |
|
|
|
|
|
|
|
|
|
|
|
|
— |
(0.32) |
9.38 |
1.08% |
829.3 |
0.76% |
3.06% |
0.76% |
3.06% |
37% |
|
— |
(0.30) |
9.58 |
(14.40)% |
923.5 |
0.74% |
2.61% |
0.74% |
2.61% |
42% |
|
— |
(0.31) |
11.51 |
3.52% |
1,186.3 |
0.74% |
2.49% |
0.74% |
2.49% |
16% |
|
— |
(0.33) |
11.42 |
2.48% |
1,215.5 |
0.74% |
2.68% |
0.74% |
2.68% |
29% |
|
— |
(0.36) |
11.47 |
8.76% |
1,253.7 |
0.75% |
2.99% |
0.75% |
2.99% |
31% |
(b)Total return
assumes dividend reinvestment and does not reflect any deduction for applicable
sales charges. Not annualized for periods less than one
year.
(c)Portfolio
turnover rate may include mortgage dollar roll purchase and sale transactions
which may increase portfolio turnover rates. Additional information
can be found in the accompanying Notes to Financial Statements.
**Computed on an
annualized basis for periods less than one year.
145
Thrivent
Mutual Funds
Financial
Highlights – continued
|
|
PER SHARE
OUTSTANDING THROUGHOUT EACH PERIOD* | |||||
|
|
|
Income
From Investment Operations |
Less
Distributions From | |||
|
|
Net
Asset
Value,
Beginning
of
Period |
Net
Investment
Income/(Loss) |
Net
Realized
and
Unrealized
Gain/(Loss)
on Investments(a) |
Total
from
Investment
Operations |
Net
Investment
Income |
Net
Realized
Gain
on
Investments |
|
Opportunity
Income Plus Fund |
|
|
|
|
|
|
|
Class
S Shares |
|
|
|
|
|
|
|
Year Ended
10/31/2023 |
$8.57 |
$0.43 |
$(0.11) |
$0.32 |
$(0.43) |
$— |
|
Year Ended
10/31/2022 |
10.13 |
0.34 |
(1.54) |
(1.20) |
(0.36) |
— |
|
Year Ended
10/31/2021 |
9.97 |
0.30 |
0.16 |
0.46 |
(0.30) |
— |
|
Year Ended
10/31/2020 |
10.11 |
0.34 |
(0.14) |
0.20 |
(0.34) |
— |
|
Year Ended
10/31/2019 |
9.96 |
0.42 |
0.15 |
0.57 |
(0.42) |
— |
|
Class
A Shares |
|
|
|
|
|
|
|
Year Ended
10/31/2023 |
8.57 |
0.40 |
(0.10) |
0.30 |
(0.41) |
— |
|
Year Ended
10/31/2022 |
10.13 |
0.32 |
(1.55) |
(1.23) |
(0.33) |
— |
|
Year Ended
10/31/2021 |
9.97 |
0.27 |
0.16 |
0.43 |
(0.27) |
— |
|
Year Ended
10/31/2020 |
10.11 |
0.32 |
(0.14) |
0.18 |
(0.32) |
— |
|
Year Ended
10/31/2019 |
9.96 |
0.39 |
0.15 |
0.54 |
(0.39) |
— |
|
Small
Cap Growth Fund |
|
|
|
|
|
|
|
Class
S Shares |
|
|
|
|
|
|
|
Year Ended
10/31/2023 |
15.36 |
(0.00) |
(1.70) |
(1.70) |
— |
— |
|
Year Ended
10/31/2022 |
20.48 |
(0.09) |
(4.57) |
(4.66) |
— |
(0.46) |
|
Year Ended
10/31/2021 |
14.80 |
(0.07) |
6.14 |
6.07 |
— |
(0.39) |
|
Year Ended
10/31/2020 |
10.87 |
(0.04) |
4.03 |
3.99 |
— |
(0.06) |
|
Year Ended
10/31/2019 |
10.57 |
(0.05) |
0.55 |
0.50 |
— |
(0.20) |
|
Small
Cap Stock Fund |
|
|
|
|
|
|
|
Class
S Shares |
|
|
|
|
|
|
|
Year Ended
10/31/2023 |
29.22 |
0.15 |
(2.14) |
(1.99) |
(0.11) |
(2.42) |
|
Year Ended
10/31/2022 |
35.75 |
0.09 |
(2.96) |
(2.87) |
(0.18) |
(3.48) |
|
Year Ended
10/31/2021(d) |
23.03 |
0.08 |
13.11 |
13.19 |
(0.18) |
(0.29) |
|
Year Ended
10/31/2020(d) |
24.44 |
0.13 |
0.55 |
0.68 |
(0.11) |
(1.98) |
|
Year Ended
10/31/2019(d) |
26.35 |
0.10 |
1.05 |
1.15 |
— |
(3.06) |
|
Class
A Shares |
|
|
|
|
|
|
|
Year Ended
10/31/2023 |
22.04 |
0.11 |
(1.62) |
(1.51) |
(0.07) |
(2.42) |
|
Year Ended
10/31/2022 |
27.87 |
0.08 |
(2.31) |
(2.23) |
(0.12) |
(3.48) |
|
Year Ended
10/31/2021 |
18.04 |
(0.01) |
10.26 |
10.25 |
(0.13) |
(0.29) |
|
Year Ended
10/31/2020 |
19.58 |
0.05 |
0.45 |
0.50 |
(0.06) |
(1.98) |
|
Year Ended
10/31/2019 |
21.82 |
0.04 |
0.78 |
0.82 |
— |
(3.06) |
(a)The amount
shown may not correlate with the change in aggregate gains and losses of
portfolio securities due to the timing of sales and redemptions of fund
shares.
(d)Per share
amounts have been calculated using the average shares outstanding
method.
*All per share
amounts have been rounded to the nearest cent.
146
Thrivent
Mutual Funds
Financial
Highlights – continued
|
|
RATIOS /
SUPPLEMENTAL DATA | |||||||
|
|
|
|
|
Ratio to
Average
Net
Assets** |
Ratios to
Average Net Assets
Before
Expenses Waived,
Credited
or Acquired Fund
Fees and
Expenses** |
| ||
|
Total
Distributions |
Net
Asset
Value,
End
of
Period |
Total Return(b) |
Net
Assets,
End of
Period
(in
millions) |
Expenses |
Net
Investment
Income/(Loss) |
Expenses |
Net
Investment
Income/(Loss) |
Portfolio
Turnover Rate(c) |
|
|
|
|
|
|
|
|
|
|
|
|
|
|
|
|
|
|
|
|
|
$(0.43) |
$8.46 |
3.68% |
$481.4 |
0.64% |
4.88% |
0.64% |
4.88% |
81% |
|
(0.36) |
8.57 |
(12.07)% |
450.7 |
0.62% |
3.63% |
0.62% |
3.63% |
175% |
|
(0.30) |
10.13 |
4.65% |
615.3 |
0.60% |
2.96% |
0.60% |
2.96% |
228% |
|
(0.34) |
9.97 |
2.10% |
534.7 |
0.61% |
3.46% |
0.61% |
3.46% |
186% |
|
(0.42) |
10.11 |
5.85% |
408.8 |
0.62% |
4.16% |
0.62% |
4.16% |
186% |
|
|
|
|
|
|
|
|
|
|
|
(0.41) |
8.46 |
3.42% |
165.3 |
0.90% |
4.62% |
0.90% |
4.62% |
81% |
|
(0.33) |
8.57 |
(12.29)% |
182.5 |
0.88% |
3.38% |
0.88% |
3.38% |
175% |
|
(0.27) |
10.13 |
4.38% |
233.3 |
0.86% |
2.69% |
0.86% |
2.69% |
228% |
|
(0.32) |
9.97 |
1.83% |
238.6 |
0.88% |
3.19% |
0.88% |
3.19% |
186% |
|
(0.39) |
10.11 |
5.57% |
246.7 |
0.89% |
3.90% |
0.89% |
3.90% |
186% |
|
|
|
|
|
|
|
|
|
|
|
|
|
|
|
|
|
|
|
|
|
— |
13.66 |
(11.07)% |
190.4 |
0.95% |
(0.19)% |
1.14% |
(0.38)% |
64% |
|
(0.46) |
15.36 |
(23.18)% |
147.0 |
0.95% |
(0.57)% |
1.16% |
(0.78)% |
53% |
|
(0.39) |
20.48 |
41.54% |
181.4 |
0.95% |
(0.55)% |
1.21% |
(0.81)% |
42% |
|
(0.06) |
14.80 |
36.84% |
18.6 |
1.03% |
(0.58)% |
2.47% |
(2.02)% |
49% |
|
(0.20) |
10.87 |
5.03% |
8.4 |
1.22% |
(0.60)% |
3.76% |
(3.14)% |
48% |
|
|
|
|
|
|
|
|
|
|
|
|
|
|
|
|
|
|
|
|
|
(2.53) |
24.70 |
(7.29)% |
1,812.2 |
0.81% |
0.60% |
0.81% |
0.60% |
48% |
|
(3.66) |
29.22 |
(8.92)% |
1,270.5 |
0.82% |
0.45% |
0.82% |
0.45% |
42% |
|
(0.47) |
35.75 |
57.77% |
877.9 |
0.80% |
0.23% |
0.80% |
0.23% |
46% |
|
(2.09) |
23.03 |
2.57% |
271.5 |
0.83% |
0.58% |
0.83% |
0.58% |
67% |
|
(3.06) |
24.44 |
5.87% |
259.8 |
0.83% |
0.43% |
0.83% |
0.43% |
57% |
|
|
|
|
|
|
|
|
|
|
|
(2.49) |
18.04 |
(7.53)% |
464.9 |
1.04% |
0.39% |
1.04% |
0.39% |
48% |
|
(3.60) |
22.04 |
(9.15)% |
519.4 |
1.05% |
0.20% |
1.05% |
0.20% |
42% |
|
(0.42) |
27.87 |
57.37% |
591.9 |
1.07% |
(0.01)% |
1.07% |
(0.01)% |
46% |
|
(2.04) |
18.04 |
2.27% |
393.4 |
1.14% |
0.27% |
1.14% |
0.27% |
67% |
|
(3.06) |
19.58 |
5.53% |
415.5 |
1.14% |
0.13% |
1.14% |
0.13% |
57% |
(b)Total return
assumes dividend reinvestment and does not reflect any deduction for applicable
sales charges. Not annualized for periods less than one
year.
(c)Portfolio
turnover rate may include mortgage dollar roll purchase and sale transactions
which may increase portfolio turnover rates. Additional information
can be found in the accompanying Notes to Financial Statements.
**Computed on an
annualized basis for periods less than one year.
147


Go
paperless. Manage
your communication choices and sign up for paperless delivery of prospectuses by
logging into your account.
A better way to
deliver documents.
In response to
concerns regarding multiple mailings, we send one copy of a prospectus and each
annual and semiannual report for Thrivent Mutual Funds to each household. This
consolidated mailing process is known as householding. It helps save money by
reducing printing and postage costs.
• If
you purchased shares through Thrivent:
If you wish to discontinue
householding in the future, you may write to us at 4321 North Ballard Road,
Appleton, WI, 54919-0001, or call us at 800-847-4836. We will begin to send
separate regulatory mailings within 30 days of when we receive your request. If
you wish to receive an additional copy of this prospectus for Thrivent Mutual
Funds, call us at 800-847-4836 or visit thriventmutualfunds.com/prospectus.
• If
you purchased shares from a firm other than Thrivent:
If you wish to discontinue
householding in the future or to receive an additional copy of this prospectus
for Thrivent Mutual Funds, contact your financial professional. This prospectus
is also available by visiting thriventmutualfunds.com/prospectus.
Contact
Thrivent Mutual Funds
|
Phone:800-847-4836 |
Fax:866-278-8363 |
Web: thriventfunds.com |
|
|
Applications,
Redemptions,
Exchanges
& Other Requests:
Thrivent
Mutual Funds
P.O.
Box 219348
Kansas
City, Missouri 64121-9348 |
Additional
Investments:
Thrivent
Mutual Funds
P.O.
Box 219334
Kansas
City, Missouri 64121-9334 |
Express
Mail:
Thrivent
Mutual Funds
430
West 7th Street
Kansas
City, Missouri 64105 |
The SAI, which is incorporated by
reference into this prospectus, contains additional information about the Funds.
Additional information about the Funds’ investments is available in the Funds’
annual and semiannual reports to shareholders. In the Funds’ annual report, you
will find a discussion of the market conditions and investment strategies that
significantly affected the performance of each of the Funds during its last
fiscal year. For a free copy of the SAI or an annual or semiannual report for
the Funds, or to request other information or ask questions about the Funds,
call toll-free 800-847-4836 or visit
thriventmutualfunds.com/prospectus. You may also get information about the Funds
on the EDGAR database on the SEC’s internet site at SEC.gov. Copies of the
information may also be obtained, after paying a duplicating fee, by sending an
email to [email protected].
1940 Act File No.
811-5075
The
distributor for Thrivent Mutual Funds is Thrivent Distributors, LLC, a
registered broker/dealer, member FINRA
and subsidiary of Thrivent, the marketing name for Thrivent Financial for
Lutherans.
32001PR
R2-24