Book 1
First Trust NASDAQ Technology Dividend Index Fund (TDIV)
Multi-Asset Diversified Income Index Fund (MDIV)
First Trust S&P International Dividend Aristocrats ETF (FID)
First Trust BuyWrite Income ETF (FTHI)
First Trust Hedged BuyWrite Income ETF (FTLB)
First Trust Rising Dividend Achievers ETF (RDVY)
First Trust Dorsey Wright Focus 5 ETF (FV)
First Trust RBA American Industrial Renaissance® ETF (AIRR)
First Trust Dorsey Wright Momentum & Dividend ETF (DDIV)
First Trust Dorsey Wright International Focus 5 ETF (IFV)
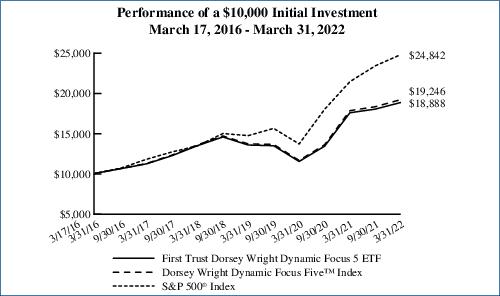
First Trust Dorsey Wright Dynamic Focus 5 ETF (FVC)
First Trust Indxx Innovative Transaction & Process ETF (LEGR)
First Trust Nasdaq Artificial Intelligence and Robotics ETF (ROBT)
First Trust International Developed Capital Strength ETF (FICS)
|
2 |
|
3 |
Fund Performance Overview | |
|
4 |
|
6 |
|
8 |
|
11 |
|
13 |
|
15 |
|
17 |
|
19 |
|
21 |
|
23 |
|
25 |
|
27 |
|
29 |
|
31 |
|
33 |
|
34 |
Portfolio of Investments | |
|
36 |
|
38 |
|
43 |
|
46 |
|
54 |
|
62 |
|
64 |
|
65 |
|
67 |
|
69 |
|
70 |
|
71 |
|
75 |
|
79 |
|
82 |
|
86 |
|
90 |
|
96 |
|
110 |
|
125 |
Performance | |||||||
Average Annual Total Returns | Cumulative Total Returns | ||||||
6
Months Ended 3/31/22 |
1
Year Ended 3/31/22 |
5
Years Ended 3/31/22 |
Inception (8/13/12) to 3/31/22 |
5
Years Ended 3/31/22 |
Inception (8/13/12) to 3/31/22 | ||
Fund Performance | |||||||
NAV | 5.43% | 11.32% | 15.88% | 14.71% | 108.93% | 274.94% | |
Market Price | 5.56% | 11.39% | 15.90% | 14.72% | 109.14% | 275.29% | |
Index Performance | |||||||
Nasdaq Technology Dividend IndexTM | 5.75% | 11.98% | 16.64% | 15.46% | 115.85% | 299.09% | |
S&P 500® Index | 5.92% | 15.65% | 15.99% | 15.18% | 109.94% | 289.98% | |
S&P 500® Information Technology Index | 6.94% | 20.90% | 26.81% | 21.71% | 227.86% | 563.32% |
Performance | |||||||
Average Annual Total Returns | Cumulative Total Returns | ||||||
6
Months Ended 3/31/22 |
1
Year Ended 3/31/22 |
5
Years Ended 3/31/22 |
Inception (8/13/12) to 3/31/22 |
5
Years Ended 3/31/22 |
Inception (8/13/12) to 3/31/22 | ||
Fund Performance | |||||||
NAV | 5.84% | 9.70% | 3.06% | 4.25% | 16.24% | 49.27% | |
Market Price | 5.83% | 9.70% | 3.04% | 4.25% | 16.13% | 49.27% | |
Index Performance | |||||||
Nasdaq US Multi-Asset Diversified Income IndexSM | 6.16% | 10.32% | 3.62% | 4.90% | 19.48% | 58.56% | |
S&P 500® Index | 5.92% | 15.65% | 15.99% | 15.18% | 109.94% | 289.98% | |
Dow Jones U.S. Select DividendTM Index* | 13.43% | 16.30% | 11.31% | 12.94% | 70.88% | 222.71% |
* | The Dow Jones U.S. Select DividendTM Index represents 100 of the United States’ leading stocks by dividend yield. |
Performance | |||||||
Average Annual Total Returns | Cumulative Total Returns | ||||||
6
Months Ended 3/31/22 |
1
Year Ended 3/31/22 |
5
Years Ended 3/31/22 |
Inception (8/22/13) to 3/31/22 |
5
Years Ended 3/31/22 |
Inception (8/22/13) to 3/31/22 | ||
Fund Performance | |||||||
NAV | 2.04% | 4.62% | 4.65% | 3.20% | 25.51% | 31.19% | |
Market Price | 2.50% | 4.08% | 4.83% | 3.23% | 26.58% | 31.47% | |
Index Performance | |||||||
S&P International Dividend Aristocrats Index(1) | 3.19% | 6.38% | N/A | N/A | N/A | N/A | |
Dow Jones EPAC Select DividendTM Index(2) | 6.86% | 6.97% | 6.13% | 4.56% | 34.63% | 46.75% | |
MSCI World ex USA Index | -1.82% | 3.04% | 7.14% | 5.55% | 41.15% | 59.16% |
(1) | On August 30, 2018, the Fund’s underlying index changed from the NASDAQ International Multi-Asset Diversified Income IndexSM to the S&P International Dividend Aristocrats Index (the “Index”). Therefore, the Fund’s performance and historical returns shown for the periods prior to August 30, 2018, are not necessarily indicative of the performance that the Fund, based on its current index, would have generated. Since the Index had an inception date of April 30, 2018, it was not in existence for all of the periods disclosed. The old index was terminated on November 23, 2018, so performance data does not exist for these time periods. |
(2) | The Dow Jones EPAC Select DividendTM Index measures the performance of a selected group of companies, from non-U.S. developed markets (Europe, Pacific Asia, and Canada), that have provided relatively high dividend yields on a consistent basis over time. |
Performance | |||||||
Average Annual Total Returns | Cumulative Total Returns | ||||||
6
Months Ended 3/31/22 |
1
Year Ended 3/31/22 |
5
Years Ended 3/31/22 |
Inception (1/6/14) to 3/31/22 |
5
Years Ended 3/31/22 |
Inception (1/6/14) to 3/31/22 | ||
Fund Performance | |||||||
NAV | 9.84% | 14.11% | 6.24% | 6.43% | 35.33% | 67.04% | |
Market Price | 9.87% | 14.14% | 6.25% | 6.44% | 35.43% | 67.18% | |
Index Performance | |||||||
CBOE S&P 500 BuyWrite Monthly Index(1) | 7.86% | 14.88% | 7.17% | 7.05% | 41.38% | 75.13% | |
S&P 500® Index | 5.92% | 15.65% | 15.99% | 13.84% | 109.94% | 190.69% |
(1) | The CBOE S&P 500 BuyWrite Monthly Index is a benchmark index designed to track the performance of a hypothetical buy-write strategy on the S&P 500® Index. |
Performance | |||||||
Average Annual Total Returns | Cumulative Total Returns | ||||||
6
Months Ended 3/31/22 |
1
Year Ended 3/31/22 |
5
Years Ended 3/31/22 |
Inception (1/6/14) to 3/31/22 |
5
Years Ended 3/31/22 |
Inception (1/6/14) to 3/31/22 | ||
Fund Performance | |||||||
NAV | 8.67% | 12.22% | 4.63% | 4.84% | 25.42% | 47.52% | |
Market Price | 8.71% | 12.32% | 4.65% | 4.85% | 25.53% | 47.68% | |
Index Performance | |||||||
CBOE S&P 500 95-110 Collar IndexSM(1) | -0.18% | 6.04% | 13.44% | 9.83% | 87.83% | 116.34% | |
S&P 500® Index | 5.92% | 15.65% | 15.99% | 13.84% | 109.94% | 190.69% | |
CBOE Nasdaq-100 Buywrite IndexSM(2) | 2.12% | 5.87% | 8.79% | 8.09% | 52.35% | 89.76% | |
Nasdaq-100® Index(3) | 1.37% | 14.14% | 23.41% | 20.35% | 186.21% | 359.22% |
(1) | The CBOE S&P 500 95-110 Collar IndexSM is designed to protect an investment in S&P 500® stocks against market declines. The passive collar strategy reflected by the index entails: holding the stocks in the S&P 500® Index; buying three-month S&P 500® put options to protect this S&P 500® portfolio from market decreases; and selling one-month S&P 500® call options to help finance the cost of the put options. |
(2) | The Cboe Nasdaq-100 BuyWrite IndexSM is a benchmark index designed to track the performance of a hypothetical buy-write strategy on the Nasdaq-100® Index. The index is a passive total return index based on (1) buying the Nasdaq-100® Index stock index portfolio, and (2) “writing” (or selling) the near-term Nasdaq-100® Index “covered” call option. |
(3) | On May 11, 2022, the Fund’s primary benchmark changed from the S&P 500® Index to the Nasdaq-100® Index, because the Advisor believes that the Nasdaq-100® Index better reflects the investment strategies of the Fund. |
Performance | |||||||
Average Annual Total Returns | Cumulative Total Returns | ||||||
6
Months Ended 3/31/22 |
1
Year Ended 3/31/22 |
5
Years Ended 3/31/22 |
Inception (1/6/14) to 3/31/22 |
5
Years Ended 3/31/22 |
Inception (1/6/14) to 3/31/22 | ||
Fund Performance | |||||||
NAV | 3.78% | 8.97% | 14.82% | 13.49% | 99.57% | 183.37% | |
Market Price | 3.85% | 8.96% | 14.82% | 13.50% | 99.58% | 183.47% | |
Index Performance | |||||||
Nasdaq US Rising Dividend AchieversTM Index | 4.06% | 9.56% | 15.45% | 14.11% | 105.11% | 196.27% | |
Dow Jones U.S. Select DividendTM Index* | 13.43% | 16.30% | 11.31% | 11.76% | 70.88% | 149.77% |
* | The Dow Jones U.S. Select DividendTM Index represents 100 of the United States’ leading stocks by dividend yield. |
Performance | |||||||
Average Annual Total Returns | Cumulative Total Returns | ||||||
6
Months Ended 3/31/22 |
1
Year Ended 3/31/22 |
5
Years Ended 3/31/22 |
Inception (3/5/14) to 3/31/22 |
5
Years Ended 3/31/22 |
Inception (3/5/14) to 3/31/22 | ||
Fund Performance | |||||||
NAV | 4.52% | 7.25% | 15.10% | 11.78% | 102.01% | 145.71% | |
Market Price | 4.52% | 7.24% | 15.08% | 11.77% | 101.80% | 145.56% | |
Index Performance | |||||||
Dorsey Wright Focus FiveTM Index | 4.77% | 7.68% | 15.43% | 12.17% | 104.89% | 152.67% | |
S&P 500® Index | 5.92% | 15.65% | 15.99% | 13.72% | 109.94% | 182.37% |
Performance | |||||||
Average Annual Total Returns | Cumulative Total Returns | ||||||
6
Months Ended 3/31/22 |
1
Year Ended 3/31/22 |
5
Years Ended 3/31/22 |
Inception (3/10/14) to 3/31/22 |
5
Years Ended 3/31/22 |
Inception (3/10/14) to 3/31/22 | ||
Fund Performance | |||||||
NAV | 3.54% | 4.47% | 12.33% | 10.02% | 78.83% | 115.85% | |
Market Price | 3.42% | 4.34% | 12.37% | 10.02% | 79.16% | 115.81% | |
Index Performance | |||||||
Richard Bernstein Advisors American Industrial Renaissance® Index | 3.93% | 5.27% | 13.14% | 10.86% | 85.36% | 129.46% | |
S&P 500® Index | 5.92% | 15.65% | 15.99% | 13.72% | 109.94% | 181.78% | |
S&P 500® Industrials Index | 6.08% | 6.14% | 11.27% | 10.62% | 70.54% | 125.53% | |
Russell 2500® Index | -2.22% | 0.34% | 11.57% | 9.77% | 72.90% | 111.86% |
Performance | |||||||
Average Annual Total Returns | Cumulative Total Returns | ||||||
6
Months Ended 3/31/22 |
1
Year Ended 3/31/22 |
5
Years Ended 3/31/22 |
Inception (3/10/14) to 3/31/22 |
5
Years Ended 3/31/22 |
Inception (3/10/14) to 3/31/22 | ||
Fund Performance | |||||||
NAV | 9.26% | 17.89% | 10.61% | 9.52% | 65.56% | 108.03% | |
Market Price | 9.33% | 17.88% | 10.63% | 9.52% | 65.69% | 108.12% | |
Index Performance | |||||||
Dorsey Wright Momentum Plus Dividend YieldTM Index(1) | 9.69% | 18.71% | N/A | N/A | N/A | N/A | |
Dow Jones U.S. Select DividendTM Index(2) | 13.43% | 16.30% | 11.31% | 11.66% | 70.88% | 143.12% | |
S&P 500® Index | 5.92% | 15.65% | 15.99% | 13.72% | 109.94% | 181.78% |
(1) | On September 6, 2018, the Fund’s underlying index changed from the Richard Bernstein Advisors Quality Income Index to the Dorsey Wright Momentum Plus Dividend YieldTM Index (the “Index”). Therefore, the Fund’s performance and historical returns shown for the periods prior to September 6, 2018, are not necessarily indicative of the performance that the Fund, based on its current index, would have generated. Since the Index had an inception date of July 2, 2018, it was not in existence for all of the periods disclosed. |
(2) | The Dow Jones U.S. Select DividendTM Index represents 100 of the United States’ leading stocks by dividend yield. |
Performance | |||||||
Average Annual Total Returns | Cumulative Total Returns | ||||||
6
Months Ended 3/31/22 |
1
Year Ended 3/31/22 |
5
Years Ended 3/31/22 |
Inception (7/22/14) to 3/31/22 |
5
Years Ended 3/31/22 |
Inception (7/22/14) to 3/31/22 | ||
Fund Performance | |||||||
NAV | -6.76% | -7.15% | 3.75% | 2.19% | 20.22% | 18.13% | |
Market Price | -6.50% | -7.01% | 3.82% | 2.22% | 20.63% | 18.42% | |
Index Performance | |||||||
Dorsey Wright International Focus FiveTM Index | -6.62% | -6.86% | 4.26% | 2.63% | 23.21% | 22.06% | |
MSCI ACWI ex USA Index | -3.72% | -1.48% | 6.76% | 3.87% | 38.71% | 33.93% |
Performance | |||||||
Average Annual Total Returns | Cumulative Total Returns | ||||||
6
Months Ended 3/31/22 |
1
Year Ended 3/31/22 |
5
Years Ended 3/31/22 |
Inception (3/17/16) to 3/31/22 |
5
Years Ended 3/31/22 |
Inception (3/17/16) to 3/31/22 | ||
Fund Performance | |||||||
NAV | 4.52% | 7.24% | 10.89% | 11.11% | 67.68% | 88.88% | |
Market Price | 4.52% | 7.24% | 10.86% | 11.10% | 67.48% | 88.83% | |
Index Performance | |||||||
Dorsey Wright Dynamic Focus FiveTM Index | 4.77% | 7.68% | 11.22% | 11.45% | 70.18% | 92.46% | |
S&P 500® Index | 5.92% | 15.65% | 15.99% | 16.26% | 109.94% | 148.42% |
Performance | ||||
Average
Annual Total Returns |
Cumulative Total Returns | |||
6
Months Ended 3/31/22 |
1
Year Ended 3/31/22 |
Inception
(1/24/18) to 3/31/22 |
Inception
(1/24/18) to 3/31/22 | |
Fund Performance | ||||
NAV | -3.57% | 2.60% | 8.93% | 43.02% |
Market Price | -3.75% | 2.37% | 8.95% | 43.13% |
Index Performance | ||||
Indxx Blockchain Index | -3.10% | 3.85% | 10.04% | 49.16% |
S&P 500® Index | 5.92% | 15.65% | 13.86% | 72.07% |
Performance | ||||
Average
Annual Total Returns |
Cumulative Total Returns | |||
6
Months Ended 3/31/22 |
1
Year Ended 3/31/22 |
Inception
(2/21/18) to 3/31/22 |
Inception
(2/21/18) to 3/31/22 | |
Fund Performance | ||||
NAV | -11.43% | -8.96% | 12.06% | 59.57% |
Market Price | -11.46% | -9.23% | 12.07% | 59.63% |
Index Performance | ||||
Nasdaq CTA Artificial Intelligence and Robotics IndexSM | -10.95% | -8.03% | 12.97% | 64.96% |
S&P 500® Index | 5.92% | 15.65% | 15.46% | 80.41% |
Performance | ||||
Average
Annual Total Returns |
Cumulative Total Returns | |||
6
Months Ended 3/31/22 |
1
Year Ended 3/31/22 |
Inception
(12/15/20) to 3/31/22 |
Inception
(12/15/20) to 3/31/22 | |
Fund Performance | ||||
NAV | -2.95% | 6.19% | 8.34% | 10.88% |
Market Price | -2.82% | 6.14% | 8.61% | 11.25% |
Index Performance | ||||
The International Developed Capital Strength IndexSM | -2.28% | 7.72% | 10.20% | 13.35% |
MSCI World ex USA Index | -1.82% | 3.04% | 7.11% | 9.27% |
Beginning Account Value October 1, 2021 |
Ending Account Value March 31, 2022 |
Annualized Expense Ratio Based on the Six-Month Period |
Expenses Paid During the Six-Month Period (a) | |
First Trust NASDAQ Technology Dividend Index Fund (TDIV) | ||||
Actual | $1,000.00 | $1,054.30 | 0.50% | $2.56 |
Hypothetical (5% return before expenses) | $1,000.00 | $1,022.44 | 0.50% | $2.52 |
Multi-Asset Diversified Income Index Fund (MDIV) (b) | ||||
Actual | $1,000.00 | $1,058.40 | 0.48% | $2.46 |
Hypothetical (5% return before expenses) | $1,000.00 | $1,022.54 | 0.48% | $2.42 |
First Trust S&P International Dividend Aristocrats ETF (FID) | ||||
Actual | $1,000.00 | $1,020.40 | 0.60% | $3.02 |
Hypothetical (5% return before expenses) | $1,000.00 | $1,021.94 | 0.60% | $3.02 |
First Trust BuyWrite Income ETF (FTHI) | ||||
Actual | $1,000.00 | $1,098.40 | 0.85% | $4.45 |
Hypothetical (5% return before expenses) | $1,000.00 | $1,020.69 | 0.85% | $4.28 |
First Trust Hedged BuyWrite Income ETF (FTLB) | ||||
Actual | $1,000.00 | $1,086.70 | 0.85% | $4.42 |
Hypothetical (5% return before expenses) | $1,000.00 | $1,020.69 | 0.85% | $4.28 |
Beginning Account Value October 1, 2021 |
Ending Account Value March 31, 2022 |
Annualized Expense Ratio Based on the Six-Month Period |
Expenses Paid During the Six-Month Period (a) | |
First Trust Rising Dividend Achievers ETF (RDVY) | ||||
Actual | $1,000.00 | $1,037.80 | 0.50% | $2.54 |
Hypothetical (5% return before expenses) | $1,000.00 | $1,022.44 | 0.50% | $2.52 |
First Trust Dorsey Wright Focus 5 ETF (FV) (b) | ||||
Actual | $1,000.00 | $1,045.20 | 0.30% | $1.53 |
Hypothetical (5% return before expenses) | $1,000.00 | $1,023.44 | 0.30% | $1.51 |
First Trust RBA American Industrial Renaissance® ETF (AIRR) | ||||
Actual | $1,000.00 | $1,035.40 | 0.70% | $3.55 |
Hypothetical (5% return before expenses) | $1,000.00 | $1,021.44 | 0.70% | $3.53 |
First Trust Dorsey Wright Momentum & Dividend ETF (DDIV) | ||||
Actual | $1,000.00 | $1,092.60 | 0.60% | $3.13 |
Hypothetical (5% return before expenses) | $1,000.00 | $1,021.94 | 0.60% | $3.02 |
First Trust Dorsey Wright International Focus 5 ETF (IFV) (b) | ||||
Actual | $1,000.00 | $932.40 | 0.30% | $1.45 |
Hypothetical (5% return before expenses) | $1,000.00 | $1,023.44 | 0.30% | $1.51 |
First Trust Dorsey Wright Dynamic Focus 5 ETF (FVC) (b) | ||||
Actual | $1,000.00 | $1,045.20 | 0.30% | $1.53 |
Hypothetical (5% return before expenses) | $1,000.00 | $1,023.44 | 0.30% | $1.51 |
First Trust Indxx Innovative Transaction & Process ETF (LEGR) | ||||
Actual | $1,000.00 | $964.30 | 0.65% | $3.18 |
Hypothetical (5% return before expenses) | $1,000.00 | $1,021.69 | 0.65% | $3.28 |
First Trust Nasdaq Artificial Intelligence and Robotics ETF (ROBT) | ||||
Actual | $1,000.00 | $885.70 | 0.65% | $3.06 |
Hypothetical (5% return before expenses) | $1,000.00 | $1,021.69 | 0.65% | $3.28 |
First Trust International Developed Capital Strength ETF (FICS) | ||||
Actual | $1,000.00 | $970.50 | 0.70% | $3.44 |
Hypothetical (5% return before expenses) | $1,000.00 | $1,021.44 | 0.70% | $3.53 |
(a) | Expenses are equal to the annualized expense ratios as indicated in the table multiplied by the average account value over the period (October 1, 2021 through March 31, 2022), multiplied by 182/365 (to reflect the six-month period). |
(b) | Annualized expense ratio and expenses paid during the six-month period do not include fees and expenses of the underlying funds in which the Fund invests. |
Shares/ Units |
Description | Value | ||
COMMON STOCKS – 20.2% | ||||
Banks – 0.8% | ||||
59,450 |
CVB Financial Corp.
|
$1,379,834 | ||
172,719 |
Northwest Bancshares, Inc.
|
2,333,434 | ||
3,713,268 | ||||
Biotechnology – 0.7% | ||||
11,260 |
AbbVie, Inc.
|
1,825,358 | ||
29,364 |
Gilead Sciences, Inc.
|
1,745,690 | ||
3,571,048 | ||||
Chemicals – 0.5% | ||||
34,104 |
Dow, Inc.
|
2,173,107 | ||
Containers & Packaging – 0.4% | ||||
39,824 |
International Paper Co.
|
1,837,878 | ||
Diversified Consumer Services – 0.4% | ||||
81,678 |
H&R Block, Inc.
|
2,126,895 | ||
Diversified Telecommunication Services – 1.1% | ||||
147,685 |
AT&T, Inc.
|
3,489,797 | ||
38,061 |
Verizon Communications, Inc.
|
1,938,827 | ||
5,428,624 | ||||
Electric Utilities – 3.8% | ||||
27,117 |
ALLETE, Inc.
|
1,816,297 | ||
15,912 |
American Electric Power Co., Inc.
|
1,587,540 | ||