This
example
helps compare the cost of investing in the fund with the cost of investing in
other funds.
Let's say, hypothetically, that the annual return for shares
of the fund is 5% and that the fees and the annual operating expenses for shares
of the fund are exactly as described in the fee table. This example illustrates
the effect of fees and expenses, but is not meant to suggest actual or expected
fees and expenses or returns, all of which may vary. For every $10,000 you
invested, here's how much you would pay in total expenses if you sell all of
your shares at the end of each time period indicated:
|
1
year |
$ |
1 |
|
3
years |
$ |
3 |
|
5
years |
$ |
6 |
|
10
years |
$ |
13 |
Portfolio
Turnover
The
fund pays transaction costs, such as commissions, when it buys and sells
securities (or "turns over" its portfolio). A higher portfolio turnover rate may
indicate higher transaction costs and may result in higher taxes when fund
shares are held in a taxable account. These costs, which are not reflected in
annual operating expenses or in the example, affect the fund's performance.
During the most recent fiscal year, the fund's portfolio turnover rate
was 30%
of the average value of its portfolio.
Principal
Investment Strategies
- Normally
investing primarily in non-U.S. securities, including securities of issuers
located in emerging markets. Emerging markets include countries that have an
emerging stock market as defined by MSCI, countries or markets with low- to
middle-income economies as classified by the World Bank, and other countries
or markets that the Adviser identifies as having similar emerging markets
characteristics.
- Normally
investing primarily in common stocks.
- Investing
in securities of companies that Fidelity Management & Research Company LLC
(FMR) believes are undervalued in the marketplace in relation to factors such
as assets, sales, earnings, growth potential, or cash flow, or in relation to
securities of other companies in the same industry (stocks of these companies
are often called "value" stocks).
- Allocating
investments across different countries and regions.
- Using
fundamental analysis of factors such as each issuer's financial condition and
industry position, as well as market and economic conditions, to select
investments.
Principal
Investment Risks
Stock
markets are volatile and can decline significantly in response to adverse
issuer, political, regulatory, market, or economic developments. Different parts
of the market, including different market sectors, and different types of
securities can react differently to these developments.
Foreign
markets, particularly emerging markets, can be more volatile than the U.S.
market due to increased risks of adverse issuer, political, regulatory, market,
or economic developments and can perform differently from the U.S.
market.
The
extent of economic development; political stability; market depth,
infrastructure, and capitalization; and regulatory oversight can be less than in
more developed markets. Emerging markets typically have less established legal,
accounting and financial reporting systems than those in more developed markets,
which may reduce the scope or quality of financial information available to
investors.
Emerging
markets can be subject to greater social, economic, regulatory, and political
uncertainties and can be extremely volatile.
Foreign
exchange rates also can be extremely volatile.
- Geographic
Exposure to Europe.
Because
the fund invests a meaningful portion of its assets in Europe, the fund's
performance is expected to be closely tied to social, political, and economic
conditions within Europe and to be more volatile than the performance of more
geographically diversified funds.
- Geographic
Exposure to Japan.
Because
the fund invests a meaningful portion of its assets in Japan, the fund's
performance is expected to be closely tied to social, political, and economic
conditions within Japan and to be more volatile than the performance of more
geographically diversified funds.
The
value of an individual security or particular type of security can be more
volatile than, and can perform differently from, the market as a
whole.
"Value"
stocks can perform differently from the market as a whole and other types of
stocks and can continue to be undervalued by the market for long periods of
time.
An
investment in the fund is not a deposit of a bank and is not insured or
guaranteed by the Federal Deposit Insurance Corporation or any other government
agency. You
could lose money by investing in the fund.
Performance
The
following information is intended to help you understand the risks of investing
in the fund.
The
information illustrates the changes in the performance of the fund's shares from
year to year and compares the performance of the fund's shares to the
performance of a securities market index over various periods of
time.
The index description appears in the "Additional Index Information" section of
the prospectus.
Past performance (before and after taxes) is not an indication of future
performance.
Visit
www.fidelity.com for
more recent performance information.
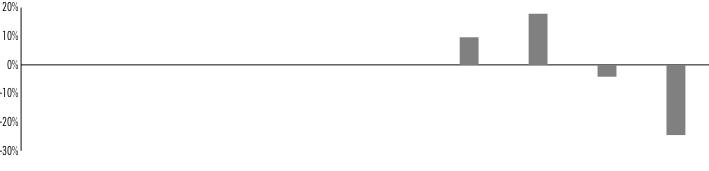
Year-by-Year
Returns
|
|
2013 |
2014 |
2015 |
2016 |
2017 |
2018 |
2019 |
2020 |
2021 |
2022 |
|
|
22.51%
|
-7.48%
|
1.05%
|
-1.57%
|
20.43%
|
-16.35%
|
19.83%
|
4.89%
|
16.38%
|
-7.21%
|
|
During
the periods shown in the chart: |
Returns |
Quarter
ended |
|
Highest
Quarter Return |
20.66% |
December
31, 2022 |
|
Lowest
Quarter Return |
-27.88% |
March
31, 2020 |
|
Year-to-Date
Return |
9.57% |
September
30, 2023 |
Average
Annual Returns
After-tax
returns are calculated using the historical highest individual federal marginal
income tax rates, but do not reflect the impact of state or local
taxes.
Actual after-tax returns may differ depending on your individual
circumstances.
The after-tax returns shown are not relevant if you hold your shares in a
retirement account or in another tax-deferred arrangement, such as an employee
benefit plan (profit sharing, 401(k), or 403(b)
plan).
Return After Taxes on Distributions and Sale of Fund Shares may be higher than
other returns for the same period due to a tax benefit of realizing a capital
loss upon the sale of fund shares.
|
For
the periods ended December 31, 2022 |
Past
1
year |
Past
5
years |
Past
10
years |
|
Fidelity®
Series International Value Fund |
|
|
|
|
Return
Before Taxes |
-7.21%
|
2.57%
|
4.42%
|
|
Return
After Taxes on Distributions |
-7.83%
|
1.51%
|
3.44%
|
|
Return
After Taxes on Distributions and Sale of Fund
Shares
|
-3.66%
|
1.78%
|
3.32%
|
|
MSCI
EAFE Value Index
(reflects
no deduction for fees or expenses) |
-5.33% |
0.43% |
3.74% |
|
|
|
|
|
Investment
Adviser
FMR
(the Adviser) is the fund's manager. Other investment advisers serve as
sub-advisers for the fund.
Portfolio
Manager(s)
Alexander
Zavratsky (Portfolio Manager) has managed the fund since 2011.
Purchase
and Sale of Shares
Shares
are offered only to certain other Fidelity®
funds, Fidelity managed 529 plans, and Fidelity managed collective investment
trusts.
The
price to sell one share is its net asset value per share (NAV). Shares will be
sold at the NAV next calculated after an order is received in proper
form.
The
fund is open for business each day the New York Stock Exchange (NYSE) is
open.
There
is no purchase minimum for fund shares.
Tax
Information
Distributions
you receive from the fund are subject to federal income tax and generally will
be taxed as ordinary income or capital gains, and may also be subject to state
or local taxes, unless you are investing through a tax-advantaged retirement
account (in which case you may be taxed later, upon withdrawal of your
investment from such account).
Payments
to Broker-Dealers and Other Financial Intermediaries
The
fund, the Adviser, Fidelity Distributors Company LLC (FDC), and/or their
affiliates may pay intermediaries, which may include banks, broker-dealers,
retirement plan sponsors, administrators, or service-providers (who may be
affiliated with the Adviser or FDC), for the sale of fund shares and related
services. These payments may create a conflict of interest by influencing your
intermediary and your investment professional to recommend the fund over another
investment. Ask your investment professional or visit your intermediary's web
site for more information.
Fund
Basics
Investment
Objective
Fidelity®
Series Emerging Markets Fund seeks capital appreciation.
Principal
Investment Strategies
The
Adviser normally invests at least 80% of the fund's assets in securities of
issuers in emerging markets and other investments that are tied economically to
emerging markets. Emerging markets include countries that have an emerging stock
market as defined by MSCI, countries or markets with low- to middle-income
economies as classified by the World Bank, and other countries or markets that
the Adviser identifies as having similar emerging markets characteristics.
Emerging markets tend to have relatively low gross national product per capita
compared to the world's major economies and may have the potential for rapid
economic growth. The Adviser normally invests the fund's assets primarily in
common stocks.
The
Adviser normally allocates the fund's investments across different emerging
markets countries.
In
buying and selling securities for the fund, the Adviser relies on fundamental
analysis, which involves a bottom-up assessment of a company's potential for
success in light of factors including its financial condition, earnings outlook,
strategy, management, industry position, and economic and market
conditions.
If
the Adviser's strategies do not work as intended, the fund may not achieve its
objective.
Investment
Objective
Fidelity®
Series Emerging Markets Opportunities Fund seeks capital
appreciation.
Principal
Investment Strategies
The
Adviser normally invests at least 80% of the fund's assets in securities of
issuers in emerging markets and other investments that are tied economically to
emerging markets. Emerging markets include countries that have an emerging stock
market as defined by MSCI, countries or markets with low- to middle-income
economies as classified by the World Bank, and other countries or markets that
the Adviser identifies as having similar emerging markets characteristics.
Emerging markets tend to have relatively low gross national product per capita
compared to the world's major economies and may have the potential for rapid
economic growth. The Adviser normally invests the fund's assets primarily in
common stocks.
The
Adviser normally allocates the fund's investments across different emerging
markets countries.
The
Adviser allocates the fund's assets across different market sectors, using
different Fidelity managers to handle investments within each sector. At
present, these sectors include communication services, consumer discretionary,
consumer staples, energy, financials, health care, industrials, information
technology, materials, real estate, and utilities.
The
Adviser expects the fund's sector allocations will approximate the sector
weightings of the MSCI Emerging Markets Index, a market capitalization-weighted
index that is designed to measure the investable equity market performance for
global investors in emerging markets. While the Adviser may overweight or
underweight one or more sectors from time to time, the Adviser expects the
returns of the fund to be driven primarily by the security selections of the
managers of each sector.
In
buying and selling securities for the fund, the Adviser relies on fundamental
analysis, which involves a bottom-up assessment of a company's potential for
success in light of factors including its financial condition, earnings outlook,
strategy, management, industry position, and economic and market
conditions.
If
the Adviser's strategies do not work as intended, the fund may not achieve its
objective.
Investment
Objective
Fidelity®
Series International Growth Fund seeks capital appreciation.
Principal
Investment Strategies
The
Adviser normally invests the fund's assets primarily in non-U.S. securities,
including securities of issuers located in emerging markets. The Adviser
normally invests the fund's assets primarily in common stocks. The Adviser
invests the fund's assets in companies it believes have above-average growth
potential. Growth may be measured by factors such as earnings or revenue.
Emerging markets include countries that have an emerging stock market as defined
by MSCI, countries or markets with low- to middle-income economies as classified
by the World Bank, and other countries or markets that the Adviser identifies as
having similar emerging markets characteristics. Emerging markets tend to have
relatively low gross national product per capita compared to the world's major
economies and may have the potential for rapid economic growth.
Companies
with high growth potential tend to be companies with higher than average
price/earnings (P/E) or price/book (P/B) ratios. Companies with strong growth
potential often have new products, technologies, distribution channels, or other
opportunities, or have a strong industry or market position. The stocks of these
companies are often called "growth" stocks.
The
Adviser normally allocates the fund's investments across different countries and
regions.
In
buying and selling securities for the fund, the Adviser relies on fundamental
analysis, which involves a bottom-up assessment of a company's potential for
success in light of factors including its financial condition, earnings outlook,
strategy, management, industry position, and economic and market
conditions.
If
the Adviser's strategies do not work as intended, the fund may not achieve its
objective.
Investment
Objective
Fidelity®
Series International Small Cap Fund seeks capital appreciation.
Principal
Investment Strategies
The
Adviser normally invests the fund's assets primarily in non-U.S. securities,
including securities of issuers located in emerging markets. Emerging markets
include countries that have an emerging stock market as defined by MSCI,
countries or markets with low- to middle-income economies as classified by the
World Bank, and other countries or markets that the Adviser identifies as having
similar emerging markets characteristics. Emerging markets tend to have
relatively low gross national product per capita compared to the world's major
economies and may have the potential for rapid economic growth.
The
Adviser normally invests at least 80% of the fund's assets in securities of
companies with small market capitalizations. Although a universal definition of
small market capitalization companies does not exist, for purposes of this fund,
the Adviser generally defines small market capitalization companies as those
whose market capitalization is similar to the market capitalization of companies
in the MSCI EAFE Small Cap Index or the MSCI ACWI ex USA Small Cap Index. A
company's market capitalization is based on its current market capitalization or
its market capitalization at the time of the fund's investment. The size of the
companies in each index changes with market conditions and the composition of
the index. The Adviser normally invests the fund's assets primarily in common
stocks.
The
Adviser normally allocates the fund's investments across different countries and
regions.
In
buying and selling securities for the fund, the Adviser relies on fundamental
analysis, which involves a bottom-up assessment of a company's potential for
success in light of factors including its financial condition, earnings outlook,
strategy, management, industry position, and economic and market
conditions.
If
the Adviser's strategies do not work as intended, the fund may not achieve its
objective.
Investment
Objective
Fidelity®
Series International Value Fund seeks capital appreciation.
Principal
Investment Strategies
The
Adviser normally invests the fund's assets primarily in non-U.S. securities,
including securities of issuers located in emerging markets. The Adviser
normally invests the fund's assets primarily in common stocks. Emerging markets
include countries that have an emerging stock market as defined by MSCI,
countries or markets with low- to middle-income economies as classified by the
World Bank, and other countries or markets that the Adviser identifies as having
similar emerging markets characteristics. Emerging markets tend to have
relatively low gross national product per capita compared to the world's major
economies and may have the potential for rapid economic growth.
The
Adviser invests in securities of companies that it believes are undervalued in
the marketplace in relation to factors such as the company's assets, sales,
earnings, growth potential, or cash flow, or in relation to securities of other
companies in the same industry. The Adviser considers traditional and other
measures of value such as P/B ratio, price/sales (P/S) ratio, P/E ratio,
earnings relative to enterprise value (the total value of a company's
outstanding equity and debt), and the discounted value of a company's projected
future free cash flows. The types of companies in which the fund may invest
include companies experiencing positive fundamental change, such as a new
management team or product launch, a significant cost-cutting initiative, a
merger or acquisition, or a reduction in industry capacity that should lead to
improved pricing; companies whose earnings potential has increased or is
expected to increase more than generally perceived; and companies that have
enjoyed recent market popularity but which appear to have temporarily fallen out
of favor for reasons that are considered non-recurring or
short-term.
The
Adviser normally allocates the fund's investments across different countries and
regions.
In
buying and selling securities for the fund, the Adviser relies on fundamental
analysis, which involves a bottom-up assessment of a company's potential for
success in light of factors including its financial condition, earnings outlook,
strategy, management, industry position, and economic and market
conditions.
If
the Adviser's strategies do not work as intended, the fund may not achieve its
objective.
Description
of Principal Security Types
Equity
securities
represent an ownership interest, or the right to acquire an ownership interest,
in an issuer. Different types of equity securities provide different voting and
dividend rights and priority in the event of the bankruptcy of the
issuer. Equity securities include common stocks, preferred stocks,
convertible securities, and warrants.
Principal
Investment Risks
Many
factors affect each fund's performance. Developments that disrupt global
economies and financial markets, such as pandemics and epidemics, may magnify
factors that affect a fund's performance. A fund's share price changes daily
based on changes in market conditions and interest rates and in response to
other economic, political, or financial developments. A fund's reaction to these
developments will be affected by the types of securities in which the fund
invests, the financial condition, industry and economic sector, and geographic
location of an issuer, and the fund's level of investment in the securities of
that issuer. Because each of Fidelity®
Series Emerging Markets Fund and Fidelity®
Series Emerging Markets Opportunities Fund concentrates its investments in a
particular group of countries, the fund's performance is expected to be closely
tied to social, political, and economic conditions within that group of
countries and to be more volatile than the performance of more geographically
diversified funds. When you sell your shares they may be worth more or less than
what you paid for them, which means that you could lose money by investing in a
fund.
The
following factors can significantly affect a fund's performance:
Stock
Market Volatility.
The value of equity securities fluctuates in response to issuer, political,
market, and economic developments. Fluctuations, especially in foreign markets,
can be dramatic over the short as well as long term, and different parts of the
market, including different market sectors, and different types of equity
securities can react differently to these developments. For example, stocks of
companies in one sector can react differently from those in another, large cap
stocks can react differently from small cap stocks, and "growth" stocks can
react differently from "value" stocks. Issuer, political, or economic
developments can affect a single issuer, issuers within an industry or economic
sector or geographic region, or the market as a whole. Changes in the financial
condition of a single issuer can impact the market as a whole. Terrorism and
related geo-political risks have led, and may in the future lead, to increased
short-term market volatility and may have adverse long-term effects on world
economies and markets generally.
Foreign
and Emerging Markets Risk. Foreign
securities, foreign currencies, and securities issued by U.S. entities with
substantial foreign operations can involve additional risks relating to
political, economic, or regulatory conditions in foreign countries. These risks
include fluctuations in foreign exchange rates; withholding or other taxes;
trading, settlement, custodial, and other operational risks; and the less
stringent investor protection and disclosure standards of some foreign markets.
All of these factors can make foreign investments, especially those in emerging
markets, more volatile and potentially less liquid than U.S. investments. In
addition, foreign markets can perform differently from the U.S.
market.
Investing
in emerging markets can involve risks in addition to and greater than those
generally associated with investing in more developed foreign markets. The
extent of economic development; political stability; market depth,
infrastructure, and capitalization; and regulatory oversight can be less than in
more developed markets. Emerging markets typically have less established legal,
accounting and financial reporting systems than those in more developed markets,
which may reduce the scope or quality of financial information available to
investors. Emerging markets economies can be subject to greater social,
economic, regulatory, and political uncertainties and can be extremely volatile.
All of these factors can make emerging markets securities more volatile and
potentially less liquid than securities issued in more developed
markets.
Global
economies and financial markets are becoming increasingly interconnected, which
increases the possibilities that conditions in one country or region might
adversely impact issuers or providers in, or foreign exchange rates with, a
different country or region.
Geographic
Exposure.
Social, political, and economic conditions and changes in regulatory, tax, or
economic policy in a country or region could significantly affect the market in
that country or region. From time to time, a small number of companies and
industries may represent a large portion of the market in a particular country
or region, and these companies and industries can be sensitive to adverse
social, political, economic, currency, or regulatory developments. Similarly,
from time to time, a fund may invest a meaningful portion of its assets in the
securities of issuers located in a single country or a limited number of
countries. If the fund invests in this manner, there is a higher risk that
social, political, economic, tax (such as a tax on foreign investments or
financial transactions), currency, or regulatory developments in those countries
may have a significant impact on the fund's investment performance.
Special
Considerations regarding China.
The
Chinese economy is dependent on the economies of other countries and can be
significantly affected by currency fluctuations and increasing competition from
Asia's other low-cost emerging economies. The willingness and ability of the
Chinese government to support the Chinese economy and markets is uncertain.
China has yet to develop comprehensive securities, corporate, or commercial
laws, its market is relatively new and less developed, and its economy is
experiencing a relative slowdown. Also, foreign investments may be subject to
certain restrictions. Changes in Chinese government policy and economic growth
rates could significantly affect local markets. Reduction in spending on Chinese
products and services, institution of tariffs or other trade barriers or a
downturn in any of the economies of China's key trading partners may have an
adverse impact on the securities of Chinese issuers. Concerns exist regarding a
potential trade war between China and the United States, which may trigger a
significant reduction in international trade, the oversupply of certain
manufactured goods, substantial price reductions of goods and possible failure
of individual companies and/or large segments of China's export industry, all of
which may have a negative impact on a fund's investments.
A
fund may obtain exposure to companies based or operated in China by investing
through legal structures known as variable interest entities (VIEs). Instead of
directly owning the equity securities of a Chinese company, a VIE enters into
service and other contracts with the Chinese company. Although the VIE has no
equity ownership of the Chinese company, the contractual arrangements permit the
VIE to consolidate the Chinese company into its financial statements. VIE
investments are subject to the risk that any breach of these contractual
arrangements will be subject to Chinese law and jurisdiction, that Chinese law
may be interpreted or change in a way that affects the enforceability of the
VIE's arrangements, or that contracts between the Chinese company and the VIE
may otherwise not be enforceable under Chinese law. Thus, limiting the remedies
and rights of investors such as the fund. If these risks materialize, the value
of investments in VIEs could be adversely affected and a fund could incur
significant losses with no recourse available.
Special
Considerations regarding Europe.
Europe
includes both developed and emerging markets. Most developed countries in
Western Europe are members of the European Union (EU), and many are also members
of the European Economic and Monetary Union (EMU). European countries can be
significantly affected by the tight fiscal and monetary controls with which EU
members and candidates for EMU membership are required to comply. In addition,
the private and public sectors' debt problems of a single EU country can pose
economic risks to the EU as a whole. Unemployment in Europe has historically
been higher than in the United States, public deficits are an ongoing concern in
many European countries, the region is currently facing great political and
economic uncertainty and many European economies are experiencing slow economic
growth or recession. Eastern European countries generally continue to move
toward market economies. However, their markets remain relatively undeveloped
and can be particularly sensitive to social, political, and economic
developments. The EU faces challenges related to member states seeking to change
their relationship with the EU, exemplified by the United Kingdom's withdrawal.
There can be significant uncertainty as to the terms and consequences of one or
more member states seeking to change their relationship with the EU. Among other
things, a member state's decision to leave the EU could result in increased
volatility and illiquidity in the European and such member state's economies, as
well as the broader global economy. Companies with a significant amount of
business in the member state or Europe may experience lower revenue and/or
profit growth, which may adversely affect the value of a fund's investments. In
addition, uncertainty regarding any member state's exit from the EU may lead to
instability in the foreign exchange markets, including volatility in the value
of the euro.
Special
Considerations regarding Japan. The
Japanese economy, at times, has been characterized by government intervention
and protectionism, an aging demographic, declining population, and an unstable
financial services sector. International trade, particularly with the United
States, government support of the financial services sector and other troubled
sectors, consistent government policy, natural disasters, and geopolitical
developments can significantly affect economic growth. Since a significant
portion of Japan's trade is conducted with developing nations, almost all of
which are in East and Southeast Asia, it can be affected by currency
fluctuations and other conditions in these other countries.
Issuer-Specific
Changes.
Changes in the financial condition of an issuer or counterparty, changes in
specific economic or political conditions that affect a particular type of
security or issuer, and changes in general economic or political conditions can
increase the risk of default by an issuer or counterparty, which can affect a
security's or instrument's value. The value of securities of smaller, less
well-known issuers can be more volatile than that of larger
issuers.
"Growth"
Investing.
"Growth" stocks can react differently to issuer, political, market, and economic
developments than the market as a whole and other types of stocks. "Growth"
stocks tend to be more expensive relative to their earnings or assets compared
to other types of stocks. As a result, "growth" stocks tend to be sensitive to
changes in their earnings and more volatile than other types of
stocks.
"Value"
Investing.
"Value" stocks can react differently to issuer, political, market, and economic
developments than the market as a whole and other types of stocks. "Value"
stocks tend to be inexpensive relative to their earnings or assets compared to
other types of stocks. However, "value" stocks can continue to be inexpensive
for long periods of time and may not ever realize their full value.
Small
Cap Investing.
The value of securities of smaller, less well-known issuers can be more volatile
than that of larger issuers and can react differently to issuer, political,
market, and economic developments than the market as a whole and other types of
stocks. Smaller issuers can have more limited product lines, markets, and
financial resources.
In
response to market, economic, political, or other conditions, a fund may
temporarily use a different investment strategy for defensive purposes. If the
fund does so, different factors could affect its performance and the fund may
not achieve its investment objective.
Other
Investment Strategies
In
addition to the principal investment strategies discussed above, the Adviser may
lend a fund's securities to broker-dealers or other institutions to earn income
for the fund.
The
Adviser may invest Fidelity®
Series Emerging Markets Opportunities Fund's assets in securities of private or
newly public companies.
The
Adviser may also use various techniques, such as buying and selling futures
contracts and exchange traded funds, to increase or decrease a fund's exposure
to changing security prices or other factors that affect security
values.
Non-Fundamental
Investment Policies
Each
fund's investment objective is non-fundamental and may be changed without
shareholder approval.
Shareholder
Notice
The
following is subject to change only upon 60 days' prior notice to
shareholders:
Fidelity®
Series Emerging Markets Fund normally invests at least 80% of its assets in
securities of issuers in emerging markets and other investments that are tied
economically to emerging markets.
Fidelity®
Series Emerging Markets Opportunities Fund normally invests at least 80% of its
assets in securities of issuers in emerging markets and other investments that
are tied economically to emerging markets.
Fidelity®
Series International Small Cap Fund normally
invests at least 80% of its assets in securities of companies with small market
capitalizations.
Country
or Geographic Region
The
Adviser considers a number of factors to determine whether an investment is tied
economically to a particular country or region, including: the source of
government guarantees (if any); the primary trading market; the issuer's
domicile, sources of revenue, and location of assets; whether the investment is
included in an index representative of a particular country or region; and
whether the investment is exposed to the economic fortunes and risks of a
particular country or region.
Each
fund is open for business each day the NYSE is open.
The
NAV is the value of a single share. Fidelity normally calculates NAV each
business day as of the times noted in the table below. Each fund's assets
normally are valued as of this time for the purpose of computing
NAV.
|
Fund |
NAV
Calculation Times
(Eastern
Time) |
|
Fidelity®
Series Emerging Markets Fund |
4:00
p.m. |
|
Fidelity®
Series Emerging Markets Opportunities Fund |
4:00
p.m. |
|
Fidelity®
Series International Growth Fund |
4:00
p.m. |
|
Fidelity®
Series International Small Cap Fund |
4:00
p.m. |
|
Fidelity®
Series International Value Fund |
4:00
p.m. |
NAV
is not calculated and a fund will not process purchase and redemption requests
submitted on days when the fund is not open for business. The time at which
shares are priced and until which purchase and redemption orders are accepted
may be changed as permitted by the Securities and Exchange Commission
(SEC).
To
the extent that a fund's assets are traded in other markets on days when the
fund is not open for business, the value of the fund's assets may be affected on
those days. In addition, trading in some of a fund's assets may not occur on
days when the fund is open for business.
NAV
is calculated using the values of other open-end funds, if any, in which a fund
invests (referred to as underlying funds). Shares of underlying funds are valued
at their respective NAVs. Other assets are valued primarily on the basis of
market quotations, official closing prices, or information furnished by a
pricing service. Certain short-term securities are valued on the basis of
amortized cost. If market quotations, official closing prices, or information
furnished by a pricing service are not readily available or, in the Adviser's
opinion, are deemed unreliable for a security, then that security will be fair
valued in good faith by the Adviser in accordance with applicable fair value
pricing policies. For example, if, in the Adviser's opinion, a security's value
has been materially affected by events occurring before a fund's pricing time
but after the close of the exchange or market on which the security is
principally traded, then that security will be fair valued in good faith by the
Adviser in accordance with applicable fair value pricing policies. Fair value
pricing will be used for high yield debt securities when available pricing
information is determined to be stale or for other reasons not to accurately
reflect fair value.
Arbitrage
opportunities may exist when trading in a portfolio security or securities is
halted and does not resume before a fund calculates its NAV. These arbitrage
opportunities may enable short-term traders to dilute the NAV of long-term
investors. Securities trading in overseas markets, if applicable, present
time zone arbitrage opportunities when events affecting portfolio security
values occur after the close of the overseas markets but prior to the close of
the U.S. market. Fair valuation of a fund's portfolio securities can serve to
reduce arbitrage opportunities available to short-term traders, but there is no
assurance that fair value pricing policies will prevent dilution of NAV by
short-term traders.
Fair
value pricing is based on subjective judgments and it is possible that the fair
value of a security may differ materially from the value that would be realized
if the security were sold.
Shareholder
Information
Additional
Information about the Purchase and Sale of Shares
As
used in this prospectus, the term "shares" generally refers to the shares
offered through this prospectus.
Frequent
Purchases and Redemptions
A
fund may reject for any reason, or cancel as permitted or required by law, any
purchase orders, including transactions deemed to represent excessive trading,
at any time.
Excessive
trading of fund shares can harm shareholders in various ways, including reducing
the returns to long-term shareholders by increasing costs to a fund (such as
brokerage commissions or spreads paid to dealers who sell money market
instruments), disrupting portfolio management strategies, and diluting the value
of the shares in cases in which fluctuations in markets are not fully priced
into the fund's NAV.
Because
each fund is offered only for investment to certain other Fidelity®
funds, Fidelity managed 529 plans, and Fidelity managed collective
investment trusts, the potential for excessive or short-term disruptive
purchases and sales is reduced. Accordingly, the Board of Trustees has not
adopted policies and procedures designed to discourage excessive trading of fund
shares and each fund accommodates frequent trading.
Each
fund has no limit on purchase transactions but may in its discretion restrict,
reject, or cancel any purchases that, in the Adviser's opinion, may be
disruptive to the management of the fund or otherwise not be in the fund's
interests.
Each
fund reserves the right at any time to restrict purchases or impose conditions
that are more restrictive on excessive trading than those stated in this
prospectus.
Each
fund has no exchange privilege with any other fund.
Buying
Shares
Eligibility
Shares
are generally available only to investors residing in the United
States.
Shares
are offered only to certain other Fidelity®
funds, Fidelity managed 529 plans, and Fidelity managed collective investment
trusts.
There
is no minimum balance or purchase minimum for fund shares.
Price
to Buy
The
price to buy one share is its NAV. Shares are sold without a sales
charge.
Shares
will be bought at the NAV next calculated after an order is received in proper
form.
If
applicable, orders by funds of funds for which Fidelity serves as investment
manager will be treated as received by the fund at the same time that the
corresponding orders are received in proper form by the funds of
funds.
Each
fund may stop offering shares completely or may offer shares only on a limited
basis, for a period of time or permanently.
When
you place an order to buy shares, note the following:
- All
wires must be received in proper form by Fidelity at the applicable fund's
designated wire bank before the close of the Federal Reserve Wire System on
the day of purchase or you could be liable for any losses or fees a fund or
Fidelity has incurred or for interest and penalties.
- Under
applicable anti-money laundering rules and other regulations, purchase orders
may be suspended, restricted, or canceled and the monies may be
withheld.
Selling
Shares
The
price to sell one share is its NAV.
Shares
will be sold at the NAV next calculated after an order is received in proper
form.
Normally,
redemptions will be processed by the next business day, but it may take up to
seven days to pay the redemption proceeds if making immediate payment would
adversely affect a fund.
If
applicable, orders by funds of funds for which Fidelity serves as investment
manager will be treated as received by the fund at the same time that the
corresponding orders are received in proper form by the funds of
funds.
See
"Policies Concerning the Redemption of Fund Shares" below for additional
redemption information.
When
you place an order to sell shares, note the following:
- Redemptions
may be suspended or payment dates postponed when the NYSE is closed (other
than weekends or holidays), when trading on the NYSE is restricted, or as
permitted by the SEC.
- Redemption
proceeds may be paid in securities or other property rather than in cash if
the Adviser determines it is in the best interests of a fund.
- Under
applicable anti-money laundering rules and other regulations, redemption
requests may be suspended, restricted, canceled, or processed and the proceeds
may be withheld.
Policies
Concerning the Redemption of Fund Shares
If
your account is held directly with a fund,
the length of time that a fund typically expects to pay redemption proceeds
depends on the method you have elected to receive such proceeds. A fund
typically expects to make payment of redemption proceeds by wire, automated
clearing house (ACH) or by issuing a check by the next business day following
receipt of a redemption order in proper form. Proceeds from the periodic and
automatic sale of shares of a Fidelity®
money
market fund that are used to buy shares of another Fidelity®
fund
are settled simultaneously.
If
your account is held through an intermediary,
the length of time that a fund typically expects to pay redemption proceeds
depends, in part, on the terms of the agreement in place between the
intermediary and a fund. For redemption proceeds that are paid either directly
to you from a fund or to your intermediary for transmittal to you, a fund
typically expects to make payments by wire, by ACH or by issuing a check on the
next business day following receipt of a redemption order in proper form from
the intermediary by a fund. Redemption orders that are processed through
investment professionals that utilize the National Securities Clearing
Corporation will generally settle one to three business days following receipt
of a redemption order in proper form.
As
noted elsewhere, payment of redemption proceeds may take longer than the time a
fund typically expects and may take up to seven days from the date of receipt of
the redemption order as permitted by applicable law.
Redemption
Methods Available. Generally
a fund expects to pay redemption proceeds in cash. To do so, a fund typically
expects to satisfy redemption requests either by using available cash (or cash
equivalents) or by selling portfolio securities. On a less regular basis, a fund
may also satisfy redemption requests by utilizing one or more of the following
sources, if permitted: borrowing from another Fidelity®
fund;
drawing on an available line or lines of credit from a bank or banks; or using
reverse repurchase agreements. These methods may be used during both normal and
stressed market conditions.
In
addition to paying redemption proceeds in cash, a fund reserves the right to pay
part or all of your redemption proceeds in readily marketable securities instead
of cash (redemption in-kind). Redemption in-kind proceeds will typically be made
by delivering the selected securities to the redeeming shareholder within seven
days after the receipt of the redemption order in proper form by a
fund.
Fidelity
will send monthly account statements detailing fund balances and all
transactions completed during the prior month.
You
may be asked to provide additional information in order for Fidelity to verify
your identity in accordance with requirements under anti-money laundering
regulations. Accounts may be restricted and/or closed, and the monies withheld,
pending verification of this information or as otherwise required under these
and other federal regulations.
Dividends
and Capital Gain Distributions
Each
fund earns interest, dividends, and other income from its investments, and
distributes this income (less expenses) to shareholders as dividends. Each fund
also realizes capital gains from its investments, and distributes these gains
(less any losses) to shareholders as capital gain distributions.
Each
fund normally pays dividends and capital gain distributions per the tables
below:
|
Fund
Name |
|
Dividends
Paid |
|
Fidelity®
Series Emerging Markets Fund |
|
December |
|
Fidelity®
Series Emerging Markets Opportunities Fund |
|
December |
|
Fidelity®
Series International Growth Fund |
|
December |
|
Fidelity®
Series International Small Cap Fund |
|
December |
|
Fidelity®
Series International Value Fund |
|
December |
|
Fund
Name |
|
Capital
Gains Paid |
|
Fidelity®
Series Emerging Markets Fund |
|
December |
|
Fidelity®
Series Emerging Markets Opportunities Fund |
|
December |
|
Fidelity®
Series International Growth Fund |
|
December |
|
Fidelity®
Series International Small Cap Fund |
|
December |
|
Fidelity®
Series International Value Fund |
|
December |
Any
dividends and capital gain distributions may be reinvested in additional shares
or paid in cash.
As
with any investment, your investment in a fund could have tax consequences for
you (for non-retirement accounts).
Taxes
on Distributions
Distributions
you receive from each fund are subject to federal income tax, and may also be
subject to state or local taxes.
For
federal tax purposes, certain distributions, including dividends and
distributions of short-term capital gains, are taxable to you as ordinary
income, while certain distributions, including distributions of long-term
capital gains, are taxable to you generally as capital gains. A percentage of
certain distributions of dividends may qualify for taxation at long-term capital
gains rates (provided certain holding period requirements are
met).
If
you buy shares when a fund has realized but not yet distributed income or
capital gains, you will be "buying a dividend" by paying the full price for the
shares and then receiving a portion of the price back in the form of a taxable
distribution.
Any
taxable distributions you receive from a fund will normally be taxable to you
when you receive them.
Taxes
on Transactions
Your
redemptions may result in a capital gain or loss for federal tax purposes. A
capital gain or loss on your investment in a fund generally is the difference
between the cost of your shares and the price you receive when you sell
them.
Fund
Services
Each
fund is a mutual fund, an investment that pools shareholders' money and invests
it toward a specified goal.
Adviser
FMR.
The
Adviser is each fund's manager. The address of the Adviser is 245 Summer Street,
Boston, Massachusetts 02210.
As
of December 31, 2022, the Adviser had approximately $3.1 trillion in
discretionary assets under management, and approximately $3.9 trillion when
combined with all of its affiliates' assets under management.
As
the manager, the Adviser has overall responsibility for directing each fund's
investments and handling its business affairs.
Sub-Adviser(s)
FMR
Investment Management (UK) Limited (FMR UK),
at 1 St. Martin's Le Grand, London, EC1A 4AS, United Kingdom, serves as a
sub-adviser for each fund. As of December 31, 2022, FMR UK had approximately
$14.7 billion in discretionary assets under management. FMR UK is an affiliate
of the Adviser.
Currently,
FMR UK has day-to-day responsibility for choosing certain types of investments
for Fidelity® Series International Small Cap Fund.
FMR
UK may provide investment research and advice on issuers based outside the
United States and may also provide investment advisory services for
Fidelity®
Series Emerging Markets Fund, Fidelity®
Series Emerging Markets Opportunities Fund, Fidelity®
Series International Growth Fund, and Fidelity®
Series International Value Fund.
Fidelity
Management & Research (Hong Kong) Limited (FMR H.K.),
at Floor 19, 41 Connaught Road Central, Hong Kong, serves as a sub-adviser for
each fund. As of December 31, 2022, FMR H.K. had approximately $21.4 billion in
discretionary assets under management. FMR H.K. is an affiliate of the
Adviser.
Currently,
FMR H.K. has day-to-day responsibility for choosing certain types of investments
for Fidelity®
Series Emerging Markets Opportunities Fund.
FMR
H.K. may provide investment research and advice on issuers based outside the
United States and may also provide investment advisory services for
Fidelity®
Series Emerging Markets Fund, Fidelity®
Series International Growth Fund, Fidelity®
Series International Small Cap Fund, and Fidelity®
Series International Value Fund.
Fidelity
Management & Research (Japan) Limited (FMR Japan),
at Kamiyacho Prime Place, 1-17, Toranomon-4-Chome, Minato-ku, Tokyo, Japan,
serves as a sub-adviser for each fund. As of March 31, 2023, FMR Japan had
approximately $2.9 billion in discretionary assets under management. FMR Japan
is an affiliate of the Adviser.
Currently,
FMR Japan has day-to-day responsibility for choosing certain types of
investments for Fidelity® Series Emerging Markets Opportunities
Fund.
FMR
Japan may provide investment research and advice on issuers based outside the
United States and may also provide investment advisory services for
Fidelity®
Series Emerging Markets Fund, Fidelity®
Series International Growth Fund, Fidelity®
Series International Small Cap Fund, and Fidelity®
Series International Value Fund.
Portfolio
Manager(s)
John
Chow is Portfolio Manager of Fidelity®
Series Emerging Markets Fund, which he has managed since 2020. He also
manages other funds. Since joining Fidelity Investments in 1994, Mr. Chow has
worked as a quantitative analyst and a portfolio manager.
Priyanshu
Bakshi is Co-Portfolio Manager of Fidelity®
Series Emerging Markets Opportunities Fund, which he has managed since 2021. He
also manages other funds. Since joining Fidelity Investments in 2015, Mr. Bakshi
has worked as a research analyst, sector leader, and portfolio
manager.
Di
Chen is Co-Portfolio Manager of Fidelity®
Series Emerging Markets Opportunities Fund, which she has managed since 2020.
She also manages other funds. Since joining Fidelity Investments in 2009,
Ms. Chen has worked as a research analyst and portfolio manager.
Lewis
Chung is Co-Portfolio Manager of Fidelity®
Series Emerging Markets Opportunities Fund, which he has managed since 2022. He
also manages other funds. Since joining Fidelity Investments in 2010, Mr. Chung
has worked as a research analyst and portfolio manager.
Gregory
Lee is Co-Portfolio Manager of Fidelity®
Series Emerging Markets Opportunities Fund, which he has managed since 2012. He
also manages other funds. Since joining Fidelity Investments in 2007, Mr. Lee
has worked as a research analyst and portfolio manager.
Takamitsu
Nishikawa is Co-Portfolio Manager of Fidelity®
Series Emerging Markets Opportunities Fund, which he has managed since 2021. He
also manages other funds. Since joining Fidelity Investments in 2014, Mr.
Nishikawa has worked as a research analyst and portfolio manager.
Sam
Polyak is Co-Portfolio Manager of Fidelity®
Series Emerging Markets Opportunities Fund, which he has managed since 2010. He
also manages other funds. Since joining Fidelity Investments in 2010, Mr. Polyak
has worked as a portfolio manager.
Will
Pruett is Co-Portfolio Manager of Fidelity®
Series Emerging Markets Opportunities Fund, which he has managed since 2020. He
also manages other funds. Since joining Fidelity Investments in 2008, Mr. Pruett
has worked as a research analyst and portfolio manager.
Xiaoting
Zhao is Co-Portfolio Manager of Fidelity®
Series Emerging Markets Opportunities Fund, which he has managed since 2015. He
also manages other funds. Since joining Fidelity Investments in 2009, Mr. Zhao
has worked as a research analyst and portfolio manager.
Jed
Weiss is Portfolio Manager of Fidelity®
Series International Growth Fund and Lead Portfolio Manager of
Fidelity®
Series International Small Cap Fund, both of which he has managed since 2009. He
also manages other funds. Since joining Fidelity Investments in 1997,
Mr. Weiss has worked as a research analyst and portfolio manager (other
than a 6-month leave of absence in 2017).
Patrick
Drouot is Co-Portfolio Manager of Fidelity®
Series International Small Cap Fund, which he has managed since 2017. Since
joining Fidelity Investments in 2006, Mr. Drouot has worked as an equity
research associate and portfolio manager.
Preeti
Sayana is Co-Portfolio Manager of Fidelity®
Series International Small Cap Fund, which she has managed since 2018. Since
joining Fidelity Investments in 2005, Ms. Sayana has worked as research analyst
and portfolio manager.
Alex
Zavratsky is Portfolio Manager of Fidelity®
Series International Value Fund, which he has managed since 2011. He also
manages other funds. Since joining Fidelity Investments in 1996, Mr. Zavratsky
has worked as a research analyst, portfolio assistant, and portfolio
manager.
The
Statement of Additional Information (SAI) provides additional information about
the compensation of, any other accounts managed by, and any fund shares held by
the portfolio manager(s).
From
time to time a manager, analyst, or other Fidelity employee may express views
regarding a particular company, security, industry, or market sector. The views
expressed by any such person are the views of only that individual as of the
time expressed and do not necessarily represent the views of Fidelity or any
other person in the Fidelity organization. Any such views are subject to change
at any time based upon market or other conditions and Fidelity disclaims any
responsibility to update such views. These views may not be relied on as
investment advice and, because investment decisions for a fund are based on
numerous factors, may not be relied on as an indication of trading intent on
behalf of any fund.
Advisory
Fee(s)
Each
fund does not pay a management fee to the Adviser.
The
Adviser receives no fee from each fund for handling the business affairs of each
fund and pays the expenses of each fund with certain exceptions.
The
Adviser or an affiliate pays FMR UK, FMR H.K., and FMR Japan for providing
sub-advisory services.
The
basis for the Board of Trustees approving the management contract and
sub-advisory agreements for each fund is available in each fund's annual report
for the fiscal period ended October 31, 2023.
From
time to time, the Adviser or its affiliates may agree to reimburse or waive
certain fund expenses while retaining the ability to be repaid if expenses fall
below the specified limit prior to the end of the fiscal year.
Reimbursement
or waiver arrangements can decrease expenses and boost performance.
FMR
has contractually agreed to reimburse Fidelity®
Series International Growth Fund, Fidelity®
Series International Small Cap Fund, and Fidelity®
Series International Value Fund to the extent that total operating expenses
(excluding interest, fees and expenses of the Independent Trustees, and acquired
fund fees and expenses (including fees and expenses associated with a wholly
owned subsidiary), if any, as well as non-operating expenses such as brokerage
commissions and fees and expenses associated with the fund's securities lending
program, if applicable), as a percentage of its average net assets, exceed
0.013% (the Expense Caps). If at any time during the current fiscal year
expenses for the fund fall below the Expense Caps, FMR reserves the right to
recoup through the end of the fiscal year any expenses that were reimbursed
during the current fiscal year up to, but not in excess of, the Expense Caps.
These arrangements will remain in effect through February 28, 2027. FMR may not
terminate these arrangements before the expiration date without the approval of
the Board of Trustees and may extend them in its discretion after that
date.
Distribution
and Service Plan(s)
Each
fund has adopted a Distribution and Service Plan pursuant to Rule 12b-1 under
the Investment Company Act of 1940 (1940 Act) with respect to its shares that
recognizes that the Adviser may use its management fee revenues, as well as its
past profits or its resources from any other source, to pay FDC for expenses
incurred in connection with providing services intended to result in the sale of
shares of each fund and/or shareholder support services. The Adviser, directly
or through FDC, may pay significant amounts to intermediaries that provide those
services. Currently, the Board of Trustees of each fund has authorized such
payments for shares of each fund.
If
payments made by the Adviser to FDC or to intermediaries under a Distribution
and Service Plan were considered to be paid out of a fund's assets on an ongoing
basis, they might increase the cost of your investment and might cost you more
than paying other types of sales charges.
No
dealer, sales representative, or any other person has been authorized to give
any information or to make any representations, other than those contained in
this prospectus and in the related SAI, in connection with the offer contained
in this prospectus. If given or made, such other information or representations
must not be relied upon as having been authorized by the funds or FDC. This
prospectus and the related SAI do not constitute an offer by the funds or by FDC
to sell shares of the funds to, or to buy shares of the funds from, any person
to whom it is unlawful to make such offer.
Appendix
Financial
Highlights are intended to help you understand the financial history of fund
shares for the past 5 years (or, if shorter, the period of operations). Certain
information reflects financial results for a single share. The total returns in
the table represent the rate that an investor would have earned (or lost) on an
investment in shares (assuming reinvestment of all dividends and distributions).
The annual information has been audited by Deloitte & Touche LLP (for
Fidelity® Series Emerging Markets Fund, Fidelity® Series Emerging Markets
Opportunities Fund, Fidelity® Series International Small Cap Fund, and Fidelity®
Series International Value Fund) and PricewaterhouseCoopers LLP (for Fidelity®
Series International Growth Fund), independent registered public accounting
firms, whose reports, along with fund financial statements, are included in
the annual report. Annual reports are available for free upon
request.
|
Fidelity®
Series Emerging Markets Fund |
|
|
|
Years
ended October 31, |
|
2023
|
|
2022 |
|
2021 |
|
2020 |
|
2019 |
|
Selected
Per-Share Data |
|
|
|
|
|
|
|
|
|
|
|
Net
asset value, beginning of period |
$ |
6.94 |
$ |
11.31 |
$ |
9.65 |
$ |
9.48 |
$ |
8.87 |
|
Income
from Investment Operations |
|
|
|
|
|
|
|
|
|
|
|
Net
investment income (loss) A,B |
|
.24
|
|
.23
|
|
.20
|
|
.17
|
|
.30
C |
|
Net
realized and unrealized gain (loss) |
|
.74
|
|
(4.24)
|
|
1.62
|
|
.22
|
|
.35
|
|
Total
from investment operations |
|
.98
|
|
(4.01)
|
|
1.82
|
|
.39
|
|
.65
|
|
Distributions
from net investment income |
|
(.20)
|
|
(.30)
|
|
(.16)
|
|
(.22)
|
|
(.04)
|
|
Distributions
from net realized gain |
|
-
|
|
(.07)
|
|
-
|
|
-
|
|
-
|
|
Total
distributions |
|
(.20)
|
|
(.36)
D |
|
(.16)
|
|
(.22)
|
|
(.04)
|
|
Net
asset value, end of period |
$ |
7.72 |
$ |
6.94 |
$ |
11.31 |
$ |
9.65 |
$ |
9.48 |
|
Total
Return E,F |
|
14.04%
|
|
(36.53)%
|
|
18.88%
|
|
4.16%
|
|
7.33%
|
|
Ratios
to Average Net Assets B,G,H |
|
|
|
|
|
|
|
|
|
|
|
Expenses
before reductions |
|
.03%
|
|
.04%
|
|
.04%
|
|
.05%
|
|
.04%
|
|
Expenses
net of fee waivers, if any |
|
.01%
|
|
.01%
|
|
.01%
|
|
.01%
|
|
.01%
|
|
Expenses
net of all reductions |
|
.01%
|
|
.01%
|
|
.01%
|
|
.01%
|
|
.01%
|
|
Net
investment income (loss) |
|
2.96%
|
|
2.61%
|
|
1.70%
|
|
1.86%
|
|
3.24%
C |
|
Supplemental
Data |
|
|
|
|
|
|
|
|
|
|
|
Net
assets, end of period (000 omitted) |
$ |
4,904,858 |
$ |
2,436,744 |
$ |
3,239,693 |
$ |
2,995,875 |
$ |
2,065,165 |
|
Portfolio
turnover rate I |
|
90%
|
|
65%
|
|
78%
|
|
117%
J |
|
47%
|
ACalculated
based on average shares outstanding during the period.
BNet
investment income (loss) is affected by the timing of the declaration of
dividends by any underlying mutual funds or exchange-traded funds (ETFs). Net
investment income (loss) of any mutual funds or ETFs is not included in the
Fund's net investment income (loss) ratio.
CNet
investment income per share reflects one or more large, non-recurring
dividend(s) which amounted to $.07 per share. Excluding such non-recurring
dividend(s), the ratio of net investment income (loss) to average net assets
would have been 2.50%.
DTotal
distributions per share do not sum due to rounding.
ETotal
returns for periods of less than one year are not annualized.
FTotal
returns would have been lower if certain expenses had not been reduced during
the applicable periods shown.
GFees
and expenses of any underlying mutual funds or exchange-traded funds (ETFs) are
not included in the Fund's expense ratio. The Fund indirectly bears its
proportionate share of these expenses. For additional expense information
related to investments in Fidelity Central Funds, please refer to the
"Investments in Fidelity Central Funds" note found in the Notes to Financial
Statements section of the most recent Annual or Semi-Annual
report.
HExpense
ratios reflect operating expenses of the class. Expenses before reductions do
not reflect amounts reimbursed, waived, or reduced through arrangements with the
investment adviser, brokerage services, or other offset arrangements, if
applicable, and do not represent the amount paid by the class during periods
when reimbursements, waivers or reductions occur.
IAmount
does not include the portfolio activity of any underlying mutual funds or
exchange-traded funds (ETFs).
JPortfolio
turnover rate excludes securities received or delivered
in-kind.
|
Fidelity®
Series Emerging Markets Opportunities Fund |
|
|
|
Years
ended October 31, |
|
2023
|
|
2022 |
|
2021 |
|
2020 |
|
2019 |
|
Selected
Per-Share Data |
|
|
|
|
|
|
|
|
|
|
|
Net
asset value, beginning of period |
$ |
14.17 |
$ |
24.69 |
$ |
21.49 |
$ |
19.39 |
$ |
17.66 |
|
Income
from Investment Operations |
|
|
|
|
|
|
|
|
|
|
|
Net
investment income (loss) A,B |
|
.46
|
|
.48
|
|
.47
|
|
.35
|
|
.57
C |
|
Net
realized and unrealized gain (loss) |
|
1.58
|
|
(8.30)
|
|
3.48
|
|
2.26
|
|
2.71
|
|
Total
from investment operations |
|
2.04
|
|
(7.82)
|
|
3.95
|
|
2.61
|
|
3.28
|
|
Distributions
from net investment income |
|
(.37)
|
|
(.68)
|
|
(.33)
|
|
(.50)
|
|
(.41)
|
|
Distributions
from net realized gain |
|
-
|
|
(2.01)
|
|
(.41)
|
|
(.02)
|
|
(1.14)
|
|
Total
distributions |
|
(.37)
|
|
(2.70)
D |
|
(.75)
D |
|
(.51)
D |
|
(1.55)
|
|
Net
asset value, end of period |
$ |
15.84 |
$ |
14.17 |
$ |
24.69 |
$ |
21.49 |
$ |
19.39 |
|
Total
Return E |
|
14.40%
|
|
(35.33)%
|
|
18.44%
|
|
13.66%
|
|
20.13%
|
|
Ratios
to Average Net Assets B,F,G |
|
|
|
|
|
|
|
|
|
|
|
Expenses
before reductions |
|
.03%
|
|
.03%
|
|
.03%
|
|
.04%
|
|
.04%
|
|
Expenses
net of fee waivers, if any |
|
.01%
|
|
.01%
|
|
.01%
|
|
.01%
|
|
.01%
|
|
Expenses
net of all reductions |
|
.01%
|
|
.01%
|
|
.01%
|
|
.01%
|
|
.01%
|
|
Net
investment income (loss) |
|
2.82%
|
|
2.64%
|
|
1.82%
|
|
1.78%
|
|
3.12%
C |
|
Supplemental
Data |
|
|
|
|
|
|
|
|
|
|
|
Net
assets, end of period (000 omitted) |
$ |
20,165,712 |
$ |
22,330,277 |
$ |
29,188,538 |
$ |
26,829,783 |
$ |
18,675,048 |
|
Portfolio
turnover rate H |
|
41%
|
|
37%
|
|
69%
|
|
42%
I |
|
54%
|
ACalculated
based on average shares outstanding during the period.
BNet
investment income (loss) is affected by the timing of the declaration of
dividends by any underlying mutual funds or exchange-traded funds (ETFs). Net
investment income (loss) of any mutual funds or ETFs is not included in the
Fund's net investment income (loss) ratio.
CNet
investment income per share reflects one or more large, non-recurring
dividend(s) which amounted to $.15 per share. Excluding such non-recurring
dividend(s), the ratio of net investment income (loss) to average net assets
would have been 2.29%.
DTotal
distributions per share do not sum due to rounding.
ETotal
returns would have been lower if certain expenses had not been reduced during
the applicable periods shown.
FFees
and expenses of any underlying mutual funds or exchange-traded funds (ETFs) are
not included in the Fund's expense ratio. The Fund indirectly bears its
proportionate share of these expenses. For additional expense information
related to investments in Fidelity Central Funds, please refer to the
"Investments in Fidelity Central Funds" note found in the Notes to Financial
Statements section of the most recent Annual or Semi-Annual
report.
GExpense
ratios reflect operating expenses of the class. Expenses before reductions do
not reflect amounts reimbursed, waived, or reduced through arrangements with the
investment adviser, brokerage services, or other offset arrangements, if
applicable, and do not represent the amount paid by the class during periods
when reimbursements, waivers or reductions occur.
HAmount
does not include the portfolio activity of any underlying mutual funds or
exchange-traded funds (ETFs).
IPortfolio
turnover rate excludes securities received or delivered
in-kind.
|
Fidelity®
Series International Growth Fund |
|
|
|
Years
ended October 31, |
|
2023
|
|
2022 |
|
2021 |
|
2020 |
|
2019 |
|
Selected
Per-Share Data |
|
|
|
|
|
|
|
|
|
|
|
Net
asset value, beginning of period |
$ |
13.75 |
$ |
20.51 |
$ |
18.01 |
$ |
17.07 |
$ |
14.96 |
|
Income
from Investment Operations |
|
|
|
|
|
|
|
|
|
|
|
Net
investment income (loss) A,B |
|
.22
|
|
.21
|
|
.20
|
|
.20
|
|
.37
C |
|
Net
realized and unrealized gain (loss) |
|
1.33
|
|
(5.38)
|
|
5.19
|
|
1.38
|
|
2.74
|
|
Total
from investment operations |
|
1.55
|
|
(5.17)
|
|
5.39
|
|
1.58
|
|
3.11
|
|
Distributions
from net investment income |
|
(.20)
|
|
(.28)
|
|
(.24)
|
|
(.37)
|
|
(.28)
|
|
Distributions
from net realized gain |
|
(.30)
|
|
(1.31)
|
|
(2.65)
|
|
(.27)
|
|
(.72)
|
|
Total
distributions |
|
(.50)
|
|
(1.59)
|
|
(2.89)
|
|
(.64)
|
|
(1.00)
|
|
Net
asset value, end of period |
$ |
14.80 |
$ |
13.75 |
$ |
20.51 |
$ |
18.01 |
$ |
17.07 |
|
Total
Return D |
|
11.31%
|
|
(27.31)%
|
|
33.10%
|
|
9.39%
|
|
22.58%
|
|
Ratios
to Average Net Assets B,E,F |
|
|
|
|
|
|
|
|
|
|
|
Expenses
before reductions |
|
.01%
|
|
.01%
|
|
.01%
|
|
.01%
|
|
.01%
|
|
Expenses
net of fee waivers, if any |
|
.01%
|
|
.01%
|
|
.01%
|
|
.01%
|
|
.01%
|
|
Expenses
net of all reductions |
|
.01%
|
|
.01%
|
|
.01%
|
|
.01%
|
|
.01%
|
|
Net
investment income (loss) |
|
1.42%
|
|
1.32%
|
|
1.06%
|
|
1.18%
|
|
2.38%
C |
|
Supplemental
Data |
|
|
|
|
|
|
|
|
|
|
|
Net
assets, end of period (000 omitted) |
$ |
12,848,087 |
$ |
12,392,171 |
$ |
15,467,124 |
$ |
11,557,995 |
$ |
16,501,791 |
|
Portfolio
turnover rate G |
|
19%
H |
|
22%
H |
|
24%
|
|
16%
H |
|
24%
|
ACalculated
based on average shares outstanding during the period.
BNet
investment income (loss) is affected by the timing of the declaration of
dividends by any underlying mutual funds or exchange-traded funds (ETFs). Net
investment income (loss) of any mutual funds or ETFs is not included in the
Fund's net investment income (loss) ratio.
CNet
investment income per share reflects one or more large, non-recurring
dividend(s) which amounted to $.07 per share. Excluding such non-recurring
dividend(s), the ratio of net investment income (loss) to average net assets
would have been 1.92%.
DTotal
returns would have been lower if certain expenses had not been reduced during
the applicable periods shown.
EFees
and expenses of any underlying mutual funds or exchange-traded funds (ETFs) are
not included in the Fund's expense ratio. The Fund indirectly bears its
proportionate share of these expenses. For additional expense information
related to investments in Fidelity Central Funds, please refer to the
"Investments in Fidelity Central Funds" note found in the Notes to Financial
Statements section of the most recent Annual or Semi-Annual
report.
FExpense
ratios reflect operating expenses of the class. Expenses before reductions do
not reflect amounts reimbursed, waived, or reduced through arrangements with the
investment adviser, brokerage services, or other offset arrangements, if
applicable, and do not represent the amount paid by the class during periods
when reimbursements, waivers or reductions occur.
GAmount
does not include the portfolio activity of any underlying mutual funds or
exchange-traded funds (ETFs).
HPortfolio
turnover rate excludes securities received or delivered
in-kind.
|
Fidelity®
Series International Small Cap Fund |
|
|
|
Years
ended October 31, |
|
2023
|
|
2022 |
|
2021 |
|
2020 |
|
2019 |
|
Selected
Per-Share Data |
|
|
|
|
|
|
|
|
|
|
|
Net
asset value, beginning of period |
$ |
14.48 |
$ |
24.12 |
$ |
17.55 |
$ |
16.71 |
$ |
16.43 |
|
Income
from Investment Operations |
|
|
|
|
|
|
|
|
|
|
|
Net
investment income (loss) A,B |
|
.32
|
|
.35
|
|
.29
|
|
.22
|
|
.36
|
|
Net
realized and unrealized gain (loss) |
|
.67
|
|
(7.16)
|
|
6.45
|
|
1.36
|
|
1.47
|
|
Total
from investment operations |
|
.99
|
|
(6.81)
|
|
6.74
|
|
1.58
|
|
1.83
|
|
Distributions
from net investment income |
|
(.21)
|
|
(.47)
|
|
(.17)
|
|
(.36)
|
|
(.37)
|
|
Distributions
from net realized gain |
|
(.73)
|
|
(2.35)
|
|
-
|
|
(.38)
|
|
(1.18)
|
|
Total
distributions |
|
(.95)
C |
|
(2.83)
C |
|
(.17)
|
|
(.74)
|
|
(1.55)
|
|
Net
asset value, end of period |
$ |
14.52 |
$ |
14.48 |
$ |
24.12 |
$ |
17.55 |
$ |
16.71 |
|
Total
Return D |
|
6.57%
|
|
(31.82)%
|
|
38.60%
|
|
9.60%
|
|
12.77%
|
|
Ratios
to Average Net Assets B,E,F |
|
|
|
|
|
|
|
|
|
|
|
Expenses
before reductions |
|
.01%
|
|
.01%
|
|
.01%
|
|
.01%
|
|
.01%
|
|
Expenses
net of fee waivers, if any |
|
.01%
|
|
.01%
|
|
.01%
|
|
.01%
|
|
.01%
|
|
Expenses
net of all reductions |
|
.01%
|
|
.01%
|
|
.01%
|
|
.01%
|
|
.01%
|
|
Net
investment income (loss) |
|
2.02%
|
|
2.03%
|
|
1.34%
|
|
1.36%
|
|
2.28%
|
|
Supplemental
Data |
|
|
|
|
|
|
|
|
|
|
|
Net
assets, end of period (000 omitted) |
$ |
3,418,303 |
$ |
3,246,258 |
$ |
4,847,936 |
$ |
3,653,041 |
$ |
3,498,064 |
|
Portfolio
turnover rate G |
|
26%
|
|
25%
|
|
32%
|
|
24%
H |
|
23%
|
ACalculated
based on average shares outstanding during the period.
BNet
investment income (loss) is affected by the timing of the declaration of
dividends by any underlying mutual funds or exchange-traded funds (ETFs). Net
investment income (loss) of any mutual funds or ETFs is not included in the
Fund's net investment income (loss) ratio.
CTotal
distributions per share do not sum due to rounding.
DTotal
returns would have been lower if certain expenses had not been reduced during
the applicable periods shown.
EFees
and expenses of any underlying mutual funds or exchange-traded funds (ETFs) are
not included in the Fund's expense ratio. The Fund indirectly bears its
proportionate share of these expenses. For additional expense information
related to investments in Fidelity Central Funds, please refer to the
"Investments in Fidelity Central Funds" note found in the Notes to Financial
Statements section of the most recent Annual or Semi-Annual
report.
FExpense
ratios reflect operating expenses of the class. Expenses before reductions do
not reflect amounts reimbursed, waived, or reduced through arrangements with the
investment adviser, brokerage services, or other offset arrangements, if
applicable, and do not represent the amount paid by the class during periods
when reimbursements, waivers or reductions occur.
GAmount
does not include the portfolio activity of any underlying mutual funds or
exchange-traded funds (ETFs).
HPortfolio
turnover rate excludes securities received or delivered
in-kind.
|
Fidelity®
Series International Value Fund |
|
|
|
Years
ended October 31, |
|
2023
|
|
2022 |
|
2021 |
|
2020 |
|
2019 |
|
Selected
Per-Share Data |
|
|
|
|
|
|
|
|
|
|
|
Net
asset value, beginning of period |
$ |
9.24 |
$ |
11.62 |
$ |
8.25 |
$ |
9.82 |
$ |
9.68 |
|
Income
from Investment Operations |
|
|
|
|
|
|
|
|
|
|
|
Net
investment income (loss) A,B |
|
.37
|
|
.42
|
|
.43
C |
|
.26
|
|
.39
|
|
Net
realized and unrealized gain (loss) |
|
1.36
|
|
(2.24)
|
|
3.23
|
|
(1.43)
|
|
.10
|
|
Total
from investment operations |
|
1.73
|
|
(1.82)
|
|
3.66
|
|
(1.17)
|
|
.49
|
|
Distributions
from net investment income |
|
(.33)
|
|
(.56)
|
|
(.29)
|
|
(.36)
|
|
(.35)
|
|
Distributions
from net realized gain |
|
-
|
|
-
|
|
-
|
|
(.04)
|
|
-
|
|
Total
distributions |
|
(.33)
|
|
(.56)
|
|
(.29)
|
|
(.40)
|
|
(.35)
|
|
Net
asset value, end of period |
$ |
10.64 |
$ |
9.24 |
$ |
11.62 |
$ |
8.25 |
$ |
9.82 |
|
Total
Return D |
|
18.99%
|
|
(16.40)%
|
|
44.95%
|
|
(12.55)%
|
|
5.48%
|
|
Ratios
to Average Net Assets B,E,F |
|
|
|
|
|
|
|
|
|
|
|
Expenses
before reductions |
|
.01%
|
|
.01%
|
|
.01%
|
|
.01%
|
|
.01%
|
|
Expenses
net of fee waivers, if any |
|
.01%
|
|
.01%
|
|
.01%
|
|
.01%
|
|
.01%
|
|
Expenses
net of all reductions |
|
.01%
|
|
.01%
|
|
.01%
|
|
.01%
|
|
.01%
|
|
Net
investment income (loss) |
|
3.42%
|
|
4.09%
|
|
3.97%
C |
|
2.92%
|
|
4.23%
|
|
Supplemental
Data |
|
|
|
|
|
|
|
|
|
|
|
Net
assets, end of period (000 omitted) |
$ |
12,786,763 |
$ |
12,367,978 |
$ |
15,330,482 |
$ |
11,605,710 |
$ |
15,992,396 |
|
Portfolio
turnover rate G |
|
30%
H |
|
31%
H |
|
34%
|
|
36%
H |
|
41%
|
ACalculated
based on average shares outstanding during the period.
BNet
investment income (loss) is affected by the timing of the declaration of
dividends by any underlying mutual funds or exchange-traded funds (ETFs). Net
investment income (loss) of any mutual funds or ETFs is not included in the
Fund's net investment income (loss) ratio.
CNet
investment income per share reflects one or more large, non-recurring
dividend(s) which amounted to $.11 per share. Excluding such non-recurring
dividend(s), the ratio of net investment income (loss) to average net assets
would have been 3.00%.
DTotal
returns would have been lower if certain expenses had not been reduced during
the applicable periods shown.
EFees
and expenses of any underlying mutual funds or exchange-traded funds (ETFs) are
not included in the Fund's expense ratio. The Fund indirectly bears its
proportionate share of these expenses. For additional expense information
related to investments in Fidelity Central Funds, please refer to the
"Investments in Fidelity Central Funds" note found in the Notes to Financial
Statements section of the most recent Annual or Semi-Annual
report.
FExpense
ratios reflect operating expenses of the class. Expenses before reductions do
not reflect amounts reimbursed, waived, or reduced through arrangements with the
investment adviser, brokerage services, or other offset arrangements, if
applicable, and do not represent the amount paid by the class during periods
when reimbursements, waivers or reductions occur.
GAmount
does not include the portfolio activity of any underlying mutual funds or
exchange-traded funds (ETFs).
HPortfolio
turnover rate excludes securities received or delivered
in-kind.
Additional
Index Information
MSCI
ACWI (All Country World Index) ex USA Small Cap Index
is a market capitalization-weighted index designed to measure the investable
equity market performance for global investors of small cap stocks in developed
and emerging markets, excluding the United States. Index returns for periods
after April 1, 2014 are adjusted for tax withholding rates applicable to U.S.
based mutual funds organized as Massachusetts business trusts.
MSCI
EAFE Growth Index is
a market capitalization-weighted index that is designed to measure the
investable equity market performance of growth stocks for global investors of
developed markets, excluding the U.S. & Canada. Index returns are adjusted
for tax withholding rates applicable to U.S. based mutual funds organized as
Massachusetts business trusts.
MSCI
EAFE Small Cap Index is
a market capitalization-weighted index that is designed to measure the
investable equity market performance of small cap stocks for global investors of
developed markets, excluding the U.S. & Canada. Index returns are adjusted
for tax withholding rates applicable to U.S. based mutual funds organized as
Massachusetts business trusts.
MSCI
EAFE Value Index
is a market capitalization-weighted index that is designed to measure the
investable equity market performance of value stocks for global investors of
developed markets, excluding the U.S. & Canada. Index returns are adjusted
for tax withholding rates applicable to U.S. based mutual funds organized as
Massachusetts business trusts.
MSCI
Emerging Markets Index
is a market capitalization-weighted index that is designed to measure the
investable equity market performance for global investors in emerging markets.
Index returns are adjusted for tax withholding rates applicable to U.S. based
mutual funds organized as Massachusetts business trusts.
|
IMPORTANT
INFORMATION ABOUT OPENING A NEW ACCOUNT |
|
To
help the government fight the funding of terrorism and money laundering
activities, the Uniting and Strengthening America by Providing Appropriate
Tools Required to Intercept and Obstruct Terrorism Act of 2001 (USA
PATRIOT ACT), requires all financial institutions to obtain, verify, and
record information that identifies each person or entity that opens an
account.
For
investors other than individuals:
When you open an account, you will be asked for the name of the entity,
its principal place of business and taxpayer identification number (TIN).
You will be asked to provide information about the entity's control person
and beneficial owners, and person(s) with authority over the account,
including name, address, date of birth and social security number. You may
also be asked to provide documents, such as drivers' licenses, articles of
incorporation, trust instruments or partnership agreements and other
information that will help Fidelity identify the
entity. |
You
can obtain additional information about the funds. A description of each fund's
policies and procedures for disclosing its holdings is available in its
Statement of Additional Information (SAI) and on Fidelity's web sites. The SAI
also includes more detailed information about each fund and its investments. The
SAI is incorporated herein by reference (legally forms a part of the
prospectus). Each fund's annual and semi-annual reports also include additional
information. Each fund's annual report includes a discussion of the fund's
holdings and recent market conditions and the fund's investment strategies that
affected performance.
For
a free copy of any of these documents or to request other information or ask
questions about a fund, call Fidelity at 1-800-544-8544. In addition, you may
visit Fidelity's web site at www.fidelity.com for a free copy of a prospectus,
SAI, or annual or semi-annual report or to request other
information.
The
SAI, the funds' annual and semi-annual reports and other related materials
are available from the Electronic Data Gathering, Analysis, and Retrieval
(EDGAR) Database on the SEC's web site (http://www.sec.gov). You can
obtain copies of this information, after paying a duplicating fee, by
sending a request by e-mail to [email protected] or by writing the Public
Reference Section of the SEC, Washington, D.C. 20549-1520. You can also
review and copy information about the funds, including the funds' SAI, at
the SEC's Public Reference Room in Washington, D.C. Call 1-202-551-8090
for information on the operation of the SEC's Public Reference
Room. |
|
Investment
Company Act of 1940, File Number(s), 811-04008 |
Fidelity
Distributors Company LLC (FDC) is a member of the Securities Investor Protection
Corporation (SIPC). You may obtain information about SIPC, including the SIPC
brochure, by visiting www.sipc.org or calling SIPC at 202-371-8300.
Fidelity,
the Fidelity Investments Logo and all other Fidelity trademarks or service marks
used herein are trademarks or service marks of FMR LLC. Any third-party marks
that are used herein are trademarks or service marks of their respective owners.
© 2023 FMR LLC. All rights reserved.
|
1.901077.117 |
GSV-S-PRO-1223 |