
Direxion
Funds
Prospectus
|
1301
Avenue of the Americas (6th Avenue), 28th Floor |
New
York, New York 10019 |
(800)
851-0511 |
www.direxion.com
|
Bull
Funds |
Bear
Fund |
|
Direxion Monthly S&P
500® Bull 1.75X Fund
(DXSLX) |
|
|
Direxion Monthly
NASDAQ-100® Bull 1.75X Fund
(DXQLX) |
|
|
Direxion Monthly Small Cap
Bull 1.75X Fund (DXRLX) |
|
|
Direxion Monthly 7-10 Year
Treasury Bull 1.75X Fund (DXKLX) |
Direxion Monthly 7-10 Year
Treasury Bear 1.75X Fund
(DXKSX) |
Investor
Class
The
funds offered in this Prospectus (each a “Fund” and collectively the “Funds”)
seek
calendar month leveraged investment
results and are riskier than most mutual funds because the Funds seek 1.75 times
the calendar month performance of a respective underlying index. The Funds with
“Bull” in their names attempt to provide calendar month investment results that
correspond to 1.75 times the calendar month performance of an underlying index
and are collectively referred to as the “Bull Funds.” The Fund with “Bear” in
its name attempts to provide calendar month investment results that correspond
to 1.75 times the inverse (or opposite) of the performance of an underlying
index, a result that is the opposite of most mutual funds, and is referred to as
the “Bear Fund.”
The
Funds are not suitable for all investors. The Funds are designed to be utilized
only by sophisticated investors, such as traders and active
investors employing dynamic strategies. Investors in the Funds
should:
(a)
understand
the risks associated with the use of leverage,
(b)
understand
the consequences of seeking calendar month leveraged investment
results,
(c)
for the Bear
Fund, understand the risk of shorting, and
(d)
intend to
actively monitor and manage their investments.
Investors
who do not understand the Funds or do not intend to actively manage and monitor
their investments should not buy the Funds.
There
is no assurance that any Fund will achieve its investment objective and an
investment in a Fund could lose money. No single Fund
is a complete investment program.
An
investor who purchases shares on a day other than the last business day of a
calendar month will generally receive more, or less, than 175% (for
a Bull Fund) or -175% (for the Bear Fund) exposure to the underlying index from
that point until the end of the month. The actual exposure is a function of the
performance of the underlying index from the end of the prior calendar month to
an investor’s purchase date. If a Fund’s shares are held for a period other than
a calendar month, the Fund’s performance is likely to deviate from 175% (for a
Bull Fund) or -175% (for the Bear Fund) of the underlying index’s performance
for the period the Fund is held. This deviation will increase with higher
underlying index volatility and longer holding periods.
These
securities have not been approved or disapproved by the U.S. Securities and
Exchange Commission (“SEC”) or the U.S. Commodity Futures
Trading Commission (“CFTC”), nor have the SEC or CFTC passed upon the adequacy
of this Prospectus. Any representation to the contrary is a criminal
offense.
December 29,
2023
Summary
Section
Important
Information Regarding the Fund
The Direxion
Monthly S&P 500® Bull 1.75X Fund (the “Fund”)
seeks calendar
month leveraged (1.75X) investment results and is very
different from most other mutual funds. As a result, the Fund may be riskier
than alternatives that do not use leverage because the Fund’s objective is to
magnify the monthly performance of the S&P 500® Index (the "Index"). The return
for investors that invest for periods longer or shorter than a full calendar
month, which is defined as the period from the end of the last business day of
one calendar month through the close of trading on the last business day of the
following calendar month, should not be expected to be 175% of the performance
of the Index for the period. The return of the Fund for a period longer than a
full calendar month will be the result of each full calendar month’s compounded
return over the period, which will very likely differ from 175% of the return of
the Index for that period. Longer holding periods, higher volatility of the
Index and leverage increase the impact of compounding on an investor’s returns.
During periods of higher Index volatility, the volatility of the Index may
affect the Fund’s return as much as, or more than, the return of the
Index.
The
Fund is not suitable for all investors. The Fund is designed to
be utilized only by knowledgeable investors who understand the potential
consequences of seeking calendar month leveraged (1.75X) investment results,
understand the risks associated with the use of leverage and are willing to
monitor their portfolios frequently. The Fund is not intended to be used by, and
is not appropriate for, investors who do not intend to actively monitor and
manage their portfolios. For periods longer than a calendar month, the Fund will
lose money if the Index’s performance is flat, and it is possible that the Fund
will lose money even if the Index’s performance increases. An investor could
lose the full principal value of his/her investment within a calendar month if
the Index loses more than 58% in one month.
|
Management
Fees |
|
|
Distribution
and/or Service (12b-1) Fees |
|
|
Other
Expenses of the Fund |
|
|
Acquired
Fund Fees and Expenses(1) |
|
|
Total
Annual Fund Operating Expenses |
|
|
Expense
Cap/Reimbursement(2) |
- |
|
Total
Annual Fund Operating Expenses After
Expense
Cap/Reimbursement |
|
(1)
(2)
|
|
1 Year |
3
Years |
5
Years |
10
Years |
|
|
$ |
$ |
$ |
$1,792 |
1
Direxion
Funds Prospectus
Direxion
Funds Prospectus
2
|
|
|
| ||||
|
|
|
|
|
|
|
|
|
|
|
|
|
|
|
|
|
|
|
|
|
|
|
|
|
|
|
|
|
|
|
|
|
|
|
|
|
|
|
|
|
|
|
|
|
|
|
|
|
|
|
|
|
|
|
|
|
|
|
|
|
|
|
|
|
|
|
|
|
|
|
|
|
|
|
|
|
|
|
|
|
|
|
|
|
|
|
|
|
|
|
|
|
|
|
|
|
|
|
|
|
|
|
|
|
|
|
|
|
|
|
|
3
Direxion
Funds Prospectus
Direxion
Funds Prospectus
4
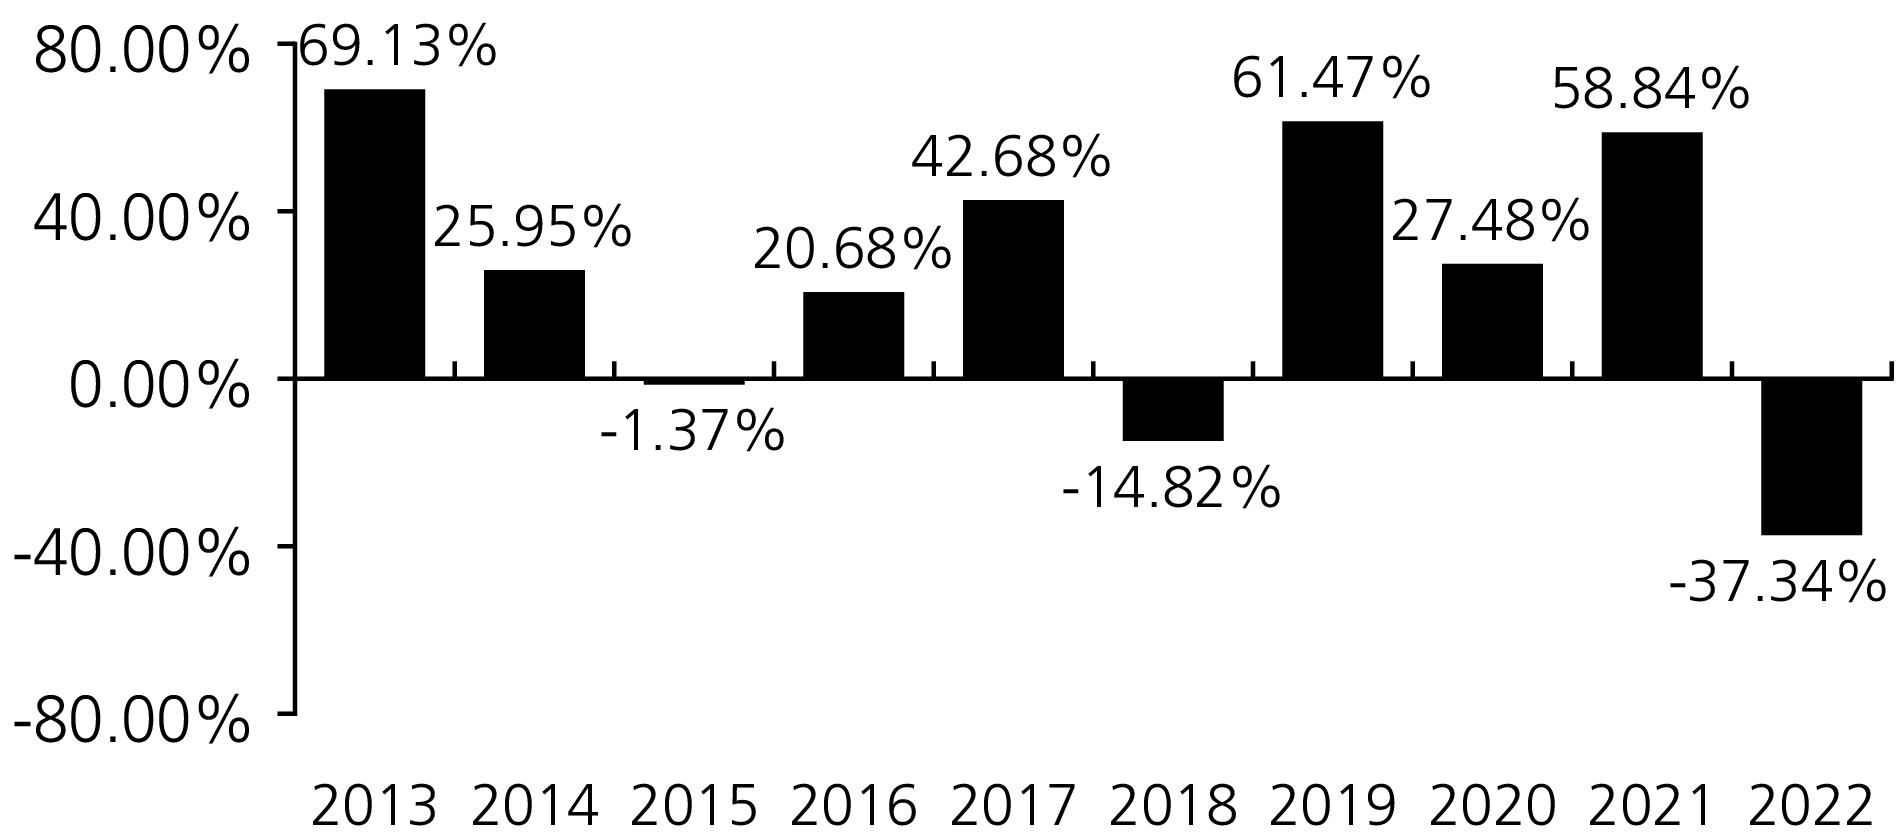
5
Direxion
Funds Prospectus
|
|
1 Year |
5
Years |
10
Years |
|
Investor
Class |
|
|
|
|
Return
Before Taxes |
-37.34% |
11.78% |
20.23% |
|
Return
After Taxes on
Distributions |
-37.34% |
9.84% |
18.09% |
|
Return
After Taxes on
Distributions
and Sale of
Fund
Shares |
-22.11% |
8.52% |
16.18% |
|
S&P
500®
Index (reflects
no
deduction
for fees,
expenses
or taxes) |
-18.11% |
9.42% |
12.56% |
Direxion
Funds Prospectus
6
Management
Investment
Adviser. Rafferty Asset
Management, LLC
is
the Fund’s investment adviser.
Portfolio
Managers. The following
members of Rafferty’s investment team are jointly and primarily responsible for
the day-to-day management of the Fund:
|
Portfolio
Managers |
Years of
Service
with the
Fund |
Primary
Title |
|
Paul
Brigandi |
Since
Inception in
May
2006 |
Portfolio
Manager |
|
Tony
Ng |
Since
Inception in
May
2006 |
Portfolio
Manager |
Purchase
and Sale of Fund Shares
You
may purchase or redeem Fund shares on any business day by written
request via mail (Direxion Funds –
Direxion Monthly S&P
500® Bull 1.75X Fund,
P.O. Box 701, Milwaukee, Wisconsin 53201-0701), by wire transfer, by telephone
at (800) 851-0511, or through a financial intermediary. Purchases and
redemptions by telephone are only permitted if you previously established these
options on your account. The Fund accepts investments in the following minimum
amounts:
|
Purchase
Methods |
Initial
Purchases |
Subsequent
Purchases |
|
Minimum
Investment:
Traditional
Investment
Accounts |
$25,000 or a
lesser
amount if
you are a
client of a
securities
dealer, bank
or other
financial
institution. |
$500 |
|
Minimum
Investment:
Retirement
Accounts
(Traditional,
Roth
and
Spousal
individual
retirement
accounts) |
$25,000 or a
lesser
amount if
you are a
client of a
securities
dealer, bank
or other
financial
institution. |
$500 |
Tax
Information
The
Fund’s distributions to you are taxable, and will be taxed as ordinary
income or capital gains, unless you are investing through a tax-deferred
arrangement, such as a 401(k) plan or an individual retirement account.
Distributions on investments made through those arrangements may be taxed later
upon withdrawal of assets from them. The Fund intends to distribute income, if
any, and capital gains, if any, at least annually.
Payments
to Broker-Dealers and Other Financial Intermediaries
If
you purchase shares of the Fund through a broker-dealer or other
financial intermediary (such as a bank or financial adviser), the Fund and/or
its Adviser may pay the intermediary for the sale of Fund shares and related
services. These payments may create a conflict of interest by influencing the
broker-dealer or other financial intermediary and your salesperson to recommend
the Fund over another investment. Ask your salesperson or visit your financial
intermediary’s website for more information.
Index
Information
The “S&P
500® Index” is a product of S&P
Dow Jones Indices LLC (“SPDJI”), and has been licensed for use by Rafferty.
Standard & Poor’s® and S&P® are registered trademarks of
Standard & Poor’s Financial Services LLC (“S&P”); Dow Jones® is a registered trademark of Dow
Jones Trademark Holdings LLC (“Dow Jones”); and these trademarks have been
licensed for use by SPDJI and sublicensed for certain purposes by Rafferty. The
Fund is not sponsored, endorsed, sold or promoted by SPDJI, Dow Jones, S&P,
or their respective affiliates and none of such parties make any representation
regarding the advisability of investing in such product(s) nor do they have any
liability for any errors, omissions, or interruptions of the S&P
500® Index.
7
Direxion
Funds Prospectus
Important
Information Regarding the Fund
The Direxion
Monthly NASDAQ-100® Bull 1.75X Fund (the “Fund”)
seeks calendar
month leveraged (1.75X) investment results and is very
different from most other mutual funds. As a result, the Fund may be riskier
than alternatives that do not use leverage because the Fund’s objective is to
magnify the monthly performance of the NASDAQ-100® Index (the "Index"). The return
for investors that invest for periods longer or shorter than a full calendar
month, which is defined as the period from the end of the last business day of
one calendar month through the close of trading on the last business day of the
following calendar month, should not be expected to be 175% of the performance
of the Index for the period. The return of the Fund for a period longer than a
full calendar month will be the result of each full calendar month’s compounded
return over the period, which will very likely differ from 175% of the return of
the Index for that period. Longer holding periods, higher volatility of the
Index and leverage increase the impact of compounding on an investor’s returns.
During periods of higher Index volatility, the volatility of the Index may
affect the Fund’s return as much as, or more than, the return of the
Index.
The
Fund is not suitable for all investors. The Fund is designed to
be utilized only by knowledgeable investors who understand the potential
consequences of seeking calendar month leveraged (1.75X) investment results,
understand the risks associated with the use of leverage and are willing to
monitor their portfolios frequently. The Fund is not intended to be used by, and
is not appropriate for, investors who do not intend to actively monitor and
manage their portfolios. For periods longer than a calendar month, the Fund will
lose money if the Index’s performance is flat, and it is possible that the Fund
will lose money even if the Index’s performance increases. An investor could
lose the full principal value of his/her investment within a calendar month if
the Index loses more than 58% in one month.
|
Management
Fees |
|
|
Distribution
and/or Service (12b-1) Fees |
|
|
Other
Expenses of the Fund |
|
|
Acquired
Fund Fees and Expenses(1) |
|
|
Total
Annual Fund Operating Expenses |
|
|
Expense
Cap/Reimbursement(2) |
- |
|
Total
Annual Fund Operating Expenses After
Expense
Cap/Reimbursement |
|
(1)
(2)
|
|
1 Year |
3
Years |
5
Years |
10
Years |
|
|
$ |
$ |
$ |
$1,787 |
Direxion
Funds Prospectus
8
9
Direxion
Funds Prospectus
|
|
|
| ||||
|
|
|
|
|
|
|
|
|
|
|
|
|
|
|
|
|
|
|
|
|
|
|
|
|
|
|
|
|
|
|
|
|
|
|
|
|
|
|
|
|
|
|
|
|
|
|
|
|
|
|
|
|
|
|
|
|
|
|
|
|
|
|
|
|
|
|
|
|
|
|
|
|
|
|
|
|
|
|
|
|
|
|
|
|
|
|
|
|
|
|
|
|
|
|
|
|
|
|
|
|
|
|
|
|
|
|
|
|
|
|
|
Direxion
Funds Prospectus
10
11
Direxion
Funds Prospectus
Direxion
Funds Prospectus
12
13
Direxion
Funds Prospectus

|
|
1 Year |
5
Years |
10
Years |
|
Investor
Class |
|
|
|
|
Return
Before Taxes |
-57.72% |
16.96% |
27.78% |
|
Return
After Taxes on
Distributions |
-57.72% |
13.95% |
25.65% |
|
Return
After Taxes on
Distributions
and Sale of
Fund
Shares |
-34.17% |
12.88% |
23.77% |
|
NASDAQ-100®
Index (reflects
no
deduction for fees,
expenses
or taxes) |
-32.38% |
12.36% |
16.45% |
Management
Investment
Adviser. Rafferty Asset
Management, LLC
is
the Fund’s investment adviser.
Portfolio
Managers. The following
members of Rafferty’s investment team are jointly and primarily responsible for
the day-to-day management of the Fund:
|
Portfolio
Managers |
Years of
Service
with the
Fund |
Primary
Title |
|
Paul
Brigandi |
Since
Inception in
May
2006 |
Portfolio
Manager |
|
Tony
Ng |
Since
Inception in
May
2006 |
Portfolio
Manager |
Purchase
and Sale of Fund Shares
You
may purchase or redeem Fund shares on any business day by written
request via mail (Direxion Funds –
Direxion Monthly
NASDAQ-100® Bull 1.75X Fund,
P.O. Box 701, Milwaukee, Wisconsin 53201-0701), by wire transfer, by telephone
at (800) 851-0511, or through a financial intermediary. Purchases and
redemptions by telephone are only permitted if you previously established these
options on your account. The Fund accepts investments in the following minimum
amounts:
|
Purchase
Methods |
Initial
Purchases |
Subsequent
Purchases |
|
Minimum
Investment:
Traditional
Investment
Accounts |
$25,000 or a
lesser
amount if
you are a
client of a
securities
dealer, bank
or other
financial
institution. |
$500 |
|
Minimum
Investment:
Retirement
Accounts
(Traditional,
Roth
and
Spousal
individual
retirement
accounts) |
$25,000 or a
lesser
amount if
you are a
client of a
securities
dealer, bank
or other
financial
institution. |
$500 |
Tax
Information
The
Fund’s distributions to you are taxable, and will be taxed as ordinary
income or capital gains, unless you are investing through a tax-deferred
arrangement, such as a 401(k) plan or an individual retirement account.
Distributions on investments made through those arrangements may be taxed later
upon withdrawal of assets from them. The Fund intends to distribute income, if
any, and capital gains, if any, at least annually.
Payments
to Broker-Dealers and Other Financial Intermediaries
If
you purchase shares of the Fund through a broker-dealer or other
financial intermediary (such as a bank or financial adviser), the Fund and/or
its Adviser may pay the intermediary for the sale of Fund shares and related
services. These payments may create a conflict of interest by influencing the
broker-dealer or other financial intermediary and your salesperson to recommend
the Fund over another investment. Ask your salesperson or visit your financial
intermediary’s website for more information.
Direxion
Funds Prospectus
14
Index
Information
Nasdaq®,
Nasdaq-100®, and Nasdaq-100
Index®, are trademarks
of The Nasdaq Stock Market, Inc. (which with its affiliates is referred to as
the “Corporations”) and are licensed for use by Direxion Funds. The Fund has not
been passed on by the Corporations as to its legality or suitability. The Fund
is not issued, endorsed, sold, or promoted by the Corporations. THE CORPORATIONS
MAKE NO WARRANTIES AND BEAR NO LIABILITY WITH RESPECT TO THE
FUND.
15
Direxion
Funds Prospectus
Important
Information Regarding the Fund
The Direxion
Monthly Small Cap Bull 1.75X Fund (the “Fund”) seeks calendar
month leveraged (1.75X) investment results and is very
different from most other mutual funds. As a result, the Fund may be riskier
than alternatives that do not use leverage because the Fund’s objective is to
magnify the monthly performance of the Russell 2000® Index (the "Index"). The return
for investors that invest for periods longer or shorter than a full calendar
month, which is defined as the period from the end of the last business day of
one calendar month through the close of trading on the last business day of the
following calendar month, should not be expected to be 175% of the performance
of the Index for the period. The return of the Fund for a period longer than a
full calendar month will be the result of each full calendar month’s compounded
return over the period, which will very likely differ from 175% of the return of
the Index for that period. Longer holding periods, higher volatility of the
Index and leverage increase the impact of compounding on an investor’s returns.
During periods of higher Index volatility, the volatility of the Index may
affect the Fund’s return as much as, or more than, the return of the
Index.
The
Fund is not suitable for all investors. The Fund is designed to
be utilized only by knowledgeable investors who understand the potential
consequences of seeking calendar month leveraged (1.75X) investment results,
understand the risks associated with the use of leverage and are willing to
monitor their portfolios frequently. The Fund is not intended to be used by, and
is not appropriate for, investors who do not intend to actively monitor and
manage their portfolios. For periods longer than a calendar month, the Fund will
lose money if the Index’s performance is flat, and it is possible that the Fund
will lose money even if the Index’s performance increases. An investor could
lose the full principal value of his/her investment within a calendar month if
the Index loses more than 58% in one month.
|
Management
Fees |
|
|
Distribution
and/or Service (12b-1) Fees |
|
|
Other
Expenses of the Fund |
|
|
Acquired
Fund Fees and Expenses(1) |
|
|
Total
Annual Fund Operating Expenses |
|
|
Expense
Cap/Reimbursement(2) |
- |
|
Total
Annual Fund Operating Expenses After
Expense
Cap/Reimbursement |
|
(1)
(2)
|
|
1 Year |
3
Years |
5
Years |
10
Years |
|
|
$ |
$ |
$ |
$2,139 |
Direxion
Funds Prospectus
16
17
Direxion
Funds Prospectus
|
|
|
| ||||
|
|
|
|
|
|
|
|
|
|
|
|
|
|
|
|
|
|
|
|
|
|
|
|
|
|
|
|
|
|
|
|
|
|
|
|
|
|
|
|
|
|
|
|
|
|
|
|
|
|
|
|
|
|
|
|
|
|
|
|
|
|
|
|
|
|
|
|
|
|
|
|
|
|
|
|
|
|
|
|
|
|
|
|
|
|
|
|
|
|
|
|
|
|
|
|
|
|
|
|
|
|
|
|
|
|
|
|
|
|
|
|
Direxion
Funds Prospectus
18
19
Direxion
Funds Prospectus
Direxion
Funds Prospectus
20
21
Direxion
Funds Prospectus

|
|
1 Year |
5
Years |
10
Years |
|
Investor
Class |
|
|
|
|
Return
Before Taxes |
-41.52% |
-0.97% |
11.46% |
|
Return
After Taxes on
Distributions |
-41.52% |
-1.94% |
10.84% |
|
Return
After Taxes on
Distributions
and Sale of
Fund
Shares |
-24.58% |
-1.14% |
9.25% |
|
S&P
500®
Index (reflects
no
deduction
for fees,
expenses
or taxes) |
-18.11% |
9.42% |
12.56% |
|
Russell
2000 Index (reflects
no
deduction for fees,
expenses
or taxes) |
-20.44% |
4.13% |
9.01% |
Management
Investment
Adviser. Rafferty Asset
Management, LLC
is
the Fund’s investment adviser.
Portfolio
Managers. The following
members of Rafferty’s investment team are jointly and primarily responsible for
the day-to-day management of the Fund:
|
Portfolio
Managers |
Years of
Service
with the
Fund |
Primary
Title |
|
Paul
Brigandi |
Since
2004 |
Portfolio
Manager |
|
Tony
Ng |
Since
2006 |
Portfolio
Manager |
Purchase
and Sale of Fund Shares
You
may purchase or redeem Fund shares on any business day by written
request via mail (Direxion Funds –
Direxion Monthly Small Cap
Bull 1.75X Fund, P.O. Box 701, Milwaukee, Wisconsin 53201-0701), by wire
transfer, by telephone at (800) 851-0511, or through a financial intermediary.
Purchases and redemptions by telephone are only permitted if you previously
established these options on your account. The Fund accepts investments in the
following minimum amounts:
|
Purchase
Methods |
Initial
Purchases |
Subsequent
Purchases |
|
Minimum
Investment:
Traditional
Investment
Accounts |
$25,000 or a
lesser
amount if
you are a
client of a
securities
dealer, bank
or other
financial
institution. |
$500 |
|
Minimum
Investment:
Retirement
Accounts
(Traditional,
Roth
and
Spousal
individual
retirement
accounts) |
$25,000 or a
lesser
amount if
you are a
client of a
securities
dealer, bank
or other
financial
institution. |
$500 |
Tax
Information
The
Fund’s distributions to you are taxable, and will be taxed as ordinary
income or capital gains, unless you are investing through a tax-deferred
arrangement, such as a 401(k) plan or an individual retirement account.
Distributions on investments made through those arrangements may be taxed later
upon withdrawal of assets from them. The Fund intends to distribute income, if
any, and capital gains, if any, at least annually.
Payments
to Broker-Dealers and Other Financial Intermediaries
If
you purchase shares of the Fund through a broker-dealer or other
financial intermediary (such as a bank or financial adviser), the Fund and/or
its Adviser may pay the intermediary for the sale of Fund shares and related
services. These payments may create a conflict of interest by influencing the
broker-dealer or other financial intermediary and your salesperson to recommend
the Fund over another investment. Ask your salesperson or visit your financial
intermediary’s website for more information.
Direxion
Funds Prospectus
22
Index
Information
The
Russell 2000® Index is a
trademark of Frank Russell Company (“Russell”) and has been licensed for use by
the Trust. The Fund is not sponsored, endorsed, sold or promoted by Russell.
Russell makes no representation regarding the advisability of investing in the
Fund.
23
Direxion
Funds Prospectus
Important
Information Regarding the Fund
The Direxion
Monthly 7-10 Year Treasury Bull 1.75X Fund (the “Fund”) seeks calendar
month leveraged (1.75X) investment results and is very
different from most other mutual funds. As a result, the Fund may be riskier
than alternatives that do not use leverage because the Fund’s objective is to
magnify the monthly performance of the ICE U.S. Treasury 7-10 Year Bond Index
(the "Index"). The return for investors that invest for periods longer or
shorter than a full calendar month, which is defined as the period from the end
of the last business day of one calendar month through the close of trading on
the last business day of the following calendar month, should not be expected to
be 175% of the performance of the Index for the period. The return of the Fund
for a period longer than a full calendar month will be the result of each full
calendar month’s compounded return over the period, which will very likely
differ from 175% of the return of the Index for that period. Longer holding
periods, higher volatility of the Index and leverage increase the impact of
compounding on an investor’s returns. During periods of higher Index volatility,
the volatility of the Index may affect the Fund’s return as much as, or more
than, the return of the Index.
The
Fund is not suitable for all investors. The Fund is designed to
be utilized only by knowledgeable investors who understand the potential
consequences of seeking calendar month leveraged (1.75X) investment results,
understand the risks associated with the use of leverage and are willing to
monitor their portfolios frequently. The Fund is not intended to be used by, and
is not appropriate for, investors who do not intend to actively monitor and
manage their portfolios. For periods longer than a calendar month, the Fund will
lose money if the Index’s performance is flat, and it is possible that the Fund
will lose money even if the Index’s performance increases. An investor could
lose the full principal value of his/her investment within a calendar month if
the Index loses more than 58% in one month.
|
Management
Fees |
|
|
Distribution
and/or Service (12b-1) Fees |
|
|
Other
Expenses of the Fund |
|
|
Acquired
Fund Fees and Expenses(1) |
|
|
Total
Annual Fund Operating Expenses |
|
|
Expense
Cap/Reimbursement(2) |
- |
|
Total
Annual Fund Operating Expenses After
Expense
Cap/Reimbursement |
|
(1)
(2)
|
|
1 Year |
3
Years |
5
Years |
10
Years |
|
|
$ |
$ |
$ |
$2,108 |
Direxion
Funds Prospectus
24
25
Direxion
Funds Prospectus
|
|
|
| ||||
|
|
|
|
|
|
|
|
|
|
|
|
|
|
|
|
|
|
|
|
|
|
|
|
|
|
|
|
|
|
|
|
|
|
|
|
|
|
|
|
|
|
|
|
|
|
|
|
|
|
|
|
|
|
|
|
|
|
|
|
|
|
|
|
|
|
|
|
|
|
|
|
|
|
|
|
|
|
|
|
|
|
|
|
|
|
|
|
|
|
|
|
|
|
|
|
|
|
|
|
|
|
|
|
|
|
|
|
|
|
|
|
Direxion
Funds Prospectus
26
27
Direxion
Funds Prospectus
Direxion
Funds Prospectus
28
29
Direxion
Funds Prospectus

|
|
1 Year |
5
Years |
10
Years |
|
Investor
Class |
|
|
|
|
Return
Before Taxes |
-29.87% |
-3.79% |
-1.72% |
|
Return
After Taxes on
Distributions |
-29.87% |
-4.68% |
-2.18% |
|
Return
After Taxes on
Distributions
and Sale of
Fund
Shares |
-17.68% |
-3.06% |
-1.41% |
|
Bloomberg
U.S. Aggregate
Bond
Index (reflects
no
deduction
for fees,
expenses
or taxes) |
-13.01% |
0.02% |
1.06% |
|
ICE
U.S. Treasury 7-10 Year
Bond
Index (reflects
no
deduction
for fees,
expenses
or taxes) |
-14.89% |
-0.13% |
0.69% |
|
Bloomberg
Intermediate US
Government/Credit
Bond
Index (reflects
no
deduction
for fees,
expenses
or taxes) |
-8.23% |
0.73% |
1.12% |
Management
Investment
Adviser. Rafferty Asset
Management, LLC
is
the Fund’s investment adviser.
Portfolio
Managers. The following
members of Rafferty’s investment team are jointly and primarily responsible for
the day-to-day management of the Fund:
|
Portfolio
Managers |
Years of
Service
with the
Fund |
Primary
Title |
|
Paul
Brigandi |
Since
Inception in
March
2005 |
Portfolio
Manager |
|
Tony
Ng |
Since April
2006 |
Portfolio
Manager |
Purchase
and Sale of Fund Shares
You
may purchase or redeem Fund shares on any business day by written
request via mail (Direxion Funds –
Direxion Monthly 7-10 Year
Treasury Bull 1.75X Fund, P.O. Box 701, Milwaukee, Wisconsin 53201-0701), by
wire transfer, by telephone at (800) 851-0511, or through a financial
intermediary. Purchases and redemptions by telephone are only permitted if you
previously established these options on your account. The Fund accepts
investments in the following minimum amounts:
|
Purchase
Methods |
Initial
Purchases |
Subsequent
Purchases |
|
Minimum
Investment:
Traditional
Investment
Accounts |
$25,000 or a
lesser
amount if
you are a
client of a
securities
dealer, bank
or other
financial
institution. |
$500 |
|
Minimum
Investment:
Retirement
Accounts
(Traditional,
Roth
and
Spousal
individual
retirement
accounts) |
$25,000 or a
lesser
amount if
you are a
client of a
securities
dealer, bank
or other
financial
institution. |
$500 |
Tax
Information
The
Fund’s distributions to you are taxable, and will be taxed as ordinary
income or capital gains, unless you are investing through a tax-deferred
arrangement, such as a 401(k) plan or an individual retirement account.
Distributions on investments made through those arrangements may be taxed later
upon withdrawal of assets from them. The Fund intends to distribute income, if
any, and capital gains, if any, at least annually.
Direxion
Funds Prospectus
30
Payments
to Broker-Dealers and Other Financial Intermediaries
If
you purchase shares of the Fund through a broker-dealer or other
financial intermediary (such as a bank or financial adviser), the Fund and/or
its Adviser may pay the intermediary for the sale of Fund shares and related
services. These payments may create a conflict of interest by influencing the
broker-dealer or other financial intermediary and your salesperson to recommend
the Fund over another investment. Ask your salesperson or visit your financial
intermediary’s website for more information.
Index
Information
ICE
Data Indices, LLC. Neither
Rafferty nor the Fund is sponsored, endorsed, sold or promoted by ICE Data
Indices, LLC or its affiliates (“Vendor”). Vendor makes no representation or
warranty regarding the advisability of investing in securities generally, in the
Fund particularly, or the ability of the ICE U.S. Treasury 7-10 Year Bond Index
to track general financial market performance.
VENDOR
MAKES NO EXPRESS OR IMPLIED WARRANTIES, AND HEREBY
EXPRESSLY DISCLAIMS ALL WARRANTIES OF MERCHANTABILITY OR FITNESS FOR A
PARTICULAR PURPOSE WITH RESPECT TO THE ICE INDEX OR ANY DATA INCLUDED THEREIN.
IN NO EVENT SHALL VENDOR HAVE ANY LIABILITY FOR ANY SPECIAL, PUNITIVE, INDIRECT,
OR CONSEQUENTIAL DAMAGES (INCLUDING LOST PROFITS), EVEN IF NOTIFIED OF THE
POSSIBILITY OF SUCH DAMAGES.
31
Direxion
Funds Prospectus
Important
Information Regarding the Fund
The Direxion
Monthly 7-10 Year Treasury Bear 1.75X Fund (the “Fund”) seeks calendar
month inverse leveraged (-1.75X) investment results and is very
different from most other mutual funds. As a result, the Fund may be riskier
than alternatives that do not use leverage because the Fund’s objective is to
magnify the monthly inverse performance of the ICE U.S. Treasury 7-10 Year Bond
Index (the "Index"). The return for investors that invest for periods longer or
shorter than a full calendar month, which is defined as the period from the end
of the last business day of one calendar month through the close of trading on
the last business day of the following calendar month, should not be expected to
be -175% of the performance of the Index for the period. The return of the Fund
for a period longer than a full calendar month will be the result of each full
calendar month’s compounded return over the period, which will very likely
differ from -175% of the return of the Index for that period. Longer holding
periods, higher volatility of the Index and leverage increase the impact of
compounding on an investor’s returns. During periods of higher Index volatility,
the volatility of the Index may affect the Fund’s return as much as, or more
than, the return of the Index.
The
Fund is not suitable for all investors. The Fund is designed to
be utilized only by knowledgeable investors who understand the potential
consequences of seeking calendar month inverse leveraged (-1.75X) investment
results, understand the risks associated with the use of leverage and shorting
and are willing to monitor their portfolios frequently. The Fund is not intended
to be used by, and is not appropriate for, investors who do not intend to
actively monitor and manage their portfolios. For periods longer than a calendar
month, the Fund will lose money if the Index’s performance is flat, and it is
possible that the Fund will lose money even if the Index’s performance
decreases. An investor could lose the full principal value of his/her investment
within a calendar month if the Index gains more than 58% in one
month.
|
Management
Fees |
|
|
Distribution
and/or Service (12b-1) Fees |
|
|
Other
Expenses of the Fund |
|
|
Acquired
Fund Fees and Expenses(1)
|
|
|
Total
Annual Fund Operating Expenses |
|
|
Expense
Cap/Reimbursement(2) |
- |
|
Total
Annual Fund Operating Expenses After
Expense
Cap/Reimbursement |
|
(1)
(2)
|
|
1 Year |
3
Years |
5
Years |
10
Years |
|
|
$ |
$ |
$ |
$2,424 |
Direxion
Funds Prospectus
32
33
Direxion
Funds Prospectus
|
|
|
| ||||
|
|
|
|
|
|
|
|
|
|
|
|
|
|
|
|
|
|
|
|
|
|
|
|
|
|
|
|
|
|
|
|
|
|
|
|
|
|
|
|
|
|
|
|
|
|
|
|
|
|
|
|
|
|
|
|
|
|
|
|
|
|
|
|
|
|
|
|
|
|
|
|
|
|
|
|
|
|
|
|
|
|
|
|
|
|
|
|
|
|
|
|
|
|
|
|
|
|
|
|
|
|
|
|
|
|
|
|
|
|
|
|
Direxion
Funds Prospectus
34
35
Direxion
Funds Prospectus
Direxion
Funds Prospectus
36
37
Direxion
Funds Prospectus

|
|
1 Year |
5
Years |
10
Years |
|
Investor
Class |
|
|
|
|
Return
Before Taxes |
35.65% |
0.53% |
-2.62% |
|
Return
After Taxes on
Distributions |
35.65% |
0.43% |
-2.67% |
|
Return
After Taxes on
Distributions
and Sale of
Fund
Shares |
21.10% |
0.36% |
-1.96% |
|
Bloomberg
U.S. Aggregate
Bond
Index (reflects
no
deduction
for fees,
expenses
or taxes) |
-13.01% |
0.02% |
1.06% |
|
ICE
U.S. Treasury 7-10 Year
Bond
Index (reflects
no
deduction
for fees,
expenses
or taxes) |
-14.89% |
-0.13% |
0.69% |
|
Bloomberg
Intermediate US
Government/Credit
Bond
Index (reflects
no
deduction
for fees,
expenses
or taxes) |
-8.23% |
0.73% |
1.12% |
Management
Investment
Adviser. Rafferty Asset
Management, LLC
is
the Fund’s investment adviser.
Portfolio
Managers. The following
members of Rafferty’s investment team are jointly and primarily responsible for
the day-to-day management of the Fund:
|
Portfolio
Managers |
Years of
Service
with the
Fund |
Primary
Title |
|
Paul
Brigandi |
Since
Inception in
May
2004 |
Portfolio
Manager |
|
Tony
Ng |
Since April
2006 |
Portfolio
Manager |
Purchase
and Sale of Fund Shares
You
may purchase or redeem Fund shares on any business day by written
request via mail (Direxion Funds –
Direxion Monthly 7-10 Year
Treasury Bear 1.75X Fund, P.O. Box 701, Milwaukee, Wisconsin 53201-0701), by
wire transfer, by telephone at (800) 851-0511, or through a financial
intermediary. Purchases and redemptions by telephone are only permitted if you
previously established these options on your account. The Fund accepts
investments in the following minimum amounts:
|
Purchase
Methods |
Initial
Purchases |
Subsequent
Purchases |
|
Minimum
Investment:
Traditional
Investment
Accounts |
$25,000 or a
lesser
amount if
you are a
client of a
securities
dealer, bank
or other
financial
institution. |
$500 |
|
Minimum
Investment:
Retirement
Accounts
(Traditional,
Roth
and
Spousal
individual
retirement
accounts) |
$25,000 or a
lesser
amount if
you are a
client of a
securities
dealer, bank
or other
financial
institution. |
$500 |
Tax
Information
The
Fund’s distributions to you are taxable, and will be taxed as ordinary
income or capital gains, unless you are investing through a tax-deferred
arrangement, such as a 401(k) plan or an individual retirement account.
Distributions on investments made through those arrangements may be taxed later
upon withdrawal of assets from them. The Fund intends to distribute income, if
any, and capital gains, if any, at least annually.
Payments
to Broker-Dealers and Other Financial Intermediaries
If
you purchase shares of the Fund through a broker-dealer or other
financial intermediary (such as a bank or financial adviser), the Fund and/or
its Adviser may pay the intermediary for the sale of Fund shares and related
services. These payments may create a conflict of interest by influencing the
broker-dealer or other financial intermediary and your
Direxion
Funds Prospectus
38
salesperson
to recommend the Fund over another investment. Ask your
salesperson or visit your financial intermediary’s website for more
information.
Index
Information
ICE
Data Indices, LLC. Neither
Rafferty nor the Fund is sponsored, endorsed, sold or promoted by ICE Data
Indices, LLC or its affiliates (“Vendor”). Vendor makes no representation or
warranty regarding the advisability of investing in securities generally, in the
Fund particularly, or the ability of the ICE U.S. Treasury 7-10 Year Bond Index
to track general financial market performance.
VENDOR
MAKES NO EXPRESS OR IMPLIED WARRANTIES, AND HEREBY
EXPRESSLY DISCLAIMS ALL WARRANTIES OF MERCHANTABILITY OR FITNESS FOR A
PARTICULAR PURPOSE WITH RESPECT TO THE ICE INDEX OR ANY DATA INCLUDED THEREIN.
IN NO EVENT SHALL VENDOR HAVE ANY LIABILITY FOR ANY SPECIAL, PUNITIVE, INDIRECT,
OR CONSEQUENTIAL DAMAGES (INCLUDING LOST PROFITS), EVEN IF NOTIFIED OF THE
POSSIBILITY OF SUCH DAMAGES.
39
Direxion
Funds Prospectus
Overview
of the Funds
The
Direxion Funds (the “Trust”) is a registered investment company offering a
number of separate series. This Prospectus describes shares
of the funds noted below (each a “Fund” and collectively, the “Funds”). Rafferty
Asset Management, LLC serves as the investment adviser to each Fund (“Rafferty”
or “Adviser”).
The Funds with
the word “Bull” in their name (the “Bull Funds”), attempt to provide investment
results that correlate positively to the return of an
underlying index, meaning the Bull Funds attempt to move in the same direction
as the underlying index. The Fund with the word “Bear” in its name (the “Bear
Fund”), attempts to provide investment results that correlate negatively to the
return of an underlying index, meaning that the Bear Fund attempts to move in
the opposite or inverse direction of the underlying index.
Each Fund seeks
to provide a return which is a multiple of the monthly performance of its
underlying index. No Fund attempts to provide returns which are a
multiple of the return of the underlying index for periods other than a calendar
month. Each Fund rebalances its portfolio on a monthly basis, increasing
exposure in response to that month’s gains or reducing exposure in response to
that month’s losses.
Also, the
exposure to the underlying index received by an investor who purchases a Fund
intra-month will differ from the Fund’s stated monthly leveraged
investment objective by an amount determined by the movement of the underlying
index from its value at the end of the prior calendar month. If the underlying
index moves in a direction favorable to the Fund between the close of the market
at the end of one month through the time in the next calendar month when the
investor purchases the Fund, the investor will receive less exposure to the
underlying index than the stated fund monthly leveraged investment objective.
Conversely, if the underlying index moves in a direction adverse to the Fund,
the investor will receive more exposure to the underlying index than the stated
fund monthly leveraged investment objective.
The Funds are
designed as short-term trading vehicles. The Funds are intended to be used by
investors who intend to actively monitor and manage their
portfolios.
|
Fund |
Underlying
Index |
Monthly
Leveraged
Investment
Objective |
|
Direxion
Monthly S&P 500® Bull
1.75X Fund |
S&P 500® Index |
175% |
|
Direxion
Monthly NASDAQ-100® Bull
1.75X Fund |
NASDAQ-100® Index |
175% |
|
Direxion
Monthly Small Cap Bull 1.75X Fund |
Russell 2000® Index |
175% |
|
Direxion
Monthly 7-10 Year Treasury Bull 1.75X Fund |
ICE U.S. Treasury 7-10 Year
Bond Index |
175% |
|
Direxion
Monthly 7-10 Year Treasury Bear 1.75X Fund |
-175% |
The
Funds are not suitable for all investors. The Funds are designed to be utilized
only by sophisticated investors, such as traders and
active investors employing dynamic strategies. Such investors are expected to
monitor and manage their portfolios frequently. Investors in the Funds should:
(a) understand the risks associated with the use of leverage; (b) understand the
consequences of seeking monthly leveraged investment results; (c) for the Bear
Fund, understand the risk of shorting; and (d) intend to actively monitor and
manage their investments. Investors who do not understand the Funds or do not
intend to actively manage their funds and monitor their investments should not
buy the Funds.
There
is no assurance that the Funds will achieve their investment objective
and an
investment in a Fund could lose money. No single Fund is a complete investment
program.
Changes
in Investment Objective. Each Fund’s
investment objective is not a fundamental policy and may be changed by the
Funds’ Board of Trustees without shareholder approval.
Defensive
Policy. Generally, each
Fund pursues its investment objective regardless of market conditions and does
not take defensive positions. However, if an underlying index changes
dramatically against a Fund, Rafferty will attempt to position that Fund’s
portfolio to ensure that the Fund does not lose more than 90% of its net asset
value (“NAV”) in a given calendar month. In addition, because it may be
difficult for a Fund to achieve its stated investment objective any time its
assets fall below $2 million, Rafferty may invest the assets of any such Fund in
short-term U.S. government securities until the level of net assets is
sufficient to permit the desired investments. Taking a temporary defensive
position may result in a Fund not achieving its investment objective. To find
out more information about the Funds, you may call (800)
851-0511.
Direxion
Funds Prospectus
40
Additional
Information Regarding Investment Techniques and
Policies
Rafferty uses
statistical and
quantitative analysis to determine the investments each Fund makes and the
techniques it employs. Rafferty relies upon a pre-determined model to generate
orders that result in repositioning each Fund’s investments in accordance with
its monthly leveraged investment objective. Using this approach, Rafferty
determines the type,
quantity and mix of
investment positions that it believes in combination should produce monthly
returns consistent with a Fund’s investment objective.
In general, if a
Fund is performing as designed, the return of the underlying index will dictate
the return for that Fund. Rafferty does not invest the assets of a Fund in
securities,
derivatives or other
investments based on Rafferty’s view of the investment merit of a particular
security, instrument or company, nor does it conduct conventional investment
research or analysis or forecast market movements or trends.
Each Fund pursues
its investment objective regardless of the market conditions and does not
generally take defensive positions. If a Fund takes a temporary defensive
position,
it may not meet its
investment objective during such periods.
For the Bull
Funds, Rafferty attempts to provide 175%, before fees and expenses, of the
return of each Bull Fund’s underlying index for a calendar month. The
Bear Fund is managed to provide 175% of the inverse (or opposite), before fees
and expenses, of the return of the Bear Fund’s underlying index for a calendar
month. To do this, Rafferty creates net “long” positions for the Bull Funds and
a net “short” position for the Bear Fund. (Rafferty may create short positions
in the Bull Funds and long positions in the Bear Fund even though the net
exposure in the Bull Funds will be long and the net exposure in the Bear Fund
will be short.) Long positions move in the same direction as their underlying
index, advancing when the underlying index advances and declining when the
underlying index declines. Short positions move in the opposite direction of
their underlying index, advancing when the underlying index declines and
declining when the underlying index advances.
At the close of the markets at
the end of each calendar month, each Fund will position its portfolio to ensure
that the Fund’s exposure to its underlying index is consistent with the Fund’s
stated investment objective. The impact of market movements during the month
determines whether a portfolio needs to be repositioned. If the underlying index
has risen in a given month, a Bull Fund’s net assets should rise, meaning its
exposure will typically need to be increased. Conversely, if the underlying
index has fallen in a given month, a Bull Fund’s net assets should fall, meaning
its exposure will typically need to be reduced.
If the underlying
index has risen in a given month, the Bear Fund’s net assets should fall,
meaning its exposure will typically need to be reduced. If the underlying index
has fallen in a given month, the Bear Fund’s net assets should rise, meaning its
exposure will typically need to be increased. Any of the Funds’ portfolios may
also need to be changed to reflect changes in the composition of its underlying
index.
Each Fund
has a clearly
articulated monthly
leveraged
investment
objective
which requires
the
Fund to
seek
economic
exposure in
excess
of
its net
assets
(i.e., economic leverage). To meet
its objectives, each Fund invests in some combination
of financial
instruments so that it generates economic exposure
consistent with the
Fund’s investment objective.
The Bull Funds generally may hold
a representative sample of the securities of the underlying index and may hold
the securities, an ETF that holds a representative sample of the underlying
index, or a swap that includes exposure to a representative sample of the
underlying index. The sampling of securities that is held either directly or by
holding an ETF or a swap, by a Bull Fund is intended to maintain high
correlation with, and similar aggregate characteristics (e.g., market capitalization and
industry weightings) to, the underlying index. A Bull Fund also may invest in
securities that are not included in its
underlying index or
may overweight or underweight certain components of the underlying index.
Certain Funds’ assets may be concentrated in an industry or group of industries
to the extent that a Fund's underlying index concentrates in a particular
industry or group of industries. In addition, each Fund offered in this
Prospectus is non-diversified, which means that it may invest in the securities
of a limited number of issuers.
The
Effects of Fees and Expenses on the Return of a Bull Fund for a Single Calendar
Month. To create the
necessary exposure, a Bull Fund uses leveraged investment techniques, which
necessarily incur brokerage and financing charges. In light of these charges and
each Bull Fund’s operating expenses, the expected return of a Bull Fund over one
calendar month is equal to the gross expected return, which is the monthly
underlying index return multiplied by a Bull Fund’s monthly leveraged investment
objective, minus (i) financing charges incurred by the portfolio and (ii) daily
operating expenses. For instance, if a Bull Fund’s underlying index returns 2%
on a given day, the gross expected return of the related Bull Fund would be
3.5%, but the net expected return, which factors in the cost of financing the
portfolio and the impact of operating expenses, would be lower. Each Bull Fund
will reposition its portfolio at the end of every calendar month. Therefore, if
an investor purchases Fund shares at the close of the markets at the end of a
given calendar month, the investor’s exposure to the underlying index of a Bull
Fund would reflect 175% of the performance of the underlying index during the
following calendar month, subject to the charges and expenses noted
above.
The
Effects of Fees and Expenses on the Return of the Bear Fund for a Single
Calendar Month. To
create the necessary exposure, the Bear Fund utilizes derivatives that provide
short or inverse exposure or may engage in short selling—
borrowing and
selling securities it does not own. The money that the Bear Fund receives from
short sales—the short
sale proceeds—is an asset
of the Bear Fund that can generate income to help offset the Bear Fund’s
operating expenses. The Bear Fund may also generate
additional income when utilizing swaps to obtain short or inverse derivative
exposure, however, the costs of creating short derivative exposure, which may
require the Bear Fund’s counterparties to borrow and sell certain
41
Direxion
Funds Prospectus
securities, may
offset or outweigh such income. As the holder of a short position, including
short derivative exposure, the Bear Fund also is responsible for
paying the dividends and potentially interest accruing on the short position or
exposure, which is an expense to the Bear Fund that could cause the Fund to lose
money on the short sale and may adversely affect its performance. The Bear Fund
will reposition its portfolio at the end of every calendar month. Therefore, if
an investor purchases the Bear Fund at the close of the markets at the end of a
given calendar month, the investor’s exposure to the underlying index of the
Bear Fund would reflect 175% of the inverse performance of the underlying index
during the following calendar month, subject to the charges and expenses noted
above.
A Fund may have difficulty in
achieving its monthly leveraged investment objective due to fees, expenses,
transaction costs, income items, accounting standards, significant purchase and
redemption activity by Fund shareholders and/or disruptions or a temporary lack
of liquidity in the markets for the securities held by the Fund. Additionally,
if a Fund's underlying index includes foreign securities or a Fund tracks a
foreign market index where the foreign market closes before or after the New
York Stock Exchange (“NYSE”) closes (generally at 4 p.m. Eastern Time), the
performance of the underlying index may differ from the expected monthly
leveraged performance.
An exchange or
market may close or issue trading halts on specific securities, or the ability
to buy or sell certain securities or financial instruments may be
restricted, which may result in a Fund being unable to buy or sell certain
securities or financial instruments. In such circumstances, a Fund may be unable
to rebalance its portfolio, may be unable to accurately price its investments
and/or may incur substantial trading losses.
If a Fund is
unable to obtain leveraged or leveraged inverse exposure to its underlying index
consistent with its investment objective, such as situations in
which the instruments utilized by a Fund are thinly traded or have a limited
market, a Fund could, among other things, fail to meet its monthly investment
objective.
Examples
of the Impact of
Monthly Leverage and Compounding. For a period longer than one
calendar month, the pursuit of calendar month goals may result in calendar month
leveraged compounding, which means that the return of an underlying index over a
period of time greater than one calendar month multiplied by a Fund’s calendar
month target (e.g., 175% or -175%) generally will
not equal a Fund’s performance over that same period. As such, although federal
regulations require that this Prospectus include annualized performance and
multi-year expense information for each Fund, investors should bear in mind that
the Funds seek calendar month, and not annual, investment results. A one-year
period is used for illustrative purposes only. Deviations from the returns of a
Fund’s underlying index times a Fund’s multiplier (175% or -175%) can occur over
short periods. Consider the following examples:
Compounding
Example 1 –
Underlying Index Lacks a Trend
Mary
is considering investments in three Funds, Fund A, Fund B and Fund C. Fund A is
a traditional index fund which seeks (before
fees and expenses) to match the performance of the XYZ index. Fund B is a
leveraged Fund and seeks calendar month leveraged investment results (before
fees and expenses) that correspond to 175% of the calendar month performance of
the XYZ index. Fund C is a leveraged Fund and seeks calendar month leveraged
investment results (before fees and expenses) that correspond to -175% of the
calendar month performance of the XYZ index.
In
January, the XYZ index increases in value from $100 to $105, a gain of 5%. In
February, the XYZ index declines from $105 back to
$100, a loss of 4.76%. In the aggregate, the XYZ index has not
moved.
An
investment in Fund A would be expected to gain 5% in January and lose 4.76% in
February to return to its original value. The
following example assumes a $100 investment in Fund A when the index is also
valued at $100:
FUND
A –
A Traditional Index Fund
|
Month |
Index
Value |
Index
Monthly
Performance |
Index
Cumulative
Performance |
Value
of
Investment |
|
|
$100.00 |
|
|
$100.00 |
|
January |
$105.00 |
5.00% |
5.00% |
$105.00 |
|
February |
$100.00 |
-4.76% |
0.00% |
$100.00 |
The
same $100 investment in Fund B, however, would be expected to gain 8.75% in
January (175% of 5%) but decline 8.33% in
February.
FUND
B –
Seeks calendar month leveraged investment results
|
Month |
Index
Value |
Index
Monthly
Performance |
175%
of
Monthly
Index
Performance |
Value
of
Investment |
Index
Cumulative
Performance |
Investment
Cumulative
Performance |
|
|
$100.00 |
|
|
$100.00 |
|
|
|
January |
$105.00 |
5.00% |
8.75% |
$108.75 |
5.00% |
8.75% |
|
February |
$100.00 |
-4.76% |
-8.33% |
$99.69 |
0.00% |
-0.31% |
Direxion
Funds Prospectus
42
Although
the percentage decline is smaller in February than the percentage gain in
January, the loss is applied to a higher principal amount
so the investment in Fund B has a loss of 0.31% even when the aggregate index
value for the two-month period has not declined. (These calculations do not
include the charges for expense ratio and the financing charges.)
Because
Fund C seeks leveraged inverse returns, the same $100 investment in Fund C would
be expected to lose 8.75% in January and then
gain 8.33% in February.
FUND
C –
Seeks calendar month leveraged inverse investment results
|
Month |
Index
Value |
Index
Monthly
Performance |
-175%
of
Index
Monthly
Performance |
Value
of
Investment |
Index
Cumulative
Performance |
Investment
Cumulative
Performance |
|
|
$100.00 |
|
|
$100.00 |
|
|
|
January |
$105.00 |
5.00% |
-8.75% |
$91.25 |
5.00% |
-8.75% |
|
February |
$100.00 |
-4.76% |
8.33% |
$98.85 |
0.00% |
-1.15% |
Because
the gain in February is multiplied by the already-diminished investment, the
investment in Fund C does not make up its January
losses even though the index has returned to its original value.
Compounding
Example 2 –
Underlying Index Has a Clear Trend
Leveraged
compounding will not always result in greater losses. If the index trends in one
direction (e.g.
increases in
value for two consecutive months), the compounded return will outperform the
index’s cumulative performance multiplied by 175% or -175% (as applicable). For
example, if the XYZ Index were to increase to $110 in February (instead of
decline back to $100 as it had in the prior example), the resulting performance
of Fund A, Fund B and Fund C would be as follows:
FUND
A –
A Traditional Index Fund
|
Month |
Index
Value |
Index
Monthly
Performance |
Index
Cumulative
Performance |
Value
of
Investment |
|
|
$100.00 |
|
|
$100.00 |
|
January |
$105.00 |
5.00% |
5.00% |
$105.00 |
|
February |
$110.00 |
4.76% |
10.00% |
$110.00 |
FUND
B –
Seeks calendar month leveraged investment results
|
Month |
Index
Value |
Index
Monthly
Performance |
175%
of
Index
Monthly
Performance |
Value
of
Investment |
Index
Cumulative
Performance |
Investment
Cumulative
Performance |
|
|
$100.00 |
|
|
$100.00 |
|
|
|
January |
$105.00 |
5.00% |
8.75% |
$108.75 |
5.00% |
8.75% |
|
February |
$110.00 |
4.76% |
8.33% |
$117.80 |
10.00% |
17.80% |
FUND
C –
Seeks calendar month leveraged inverse investment results
|
Month |
Index
Value |
Index
Monthly
Performance |
-175%
of
Index
Monthly
Performance |
Value
of
Investment |
Index
Cumulative
Performance |
Investment
Cumulative
Performance |
|
|
$100.00 |
|
|
$100.00 |
|
|
|
January |
$105.00 |
5.00% |
-8.75% |
$91.25 |
5.00% |
-8.75% |
|
February |
$110.00 |
4.76% |
-8.33% |
$83.65 |
10.00% |
-16.33% |
In
the above example, the index’s cumulative performance was 10%, but Fund B gained
slightly more than 17.50% (175% of 10%), due to
the fact that February’s additional gains were applied to a higher investment
amount. Additionally, although the index’s trend was adverse to Fund C’s
performance in both months, the cumulative loss to the investment was less than
17.50%, due to the fact that February’s additional losses were applied to an
already-lowered investment amount. Because the index trended in one direction,
compounding improved the cumulative performance of both Fund B and Fund
C.
This
would also be true if the index trended in the other direction. However, in that
instance, Fund C would outgain -175% of the index’s
cumulative performance and Fund B’s losses would be slightly less than 175% of
the index’s cumulative performance.
An
investor who purchases shares on a day other than the last business day of a
calendar month will generally receive more, or less,
than 175% or -175% (as applicable) exposure to the underlying index from the
time of investment through the end of the month. The actual exposure is a
function of the performance of the underlying index from the end of the
43
Direxion
Funds Prospectus
prior calendar
month to the date of investment in the Fund. If a Fund’s shares are held through
the end of a calendar month or months, the Fund’s
performance is likely to deviate from the multiple of the underlying index’s
performance for the longer period. This deviation will increase with higher
index volatility and longer holding periods. As a consequence, investors should
not plan to hold the funds unmonitored through the end of a month or for longer
periods of time. Volatility exacerbates the effects of compounding on a Fund’s
returns. For instance, if the S&P 500® Index gains 10% during a year,
the Direxion Monthly S&P 500® Bull 1.75X Fund should not be
expected to provide a return of 17.50% for the year even if it meets its
calendar month investment objective throughout the year. This is true because
the pursuit of calendar month goals may result in calendar month leveraged
compounding, which means that the return of an index over a period of time
greater than one calendar month multiplied by 175%, in the case of a Bull Fund,
or -175%, in the case of the Bear Fund, will not generally equal a Fund’s
performance over that same period. Further, the return for investors that invest
for a period less than a calendar month or for a period longer than a calendar
month is unlikely to be 175% or -175% of the return of the underlying index for
shorter period. The Funds are not suitable for all investors. For example,
consider the following three examples:
Example
3 –
Underlying Index Experiences Low Volatility
Mary
invests $10.00 in a Bull Fund on the last day of Calendar Month 1. During
Calendar Month 2, the Fund’s underlying index rises from
100 to 102, a 2% gain. Mary’s investment rises 3.5% to $10.35. Mary holds her
investment through the end of Calendar Month 3, during which the Bull Fund’s
underlying index rises from 102 to 104, a gain of 1.96%. Mary’s investment rises
to $10.71, a gain during Calendar Month 3 of 3.43%. For the two calendar month
period since Mary invested in the Bull Fund, the benchmark gained 4% although
Mary’s investment increased by 7.1%. Because the underlying index continued to
trend upwards with low volatility, Mary’s return closely correlates to the 175%
return of the return of the underlying index for the period.
Example
4 –
Underlying Index Experiences High Volatility
Mary
invests $10.00 in a Bull Fund on the last day of Calendar Month 1. During
Calendar Month 2, the Bull Fund’s underlying index rises from
100 to 110, a 10% gain, and Mary’s investment rises 17.5% to $11.75. Mary
continues to hold her investment through the end of Calendar Month 3, during
which the Bull Fund’s underlying index declines from 110 to 90, a loss of
18.18%. Mary’s investment declines by 31.82%, from $11.75 to $8.01. For the two
calendar month period since Mary invested in the Bull Fund, its underlying index
lost 10% while Mary’s investment decreased from $10 to $8.01, a 19.9% loss. The
volatility of the underlying index affected the correlation between the
underlying index’s return for the two calendar month periods and Mary’s return.
In this situation, Mary lost more than 1.75 times the return of the underlying
index.
Example
5 –
Intra Month Investment with Volatility
The
examples above assumed that Mary purchased the Fund on the last day of the
relevant calendar month and received exposure equal to
175% of her investment. If she made an investment on a subsequent day, she would
have received a beta determined by the performance of the underlying index from
the end of the prior calendar month until the date of the purchase.
Mary
invests $10.00 in the hypothetical Bull Fund on the 5th day of Calendar
Month 1. From the end of the prior calendar month until the day on which Mary
invests, the underlying index moved from 100 to 94, a 6% loss. In light of that
loss, the hypothetical Bull Fund’s beta at the point at which Mary invests is
184%. During the remainder of Calendar Month 1, the Bull Fund’s underlying index
rises from 94 to 97, a gain of 3.19%, and Mary’s investment rises 5.87% (which
is the underlying index’s gain of 3.19% multiplied by the 184% beta that she
received) to $10.59.
Market
Volatility. Each Fund seeks
to provide a return which is a multiple of the calendar month performance of an
underlying index. No Fund attempts to, and no Fund should be expected to,
provide returns which are a multiple of the return of an underlying index for
periods other than one calendar month. Each Fund rebalances its portfolio on a
calendar month basis, increasing exposure in response to that month’s gains or
reducing exposure in response to that month’s losses.
Monthly
rebalancing will impair a Fund’s performance if its underlying index experiences
volatility. For instance, a Bull Fund would be expected to lose
4.0% (as shown in Table 1 below) if its underlying index provided no return over
a one year period and experienced annualized volatility of 25%. The Bear Fund
would be expected to lose 17.1% (as shown in Table 1 below) if its underlying
index provided no return over a one year period and had annualized volatility of
25%. If an underlying index’s annualized volatility were to rise to 50%, the
hypothetical loss for a one year period for a Bull Fund widens to approximately
15.1% while the loss for the Bear Fund rises to 52.8%.
Direxion
Funds Prospectus
44
Table
1 –
Impact of Hypothetical Volatility Levels on Returns
|
Volatility
Range |
1.75X Bull
Fund Loss |
1.75X Bear
Fund Loss |
|
10% |
0.7% |
3.0% |
|
25% |
4.0% |
17.1% |
|
50% |
15.1% |
52.8% |
|
75% |
30.9% |
81.5% |
|
100% |
48.1% |
95.0% |
Table 2 shows
the annualized volatility for each of the indexes to which one of the Funds is
benchmarked over the five year period ended September 30,
2023. The Funds’ underlying indexes have historical volatility rates over that
period ranging from 7.36% to 27.67%. Since market volatility, like that
experienced by the markets recently, has negative implications for the Funds
which rebalance on a calendar month basis, investors should be sure to monitor
and manage their investments in the Funds, particularly in volatile markets. The
negative implications of volatility noted in Table 1 can be combined with the
recent volatility ranges of various indexes in Table 2 to give investors some
sense of the risks of holding the Funds for long periods. These tables are
intended to simply underscore the fact that the Funds that seek calendar month
leveraged investment results are not intended to be used by, and are not
appropriate for, investors who do not intend to actively monitor and manage
their portfolios.
Table
2 –
Historic Volatility of each Fund’s Benchmark Index
|
Index |
5-Year
Historical
Volatility
Rate |
|
ICE U.S.
Treasury 7-10 Year Bond Index |
7.36% |
|
NASDAQ-100®
Index |
26.65% |
|
Russell
2000®
Index |
27.67% |
|
S&P
500®
Index |
21.89% |
The
following charts set out a range of hypothetical calendar month performances
during a given calendar year of an index and demonstrate
how changes in the index impact the Funds’ performance for each calendar month
and cumulatively up to, and including, the entire calendar year. The charts are
based on a hypothetical $100 investment in the Funds over a 12-month calendar
period and do not reflect expenses of any kind.
Table
3 –
The Index Lacks a Clear Trend for a Period Longer Than One Month
|
|
Index |
Bull
Fund |
Bear
Fund | ||||||
|
|
Value |
Calendar
Month
Performance |
Cumulative
Performance |
NAV |
Calendar
Month
Performance |
Cumulative
Performance |
NAV |
Calendar
Month
Performance |
Cumulative
Performance |
|
|
100 |
|
|
$100.00 |
|
|
$100.00 |
|
|
|
January |
105 |
5.00% |
5.00% |
$108.75 |
8.75% |
8.75% |
$91.25 |
-8.75% |
-8.75% |
|
February |
110 |
4.76% |
10.00% |
$117.81 |
8.33% |
17.81% |
$83.65 |
-8.33% |
-16.35% |
|
March |
100 |
-9.09% |
0.00% |
$99.07 |
-15.91% |
-0.93% |
$96.96 |
15.91% |
-3.04% |
|
April |
90 |
-10.00% |
-10.00% |
$81.73 |
-17.50% |
-18.27% |
$113.92 |
17.50% |
13.92% |
|
May |
85 |
-5.56% |
-15.00% |
$73.78 |
-9.73% |
-26.22% |
$125.01 |
9.73% |
25.01% |
|
June |
100 |
17.65% |
0.00% |
$96.57 |
30.89% |
-3.43% |
$86.40 |
-30.89% |
-13.60% |
|
July |
95 |
-5.00% |
-5.00% |
$88.12 |
-8.75% |
-11.88% |
$93.96 |
8.75% |
-6.04% |
|
August |
100 |
5.26% |
0.00% |
$96.23 |
9.21% |
-3.77% |
$85.31 |
-9.21% |
-14.69% |
|
September |
105 |
5.00% |
5.00% |
$104.65 |
8.75% |
4.65% |
$77.84 |
-8.75% |
-22.16% |
|
October |
100 |
-4.76% |
0.00% |
$95.93 |
-8.33% |
-4.07% |
$84.33 |
8.33% |
-15.67% |
|
November |
95 |
-5.00% |
-5.00% |
$87.54 |
-8.75% |
-12.46% |
$91.71 |
8.75% |
-8.29% |
|
December |
105 |
10.53% |
5.00% |
$103.67 |
18.43% |
3.67% |
$74.81 |
-18.43% |
-25.19% |
The
cumulative annual performance of the hypothetical underlying index in Table 3 is
5%. The return of the hypothetical Bull Fund for the
calendar year is 3.67%, while the return of the hypothetical Bear Fund for the
calendar year is -25.19%. The volatility of the hypothetical underlying index’s
performance and the lack of a clear trend means that a hypothetical Fund’s gains
or losses bear little relationship to the performance of the hypothetical
underlying index for the year.
45
Direxion
Funds Prospectus
Table
4 –
The Index Rises in a Clear Trend
|
|
Index |
Bull
Fund |
Bear
Fund | ||||||
|
|
Value |
Calendar
Month
Performance |
Cumulative
Performance |
NAV |
Calendar
Month
Performance |
Cumulative
Performance |
NAV |
Calendar
Month
Performance |
Cumulative
Performance |
|
|
100 |
|
|
$100.00 |
|
|
$100.00 |
|
|
|
January |
102 |
2.00% |
2.00% |
$103.50 |
3.50% |
3.50% |
$96.50 |
-3.50% |
-3.50% |
|
February |
104 |
1.96% |
4.00% |
$107.05 |
3.43% |
7.05% |
$93.19 |
-3.43% |
-6.81% |
|
March |
106 |
1.92% |
6.00% |
$110.65 |
3.36% |
10.65% |
$90.06 |
-3.36% |
-9.94% |
|
April |
108 |
1.89% |
8.00% |
$114.31 |
3.31% |
14.31% |
$87.08 |
-3.31% |
-12.92% |
|
May |
110 |
1.85% |
10.00% |
$118.01 |
3.24% |
18.01% |
$84.26 |
-3.24% |
-15.74% |
|
June |
112 |
1.82% |
12.00% |
$121.77 |
3.19% |
21.77% |
$81.58 |
-3.19% |
-18.42% |
|
July |
114 |
1.79% |
14.00% |
$125.58 |
3.13% |
25.58% |
$79.02 |
-3.13% |
-20.98% |
|
August |
116 |
1.75% |
16.00% |
$129.43 |
3.06% |
29.43% |
$76.60 |
-3.06% |
-23.40% |
|
September |
118 |
1.72% |
18.00% |
$133.32 |
3.01% |
33.32% |
$74.30 |
-3.01% |
-25.70% |
|
October |
120 |
1.69% |
20.00% |
$137.26 |
2.96% |
37.26% |
$72.10 |
-2.96% |
-27.90% |
|
November |
122 |
1.67% |
22.00% |
$141.28 |
2.92% |
41.28% |
$69.99 |
-2.92% |
-30.01% |
|
December |
124 |
1.64% |
24.00% |
$145.33 |
2.87% |
45.33% |
$67.98 |
-2.87% |
-32.02% |
The
cumulative annual performance of the hypothetical underlying index in Table 4 is
24%. The return of the hypothetical Bull Fund for the
calendar year is 45.33%, while the return of the hypothetical Bear Fund for the
calendar year is -32.02%. In this case, because of the trend, the hypothetical
Bull Fund’s gain is greater than 175% of the hypothetical underlying index gain
and the hypothetical Bear Fund’s decline is less than 175% of the hypothetical
underlying index gain for the year.
Table
5 –
The Index Declines in a Clear Trend
|
|
Index |
Bull
Fund |
Bear
Fund | ||||||
|
|
Value |
Calendar
Month
Performance |
Cumulative
Performance |
NAV |
Calendar
Month
Performance |
Cumulative
Performance |
NAV |
Calendar
Month
Performance |
Cumulative
Performance |
|
|
100 |
|
|
$100.00 |
|
|
$100.00 |
|
|
|
January |
98 |
-2.00% |
-2.00% |
$96.50 |
-3.50% |
-3.50% |
$103.50 |
3.50% |
3.50% |
|
February |
96 |
-2.04% |
-4.00% |
$93.05 |
-3.57% |
-6.95% |
$107.19 |
3.57% |
7.19% |
|
March |
94 |
-2.08% |
-6.00% |
$89.67 |
-3.64% |
-10.33% |
$111.10 |
3.64% |
11.10% |
|
April |
92 |
-2.13% |
-8.00% |
$86.33 |
-3.73% |
-13.67% |
$115.24 |
3.73% |
15.24% |
|
May |
90 |
-2.17% |
-10.00% |
$83.05 |
-3.80% |
-16.95% |
$119.61 |
3.80% |
19.61% |
|
June |
88 |
-2.22% |
-12.00% |
$79.82 |
-3.89% |
-20.18% |
$124.26 |
3.89% |
24.26% |
|
July |
86 |
-2.27% |
-14.00% |
$76.65 |
-3.97% |
-23.35% |
$129.20 |
3.97% |
29.20% |
|
August |
84 |
-2.33% |
-16.00% |
$73.52 |
-4.08% |
-26.48% |
$134.47 |
4.08% |
34.47% |
|
September |
82 |
-2.38% |
-18.00% |
$70.46 |
-4.17% |
-29.54% |
$140.07 |
4.17% |
40.07% |
|
October |
80 |
-2.44% |
-20.00% |
$67.45 |
-4.27% |
-32.55% |
$146.05 |
4.27% |
46.05% |
|
November |
78 |
-2.50% |
-22.00% |
$64.50 |
-4.38% |
-35.50% |
$152.44 |
4.38% |
52.44% |
|
December |
76 |
-2.56% |
-24.00% |
$61.61 |
-4.48% |
-38.39% |
$159.27 |
4.48% |
59.27% |
The
cumulative annual performance of the hypothetical underlying index in Table 5 is
-24%. The return of the hypothetical Bull Fund for the
calendar year is -38.39%, while the return of the hypothetical Bear Fund for the
calendar year is 59.27%. In this case, because of the trend, the hypothetical
Bull Fund’s decline is less than 175% of the hypothetical underlying index
decline and the hypothetical Bear Fund’s gain is greater than 175% of the
hypothetical underlying index decline for the year.
Direxion
Funds Prospectus
46
ADDITIONAL
INFORMATION REGARDING PRINCIPAL Risks
An investment in
a Fund entails risks. A Fund may not achieve its investment objective and may
decline in value. In addition, a Fund presents risks not
traditionally associated with most mutual funds. For example, due to the Funds'
monthly leveraged or inverse leveraged investment objectives, a small adverse
move in a Fund's underlying index will result in larger and potentially
substantial declines in that Fund. It is important that investors closely review
and understand all of a Fund’s risks before making an investment. A Fund is not
a complete investment program. While the
realization of certain of the risks described below may benefit the Bear Fund
due to its inverse investment objective, such occurrences may introduce more
volatility to the Bear Fund, which could have a significant negative impact on
Fund performance.
The table below provides the risks of investing in the Funds. Following the
table, each risk is explained.
|
|
|
|
|
|
|
|
|
Direxion Monthly
S&P 500®
Bull
1.75X Fund |
Direxion Monthly
NASDAQ-100®
Bull
1.75X Fund |
Direxion Monthly Small
Cap Bull 1.75X Fund |
Direxion Monthly 7-10
Year Treasury Bull 1.75X Fund |
Direxion Monthly 7-10
Year Treasury Bear 1.75X Fund |
|
Effects of
Compounding and Market Volatility Risk |
X |
X |
X |
X |
X |
|
Leverage
Risk |
X |
X |
X |
X |
X |
|
Derivatives
Risk |
X |
X |
X |
X |
X |
|
Counterparty
Risk |
X |
X |
X |
X |
X |
|
Rebalancing
Risk |
X |
X |
X |
X |
X |
|
Shorting
Risk |
|
|
|
|
X |
|
Intra-Calendar
Month Investment Risk |
X |
X |
X |
X |
X |
|
Monthly
Index Correlation Risk |
X |
X |
X |
X |
|
|
Monthly
Inverse Index Correlation Risk |
|
|
|
|
X |
|
Other
Investment Companies (including ETFs) Risk |
X |
X |
X |
X |
|
|
Passive
Investment Risk |
X |
X |
X |
X |
X |
|
Market
Risk |
X |
X |
X |
X |
X |
|
Liquidity
Risk |
X |
X |
X |
X |
X |
|
Communication
Services Sector Risk |
|
X |
|
|
|
|
Credit
Risk |
|
|
|
X |
X |
|
Debt
Instrument Risk |
|
|
|
X |
X |
|
Financials
Sector Risk |
|
|
X |
|
|
|
Healthcare
Sector Risk |
|
|
X |
|
|
|
Industrials
Sector Risk |
|
|
X |
|
|
|
Information
Technology Sector Risk |
X |
X |
|
|
|
|
Interest
Rate Risk |
|
|
|
X |
X |
|
U.S.
Government Securities Risk |
|
|
|
X |
X |
|
Large
Capitalization Company Risk |
X |
X |
|
|
|
|
Micro-Capitalization
Company Risk |
|
|
X |
|
|
|
Mid-Capitalization
Company Risk |
X |
|
|
|
|
|
Small-
and/or Mid-Capitalization Company Risk |
|
|
X |
|
|
|
Depositary
Receipt Risk |
|
X |
|
|
|
|
Index
Strategy Risk |
X |
X |
X |
X |
X |
|
Foreign
Securities Risk |
|
X |
|
|
|
|
Early
Close/Trading Halt Risk |
X |
X |
X |
X |
X |
|
Equity
Securities Risk |
X |
X |
X |
|
|
|
High
Portfolio Turnover Risk |
|
|
|
X |
|
|
Market
Timing Activity Risk |
X |
X |
X |
X |
X |
|
Non-Diversification
Risk |
X |
X |
X |
X |
X |
|
Tax
Risk |
X |
X |
X |
X |
X |
47
Direxion
Funds Prospectus
Effects
of Compounding and Market Volatility Risk
Each
Fund has a monthly leveraged investment objective and a Fund’s
performance for periods greater than a full calendar month which is defined as
the period from the end of the last business day of one calendar month through
the close of trading on the last business day of the following calendar month
will be the result of each month's returns compounded over the period, which is
very likely to differ from an underlying index’s performance times the stated
multiple in a Fund’s investment objective, before fees and expenses. Compounding
affects all investments, but has a more significant impact on leveraged funds
and funds that rebalance monthly.
Over
time, the cumulative percentage increase or decrease in the value of a
Fund’s portfolio may diverge significantly from the cumulative percentage
increase or decrease in 175% or -175% of the return of a Fund's underlying index
due to the compounding effect of losses and gains on the returns of a Fund. It
also is expected that a Fund’s use of leverage will cause the Fund to
underperform the return of 175% or -175% of its underlying index in a trendless
or flat market.
The chart below
provides examples of how index volatility could affect a Fund’s
performance. An index’s volatility rate is a statistical measure of the
magnitude of fluctuations in the returns of the index. Fund performance for
periods greater than one calendar month can be estimated given any set of
assumptions for the following factors: a) index volatility; b) index
performance; c) period of time; d) financing rates associated with leveraged
exposure; e) other Fund expenses; and f) dividends or interest paid with respect
to securities in its underlying index. The chart below illustrates the impact of
two principal factors – index
volatility and index performance – on Fund
performance. The chart shows estimated Fund returns for a
number of combinations of index volatility and index performance over a one-year
period. Performance shown in the chart assumes that: (i) no dividends were paid
with respect to the securities included in its underlying index; (ii) there were
no Fund expenses; and (iii) borrowing/lending rates of 0%. If Fund expenses
and/or actual borrowing/lending rates were reflected, the estimated returns
would be different than those shown. Particularly during periods of higher index
volatility, compounding will cause results for periods longer than a full
calendar month to vary from 175% or -175% of the performance of the underlying
index.
As shown below,
a Bull Fund would be expected to lose 4% and the Bear Fund would be
expected to lose 14% if the underlying index provided no return over a one year
period during which the underlying index experienced annualized volatility of
25%. If the underlying index’s annualized volatility were to rise to 75%, the
hypothetical loss for a one year period widens to approximately 53.6% for a Bull
Fund and 74.2% for the Bear Fund. At higher ranges of volatility, there is a
chance of a significant loss of value even if the underlying index is flat. For
instance, if the underlying index’s annualized volatility is 100%, it is likely
that a Bull Fund would lose 48.1% of its value, and the Bear Fund would lose
approximately 91% of its value, even if the underlying index’s cumulative return
for the year was only 0%.
Bull
Fund
|
One
Year
Index |
175%
One
Year
Index |
Volatility
Rate | ||||
|
Return |
Return |
10% |
25% |
50% |
75% |
100% |
|
-60% |
-105% |
-80.0% |
-80.7% |
-82.9% |
-86.1% |
-89.6% |
|
-50% |
-87.5% |
-70.5% |
-71.5% |
-74.8% |
-79.4% |
-84.6% |
|
-40% |
-70% |
-59.4% |
-60.7% |
-65.3% |
-71.7% |
-78.8% |
|
-30% |
-52.5% |
-46.8% |
-48.6% |
-54.5% |
-63.0% |
-72.2% |
|
-20% |
-35% |
-32.8% |
-35.0% |
-42.6% |
-53.2% |
-64.9% |
|
-10% |
-17.5% |
-17.4% |
-20.2% |
-29.4% |
-42.5% |
-56.9% |
|
0% |
0% |
-0.7% |
-4.0% |
-15.1% |
-30.9% |
-48.1% |
|
10% |
17.5% |
17.4% |
13.4% |
0.3% |
-18.3% |
-38.7% |
|
20% |
35% |
36.7% |
32.1% |
16.8% |
-4.9% |
-28.6% |
|
30% |
52.5% |
57.2% |
51.9% |
34.3% |
9.4% |
-17.9% |
|
40% |
70% |
79.0% |
72.9% |
52.9% |
24.6% |
-6.5% |
|
50% |
87.5% |
102.0% |
95.1% |
72.5% |
40.6% |
5.5% |
|
60% |
105% |
126.1% |
118.5% |
93.2% |
57.4% |
18.1% |
Bear
Fund
|
One
Year
Index |
-175%
One
Year
Index |
Volatility
Rate | ||||
|
Return |
Simple
Return |
10% |
25% |
50% |
75% |
100% |
|
-60% |
105% |
385.2% |
327.6% |
172.4% |
28.4% |
-55.2% |
|
-50% |
87.5% |
228.4% |
189.4% |
84.3% |
-13.1% |
-69.7% |
|
-40% |
70% |
138.7% |
110.3% |
34.0% |
-36.8% |
-78.0% |
|
-30% |
52.5% |
82.2% |
60.6% |
2.3% |
-51.8% |
-83.2% |
|
-20% |
35% |
44.3% |
27.1% |
-19.0% |
-61.8% |
-86.7% |
|
-10% |
17.5% |
17.4% |
3.5% |
-34.1% |
-68.9% |
-89.2% |
|
0% |
0% |
-2.4% |
-14.0% |
-45.2% |
-74.2% |
-91.0% |
|
10% |
-17.5% |
-17.4% |
-27.2% |
-53.6% |
-78.1% |
-92.4% |
|
20% |
-35% |
-29.0% |
-37.5% |
-60.2% |
-81.2% |
-93.4% |
|
30% |
-52.5% |
-38.3% |
-45.6% |
-65.4% |
-83.7% |
-94.3% |
|
40% |
-70% |
-45.8% |
-52.3% |
-69.6% |
-85.7% |
-95.0% |
|
50% |
-87.5% |
-52.0% |
-57.7% |
-73.0% |
-87.3% |
-95.6% |
|
60% |
-105% |
-57.1% |
-62.2% |
-75.9% |
-88.7% |
-96.0% |
A
Fund’s actual returns may be significantly better or worse than the returns
shown above. The charts above is intended to isolate the effects of underlying
index volatility and underlying index performance on the return of a Fund. The
charts is intended to underscore the fact that a Fund is designed as a
short-term trading vehicle for investors who intend to actively monitor and
manage their portfolios.
Holding
an unmanaged position opens the investor to the risk of market
volatility adversely affecting the performance of the investment. A Fund is not
appropriate for investors who do not intend to actively monitor and manage their
portfolios.
Leverage
Risk
To achieve its
monthly investment objective, each Fund employs leverage and is exposed
to the risk that adverse calendar month performance of a Fund's underlying index
will be magnified. This means that, if a Fund's underlying index experiences
adverse calendar month performance, an investment in the Fund will be reduced by
an amount equal to 1.75% for every 1% of adverse performance, not including the
costs of financing leverage and other operating expenses, which would further
reduce its value.
Direxion
Funds Prospectus
48
A Fund could
theoretically lose an amount greater than its net assets if its underlying
index moves more than 58% in a direction adverse to the Fund (meaning a decline
in the value of the underlying index of a Bull Fund and a gain in the value of
the underlying index for the Bear Fund). This would result in a total loss of an
shareholder’s investment in one day even if its underlying index subsequently
moves in the opposite direction and eliminates all or a portion of its earlier
daily change. A total loss may occur in a single day even if its underlying
index does not lose all of its value. Leverage will also have the effect of
magnifying any differences in a Fund’s correlation with the underlying index or
may increase a Fund’s volatility.
Due
to the limited availability of necessary investments or financial
instruments, a Fund could, among other things, as a defensive measure, limit or
suspend purchases or redemptions of Fund shares until the Adviser determines
that the requisite exposure to the underlying index is obtainable. A Fund may
also change its investment objective by, for example, seeking to track an
alternative index, or lowering its leverage multiple or the Fund could
close.
Derivatives
Risk
A Fund
may obtain
exposure
through derivatives
by investing in swap agreements, futures contracts, forward contracts, options,
and options on futures contracts. Investing in derivatives may be considered
aggressive and may expose a Fund to risks different from, and possibly greater
than, risks associated with investing directly in the reference asset(s)
underlying the derivative. The use of derivatives may result in larger losses or
smaller gains than investing in the underlying securities directly, or in the
case of the Bear Fund, directly shorting the underlying securities. The use of
derivatives may expose a Fund to additional risks such as counterparty risk,
liquidity risk and increased monthly correlation risk. When a Fund uses
derivatives, there may be imperfect correlation between the value of the
underlying reference assets and the derivative, which may prevent a Fund from
achieving its investment objective.
A Fund expects
to use a combination
of swaps on the underlying index and swaps on an ETF that is designed to track
the performance of that index. The performance of an ETF may not track the
performance of its underlying index due to embedded costs and other factors.
Thus, to the extent a Fund invests in swaps that use an ETF as the reference
asset, the Fund may be subject to greater correlation risk and may not achieve
as high a degree of correlation with its underlying index as it would if the
Fund only used swaps on the underlying index. If the underlying index has a
dramatic intraday move in value that causes a material decline in a Fund’s NAV,
the terms of the swap agreement between a Fund and its counterparty may allow
the counterparty to immediately close out of the transaction with a Fund. In
such circumstances, a Fund may be unable to enter into another swap agreement or
invest in other derivatives to achieve the desired exposure consistent with a
Fund’s monthly leveraged investment objective. This may prevent a Fund from
achieving its monthly leveraged investment objective particularly if the
underlying index reverses all or a portion of its intraday move by the end of
the day. The
value of an investment in the Fund may change quickly and without warning. Any
financing, borrowing or other costs associated with using derivatives may also
have the effect of lowering a Fund’s return. Such costs may increase as interest
rates rise.
In
addition, a Fund’s investments in derivatives are subject to the following
risks:
•
Swap
Agreements. Swap agreements
are entered into primarily with major global financial institutions for a
specified period which may range from one day to more than one year. In a
standard swap transaction, two parties agree to exchange the return (or
differentials in rates of return) earned or realized on particular predetermined
reference or underlying securities or instruments. The gross return to be
exchanged or swapped between the parties is calculated based on a notional
amount or the return on or change in value of a particular dollar amount
invested in a reference asset. Swap agreements are generally traded
over-the-counter, and therefore, may not receive regulatory protection, which
may exposure investors to significant losses.
•
Futures
Contracts. A futures
contact is a contract to purchase or sell a particular security, or the cash
value of an index, at a specified future date at a price agreed upon when the
contract is made. Under such contracts, no delivery of the actual securities is
required. Rather, upon the expiration of the contract, settlement is made by
exchanging cash in an amount equal to the difference between the contract price
and the closing price of a security or index at expiration, net of the variation
margin that was previously paid.
•
Forward
Contracts. Forward
contracts are two-party contracts pursuant to which one party agrees to pay the
counterparty a fixed price for an agreed upon amount of commodities, securities,
or the cash value of the commodities, securities or the securities index, at an
agreed upon date. A forward currency contract is an obligation to buy or sell a
specific currency at a future date, which may be any fixed number of days from
the date of the contract agreed upon by the parties, at a price set at the time
of the contract.
•
Options. An option is a
contract that gives the purchaser (holder) of the option, in return for a
premium, the right to buy from (call) or sell to (put) the seller (writer) of
the option the security or currency underlying the option at a specified
exercise price at any time during the term of the option (normally not exceeding
nine months). The writer of an option has the obligation upon exercise of the
option to deliver the underlying security or currency upon payment of the
exercise price or to pay the exercise price upon delivery of the underlying
security or currency.
•
Options
on Futures Contracts. An option on a
futures contract provides the holder with the right to enter into a “long”
position in the underlying futures contract, in the case of a call option, or a
“short” position in the underlying futures contract in the case of a put option,
at a fixed exercise price to a stated expiration date. Upon exercise of the
option by the holder, the contract market
49
Direxion
Funds Prospectus
clearing
house establishes a corresponding short position for the writer of
the option, in the case of a call option, or a corresponding long position, in
the case of a put option.
Counterparty
Risk
Counterparty
risk is the risk that a counterparty is unwilling or unable to make timely payments
to meet its contractual obligations with respect to the amount a Fund expects to
receive from a counterparty to a financial instrument entered into by a Fund.
Each Fund generally enters into derivatives transactions, such as the swap
agreements, with counterparties such that either party can terminate the
contract without penalty prior to the termination date. If a counterparty
terminates a contract, a Fund may not be able to invest in other derivatives to
achieve the desired exposure, or achieving such exposure may be more
expensive.
A Fund may be
negatively impacted if a counterparty becomes bankrupt or otherwise fails to
perform its obligations under such a contract, or if any collateral posted by
the counterparty for the benefit of a Fund is insufficient or there are delays
in a Fund’s ability to access such collateral. If the counterparty becomes
bankrupt or defaults on its payment obligations to a Fund, it may experience
significant delays in obtaining any recovery, may obtain only a limited recovery
or obtain no recovery and the value of an investment held by a Fund may decline.
The Fund may also not be able to exercise remedies, such as the termination of
transactions, netting of obligations and realization on collateral, if such
remedies are stayed or eliminated under special resolutions adopted in the
United States, the European Union and various other jurisdictions. European
Union rules and regulations intervene when a financial institution is
experiencing financial difficulties and could reduce, eliminate, or convert to
equity a counterparty’s obligations to a Fund (sometimes referred to as a “bail
in”).
A
Fund typically enters into transactions with counterparties that present
minimal risks based on the Adviser’s assessment of the counterparty’s
creditworthiness, or its capacity to meet its financial obligations during the
term of the derivative agreement or contract. The Adviser considers factors such
as counterparty credit rating among other factors when determining whether a
counterparty is creditworthy. The Adviser regularly monitors the
creditworthiness of each counterparty with which a Fund transacts. Each Fund
generally enters into swap agreements or other financial instruments with major,
global financial institutions and seeks to mitigate risks by generally requiring
that the counterparties for each Fund to post collateral, marked to market
daily, in an amount approximately equal to what the counterparty owes a Fund,
subject to certain minimum thresholds. To the extent any such collateral is
insufficient or there are delays in accessing the collateral, the Funds will be
exposed to the risks described above. If a counterparty’s credit ratings
decline, a Fund may be subject to a bail-in, as described above.
In
addition, a Fund may enter into swap agreements with a limited number
of counterparties, which may increase a Fund’s exposure to counterparty credit
risk. A Fund does not specifically limit its counterparty risk with respect to
any single counterparty. There is a risk that no suitable
counterparties
are willing to enter into, or continue to enter into,
transactions with a Fund and, as a result, a Fund may not be able to achieve its
investment objective or may decide to change its leveraged investment objective.
Additionally, although a counterparty to a centrally cleared swap agreement
and/or an exchange-traded futures contract is often backed by a futures
commission merchant (“FCM”) or a clearing organization that is further backed by
a group of financial institutions, there may be instances in which a FCM or a
clearing organization would fail to perform its obligations, causing significant
losses to a Fund.
Rebalancing
Risk
If
for any reason a Fund is unable to rebalance all or a part of its portfolio,
or if all or a portion of the portfolio is rebalanced incorrectly, a Fund’s
investment exposure may not be consistent with its investment objective. In
these instances, a Fund may have investment exposure to the underlying index
that is significantly greater or less than its stated multiple. A Fund may be
more exposed to leverage risk than if it had been properly rebalanced and may
not achieve its investment objective, leading to significantly greater losses or
reduced gains.
Shorting
Risk
For the Bear
Fund, shareholders
should lose money when the underlying index rises, which is a result that is the
opposite from traditional index tracking funds. The Bear Fund may engage in
short sales designed to earn the Bear Fund a profit from the decline in the
price of particular securities, baskets of securities or indices. Short sales
are transactions in which the Bear Fund borrows securities from a broker and
sells the borrowed securities. The Bear Fund is obligated to replace the
security borrowed by purchasing the security at the market price at the time of
replacement. If the market price of the underlying security goes down between
the time the Bear Fund sells the security and buys it back, the Bear Fund will
realize a gain on the transaction. Conversely, if the underlying security goes
up in price during the period, the Bear Fund will realize a loss on the
transaction. Any such loss is increased by the amount of premium or interest the
Bear Fund must pay to the lender of the security. Likewise, any gain will be
decreased by the amount of premium or interest the
Bear Fund must pay
to the lender of the security. The Bear Fund’s investment performance may also
suffer if the Bear Fund is required to close out a short position earlier than
it had intended. This would occur if the securities lender required the Bear
Fund to deliver the securities the Bear Fund borrowed at the commencement of the
short sale and the Bear Fund was unable to borrow the securities from another
securities lender or otherwise obtain the security by other means. In addition,
the Bear Fund may be subject to expenses related to short sales that are not
typically associated with investing in securities directly, such as costs of
borrowing and margin account maintenance costs associated with the Bear Fund’s
open short positions. As the holder of a short position, the Bear Fund also is
responsible for paying the dividends and interest accruing on the short
position, which is an expense to the Bear Fund that could cause the Bear Fund to
lose money on the short sale and may adversely affect its
performance.
Direxion
Funds Prospectus
50
The Bear Fund will typically
obtain inverse or “short” exposure through the use of derivatives such as swap
agreements or futures contracts, which may expose the Bear Fund to certain risks
such as an increase in volatility or decrease in the liquidity of the securities
or financial instruments of the underlying short position. If the Bear Fund were
to experience this volatility or decreased liquidity, the Bear Fund’s return may
be lower, the Fund’s ability to obtain inverse exposure through the use of
derivatives may be limited or the Bear Fund may be required to obtain inverse
exposure through alternative investment strategies that may be less desirable or
more costly to implement. If the securities or financial instruments underlying
the short positions are thinly traded or have a limited market due to various
factors, including regulatory action, the Bear Fund may be unable to meet its
investment objective due to a lack of available securities,
financial
instruments or counterparties. The Bear Fund may not be able to issue additional
Shares during period when it cannot meet its investment objective due to these
factors. Any income, dividends or payments by the assets underlying the Bear
Fund’s short positions will negatively impact the Fund.
Intra-Calendar
Month Investment Risk
A Fund seeks
calendar month leveraged investment results. Thus, an investor who purchases
shares on a day other than the last business day of a calendar month will likely
obtain more, or less, than 175% (for a Bull Fund) or -175% (for the Bear Fund)
investment exposure to its underlying index, depending upon the movement of its
underlying index from the end of the prior calendar month until the time of
investment by an investor. If, since the beginning of the month, its underlying
index has moved in a direction favorable to a Fund at the time of an investor’s
investment in it, the investor will receive exposure to its underlying index
less than 175% (for a Bull Fund) or -175% (for the Bear Fund). Conversely, if
its underlying index has moved in a direction adverse to a Fund at the time of
an investor’s investment in it, the investor will receive exposure to its
underlying index greater than 175% (for a Bull Fund) or -175% (for the Bear
Fund).
Monthly
Index Correlation Risk
There
can be no guarantee that a Bull Fund will achieve a high degree of
correlation with its investment objective relative to its underlying index.
Failure to achieve a high degree of correlation may prevent a Bull Fund from
achieving its investment objective. A number of factors may adversely affect a
Bull Fund’s correlation with its underlying index, including fees, expenses,
transaction costs, financing costs related to the use of derivatives,
investments in ETFs, directly or indirectly as a reference asset for derivative
instruments, income items, valuation methodology, accounting standards and
disruptions or illiquidity in the markets for the securities or derivatives held
by a Bull Fund. Market disruptions, regulatory restrictions or extreme
volatility will also adversely affect a Bull Fund’s ability to adjust exposure
to the required levels. Activities surrounding index reconstitutions and other
index repositioning events may hinder a Bull Fund’s ability to meet its calendar
month leveraged investment objective.
Because
an underlying index may include instruments that trade on a
different market than a Bull Fund, a Bull Fund’s return may vary from a multiple
of the performance of an underlying index because different markets may close
before the Exchange opens or may not be open for business on the same calendar
days as a Bull Fund. Additionally, due to differences in trading hours between
these different markets, and because the underlying index may be calculated
using prices obtained at times other than a Fund’s NAV calculation time,
correlation to the underlying index may be measured by comparing the Fund’s
monthly return to a multiple of the calendar month performance of an underlying
index or by comparing the monthly change in a Fund’s NAV per share to a multiple
of the calendar month performance of one or more U.S. ETFs that reflect the
values of the securities underlying an underlying index as of a Fund’s NAV
calculation time. It is important to note that correlation to these ETFs may
vary from the correlation to an underlying index due to embedded costs and other
factors.
A
Bull Fund may not have investment exposure to all securities in its underlying
index, or its weighting of investment exposure to such stocks or industries may
be different from that of its underlying index. In addition, a Bull Fund may
invest in securities or financial instruments not included in its underlying
index. A Bull Fund may take or refrain from taking positions in order to improve
tax efficiency or comply with regulatory restrictions, either of which may
negatively affect a Bull Fund’s correlation with its underlying index. A Bull
Fund may be subject to large movements of assets into and out of a Bull Fund,
potentially resulting in a Bull Fund being over- or under-exposed to its
underlying index. Additionally, securities in a Fund's underlying index may
trade on markets that may not be open on the same day as a Bull Fund, which may
cause a difference between the performance of a Bull Fund and its underlying
index.
Any
of these factors individually or in combination with other factors
could decrease the correlation between the monthly performance of a Bull Fund
and its underlying index and may hinder a Bull Fund’s ability to meet its
leveraged investment objective.
Monthly
Inverse Index Correlation Risk
Each
Bear Fund is negatively correlated to its underlying index and should
lose money when its underlying index rises —
a result that is the opposite from traditional index funds.
There can be no
guarantee that the
Bear Fund will achieve a high degree of correlation with its inverse leveraged
investment objective relative to its underlying index. Failure to achieve a high
degree of correlation may prevent the
Bear Fund from
achieving its investment objective. A number of factors may adversely affect the
Bear Fund’s correlation with its underlying index, including fees, expenses,
transaction costs, financing costs related to the use of derivatives, use of an
ETF as a reference asset for derivative instruments, income items, valuation
methodology, accounting standards and disruptions or illiquidity in the markets
for the securities or derivatives held by the Bear Fund. Market disruptions,
51
Direxion
Funds Prospectus
regulatory
restrictions or extreme volatility will also adversely affect the Bear Fund’s ability to
adjust exposure to the required levels. Activities surrounding index
reconstitutions and other index repositioning events may hinder the Bear Fund’s
ability to meet its calendar month inverse leveraged investment
objective.
Because an
underlying index may include instruments that trade on a different market than
the Bear Fund, the Bear Fund’s return may vary from the inverse of a multiple of
the performance of an underlying index because different markets may close
before the Exchange opens or may not be open for business on the same calendar
days as the Bear Fund. Additionally, due to differences in trading hours between
these different markets, and because the underlying index may be calculated
using prices obtained at times other than a Fund’s NAV calculation time,
correlation to the underlying index may be measured by comparing the Fund’s
monthly return to the inverse of a multiple of the calendar month performance of
an underlying index or by comparing the monthly change in a Fund’s NAV per share
to a multiple of the inverse of the calendar month performance of one or more
U.S. ETFs that reflect the values of the securities underlying an underlying
index as of a Fund’s NAV calculation time. It is important to note that
correlation to these ETFs may vary from the correlation to an underlying index
due to embedded costs and other factors. Additionally, there may be legal
restrictions or limitation imposed by governments of certain countries which may
limit the size of a Fund’s holding or otherwise limit a Fund’s ability to
achieve its investment objective.
The Bear Fund may not have
investment exposure to all securities in its underlying index, or its weighting
of investment exposure to such stocks or industries may be different from that
of its underlying index. In addition, the Bear Fund may invest in securities or
financial instruments not included in its underlying index. The Bear Fund may
take or refrain from taking positions in order to improve tax efficiency or
comply with regulatory restrictions, either of which may negatively affect the
Bear Fund’s inverse correlation with its underlying index. The Bear Fund may be
subject to large movements of assets into and out of the Bear Fund, potentially
resulting in the Bear Fund being over- or under-exposed to its underlying index.
Additionally, securities in a Fund's underlying index may trade on markets that
may not be open on the same day as the Bear Fund, which may cause a difference
between the performance of the Bear Fund and its underlying index.
Any of these
factors individually or in combination with other factors could decrease the
correlation between the monthly performance of the Bear Fund and its underlying
index and may hinder the Bear Fund’s ability to meet its inverse leveraged
investment objective.
Other
Investment Companies (including ETFs) Risk
A Fund may
invest in,
or obtain exposure
to, another investment company, including an ETF (each, an “underlying fund”),
to pursue its investment objective or manage cash. When investing in an
underlying fund, including an ETF, a Fund becomes a shareholder of that
underlying fund and as a result, Fund shareholders indirectly bear a Fund’s
proportionate
share of the fees and expenses of the underlying fund, in addition to
the fees and expenses of a Fund’s own operations. A Fund must rely on the
underlying fund to achieve its investment objective. Accordingly, if the
underlying fund fails to achieve its investment objective, a Fund’s performance
will likely be adversely affected. To the extent a Fund obtains exposure to an
underlying fund, including an ETF, by entering into a derivatives contract whose
reference asset is the underlying fund, a Fund will not be a shareholder of the
underlying fund but will still be exposed to the risk that it may fail to
achieve its investment objective and adversely impact the Fund. In addition, to
the extent that a Fund invests in an underlying fund that is an ETF, it will be
exposed to all of the risks associated with the ETF structure,
including any risks
associated with representative sampling
(see
“Special Risks of
Exchange-Traded Funds”).
For
example,
shares of ETFs may
trade at a discount or a premium to an ETF’s net asset value, which may result
in an ETF’s market price being more or less than the value of the index that the
ETF tracks especially during periods of market volatility or disruption. There
may also be additional trading costs due to an ETF’s bid-ask spread, and/or the
underlying fund may suspend sales or redemptions of its shares due to market
circumstances that make it impracticable to conduct such transactions, any of
which may adversely impact a Fund’s performance.
Passive
Investment Risk
A Fund generally
will not change its investment exposures, including by buying or selling
securities or instruments, in response to market conditions. For example, a Fund
generally will not buy or sell an underlying index’s constituents due to a
change in its performance or based on changes to the prospects of an underlying
index’s constituent, unless that constituent is removed from the underlying
index with which a Fund seeks correlated performance.
Market
Risk
A Fund’s
investments are subject to changes in general economic conditions, general
market fluctuations and the risks inherent in investment in securities markets.
Investment markets can be volatile and prices of investments can change
substantially due to various factors including, but not limited to, economic
growth or recession, inflation rates and/or investor expectations concerning
such rates, changes in interest rates, changes in the actual or perceived
creditworthiness of issuers, general market liquidity, exchange trading
suspensions and closures, and public health risks. The current high interest
rate and high inflation environment may
also
have a significant
impact on a Fund’s ability to achieve its investment objective. Interest rates
and inflation rates may change frequently and drastically as a result of various
factors and a Fund’s investments may not keep pace with these
changes.
Securities
markets also may experience long periods of decline in value. During a general
downturn in the securities markets, multiple asset classes may decline in value
simultaneously and changes in the financial condition of a single issuer can
impact a market the markets broadly. A Fund is subject to the risk that
geopolitical events will disrupt markets and adversely affect global economies,
markets, and exchanges.
Direxion
Funds Prospectus
52
Local, regional
or global events such as war, acts of terrorism, natural disasters, the spread of
infectious illness or other public health issues, conflicts and social unrest or
other events could have a significant impact on a Fund, its investments and a
Fund’s ability to achieve its investment objective.
Markets and
market participants are increasingly reliant on information data systems.
Inaccurate data, software or other technology malfunctions, programming
inaccuracies, unauthorized use or access and similar circumstances may impair
the performance of these systems and may have an adverse impact upon a single
issuer, a group of issuers, or securities markets more broadly.
Liquidity
Risk
Some securities
held by a Fund
may be difficult to
buy or sell or illiquid, particularly during times of market turmoil. Illiquid
securities may be difficult to value, especially in changing or volatile
markets. If a Fund is forced to buy or sell an illiquid security or derivative
instrument at an unfavorable time or price, a Fund may incur a loss. Certain
market conditions may prevent a Fund from limiting losses, realizing gains or
achieving a high correlation with its underlying index. There is no assurance
that a security or derivative instrument that is deemed liquid when purchased
will continue to be liquid. Market illiquidity may cause losses for certain
Funds. For these Funds, to the extent that an underlying index moves adversely,
a Fund may be one of many market participants that are attempting to transact in
the securities of an underlying index or correlated instruments.
In
certain cases, the market for certain securities in its underlying index
and/or Fund may lack sufficient liquidity for all market participants' trades.
Therefore, a Fund may have difficulty transacting in it and/or in correlated
investments, such as swap contracts. Further, a Fund's transactions could
exacerbate illiquidity and volatility in the price of the securities and
correlated derivative instruments.
Communication
Services Sector Risk
The
communication services sector may be dominated by a small number of
companies which may lead to additional volatility in the sector. Communication
services companies are particularly vulnerable to the potential obsolescence of
products and services due to technological advances and the innovation of
competitors. Communication services companies may also be affected by other
competitive pressures, such as pricing competition, as well as research and
development costs, substantial capital requirements and government regulation.
Fluctuating domestic and international demand, shifting demographics and often
unpredictable changes in consumer demand can drastically affect a communication
services company’s profitability. Telecommunication service providers are often
required to obtain licenses or franchises in order to provide services in a
given location. Licensing or franchise rights are limited, which may result in
an advantage to certain participants. Compliance with governmental regulations,
delays or failure to receive regulatory approvals, or the enactment of new
regulatory requirements may negatively affect the business of telecommunication
services companies. Companies in
media
and entertainment industries can be significantly affected by
competition, particularly in formulating new products and services using new
technologies, and the cyclicality of revenues and earnings. Certain companies in
the communication services sector may be particular targets of network security
breaches, hacking and potential theft of proprietary or consumer information or
disruptions in services, which would have a material adverse effect on their
businesses.
Credit
Risk
There is a risk that the issuer
or guarantor of a debt security could go bankrupt or be unable or unwilling to
make interest payments and/or repay principal. Changes in an issuer’s financial
strength or in an issuer’s or debt security’s credit rating also may affect a
security’s value and thus have an impact on Fund performance. The degree of
credit risk for a particular security may be reflected in its credit rating.
Lower rated debt securities involve greater credit risk, including the
possibility of default or bankruptcy. Generally, the longer the maturity and the
lower the credit quality of a security, the more sensitive it is to credit
risk.
Debt
Instrument Risk
The
value of debt instruments may increase or decrease as a result of the
following: market fluctuations; changes in interest rates; actual or perceived
inability of issuers, guarantors, or liquidity providers to make scheduled
principal or interest payments; or illiquidity in debt securities markets. Debt
instruments are also impacted by political, regulatory, market and economic
developments that impact the market in general and specific economic sectors,
industries or segments of the fixed income market. In general, rising interest
rates lead to a decline in the value of debt securities and debt securities with
longer durations tend to be more sensitive to interest rate changes usually
making their prices more volatile than those of securities with shorter
durations. To the extent that interest rates rise, certain underlying
obligations may be paid off substantially slower than originally anticipated and
the value of those securities may fall. Declining interest rates may lead to
prepayment of obligations and cause reduced rates of return due to reinvestment
of interest and principal payments at lower interest rates.
Financials
Sector Risk
Performance of
companies in the financials sector are subject to extensive
governmental regulation which may limit both the amounts and types
of loans and other
financial
commitments
they
can make, the
interest rates and fees they can charge, the scope of their activities, the
prices they can charge
and the amount of
capital they must maintain.
Profitability of
such companies is largely dependent on the availability and cost of capital
funds and can fluctuate significantly when interest rates change or due to
increased competition. In addition, deterioration of
the credit markets
generally may cause an adverse impact in a broad range of markets, including
U.S.
and international
credit and interbank money markets
generally,
thereby affecting a
wide range of financial institutions and markets. Certain events in the
financials sector may cause an unusually high degree of volatility in the
financial markets, both domestic and foreign, and cause certain financial
services companies
53
Direxion
Funds Prospectus
to incur large
losses. Securities of financial services companies may experience a dramatic decline
in value when such companies experience substantial declines in the valuations
of their assets, take action to raise capital (such as the issuance of debt or
equity securities), or cease operations.
Credit losses
resulting from financial difficulties of borrowers and financial losses
associated with investment activities can negatively impact the
sector.
Insurance companies
may
be subject to severe
price competition. Adverse economic, business or political developments could
adversely affect financial institutions engaged in mortgage finance or other
lending or investing activities directly or indirectly connected to the value of
real estate. The financials sector is also a target for cyber attacks and may
experience technology malfunctions and disruptions, which have occurred more
frequently in recent years.
Healthcare
Sector Risk
The
profitability of companies in the healthcare sector may be affected by extensive, costly
and uncertain government regulation, restrictions on government reimbursement
for medical expenses, rising costs of medical products and services, pricing
pressure, changes in the demand for medical products and services, an increased
emphasis on outpatient services, limited product lines, industry innovation
and/or consolidation, changes in technologies and other market developments.
Many healthcare companies are heavily dependent on patent protection, which may
be time consuming and costly. The expiration of patents may adversely affect the
profitability of these companies. Many healthcare companies are subject to
extensive litigation based on product liability and similar claims. In
addition,
their products can
become obsolete due to industry innovation, changes in technologies or other
market developments. Many new products in the health care sector require
significant research and development and may be subject to regulatory
approvals,
all of which may be
time consuming and costly with no guarantee that any product will come to
market.
Industrials
Sector Risk
Stock
prices of issuers in the industrials sector are affected by supply and
demand both for their specific product or service and for industrials sector
products in general. Government regulation, world events, including trade
disputes, exchange rates and economic conditions, technological developments and
liabilities for environmental damage and general civil liabilities will also
affect the performance of investment in such issuers. Aerospace and defense
companies, a component of the industrials sector, can be significantly affected
by government spending policies because companies involved in this industry rely
to a significant extent on U.S. and other government demand for their products
and services. Thus, the financial condition of, and investor interest in,
aerospace and defense companies are heavily influenced by government defense
spending policies which are typically under pressure from efforts to control
government spending budgets. Transportation companies, another component of the
industrials sector, are subject to cyclical performance and therefore investment
in such companies may experience occasional sharp price movements which may
result from changes in the economy, fuel prices, labor agreements and insurance
costs. The industrials sector
may
also be adversely affected by changes or trends in commodity prices,
which may be influenced by unpredictable factors. Issuers with high carbon
intensity or high switching costs associated with the transition to low carbon
alternatives may be more impacted by climate transition risks.
Information
Technology Sector Risk
The
value of stocks of information technology companies and companies
that rely heavily on technology is particularly vulnerable to rapid changes in
technology product cycles, rapid product obsolescence, government regulation,
and competition, both domestically and internationally, including competition
from competitors with lower production costs. In addition, many information
technology companies have limited product lines, markets, financial resources or
personnel. Information technology companies and companies that rely heavily on
technology, especially those of smaller, less-seasoned companies, tend to be
more volatile and less liquid than the overall market. Information technology
companies are heavily dependent on patent and intellectual property rights, the
loss or impairment of which may adversely affect profitability. Additionally,
companies in the information technology sector may face dramatic and often
unpredictable changes in growth rates and competition for the services of
qualified personnel.
Interest
Rate Risk
Debt securities,
and securities that provide exposure to debt securities, have varying levels
of sensitivity to changes in interest rates. In addition, a Fund is subject to
the risk that interest rates may change and exhibit increased volatility, thus
affecting the performance of a Fund. Securities with longer maturities can be
more sensitive to interest rate changes,
and rising rates
normally cause the value of fixed
income securities
with longer durations
to
decline;
while falling rates
normally cause the value of fixed income securities with longer durations to
increase. An increase in interest rates may lead to heightened volatility in the
fixed-income markets and adversely affect the liquidity of certain fixed-income
investments. A decrease in fixed-income market maker capacity may act to
decrease liquidity in the fixed-income markets and act to further increase
volatility, affecting a Fund’s return.
In
addition, short-term and long-term interest rates do not necessarily move
in the same amount or the same direction. Short-term securities tend to react to
changes in short-term interest rates, and long-term securities tend to react to
changes in long-term interest rates. The impact of an interest rate change may
be significant for other asset classes as well, whether because of the impact of
interest rates on economic activity or because of changes in the relative
attractiveness of asset classes due to changes in interest rates. For instance,
higher interest rates may make investments in debt securities more attractive,
thus reducing investments in equities. The link between interest rates and debt
security prices tends to be weaker with lower-rated debt securities than with
investment-grade debt securities.
U.S.
Government Securities Risk
A
security backed by the U.S. Treasury or the full faith and credit of the
United States is guaranteed only as to the timely payment of interest and
principal when held to maturity.
Direxion
Funds Prospectus
54
The
market prices for such securities are not guaranteed and will
fluctuate. In addition, because many types of U.S. government securities trade
actively outside the United States, their prices may rise and fall as changes in
global economic conditions affect the demand for these securities. Furthermore,
not all securities issued by the U.S. government and its agencies and
instrumentalities are backed by the U.S. Treasury or the full faith and credit
of the United States. In addition, U.S. Treasury obligations may differ from
other securities in their interest rates, maturities, times of issuance and
other characteristics. Changes in the financial condition or credit rating of
the U.S government may cause the value of U.S. Treasury obligations to decline.
A downgrade of the ratings of U.S. government debt obligations could result in
higher interest rates for individual and corporate borrowers, cause disruptions
in bond markets and have a substantial negative effect on the U.S.
economy.
Large-Capitalization
Company Risk
Large-capitalization
companies typically
have significant financial resources, extensive product lines and broad markets
for their goods and/or services. However, they may be less able to adapt to
changing market conditions or to respond quickly to competitive challenges or to
changes in business, product, financial, or market conditions. Larger companies
may not be able to maintain growth at rates that may be achieved by well-managed
smaller and mid-size companies, which may affect the companies’
returns.
Micro-Capitalization
Company Risk
Micro-capitalization
companies often have limited product lines, narrower markets for their
goods and/or services and more limited managerial and financial resources than
larger, more established companies, including companies which are considered
small- or mid-capitalization. In addition, because these stocks are not well
known to the investing public, do not have significant institutional ownership
and are followed by relatively few security analysts, there will normally be
less publicly available information concerning these securities compared to what
is available for the securities of larger companies. Adverse publicity and
investor perceptions, whether based on fundamental analysis or rumor, can
decrease the value and liquidity of such securities. As a result, their
performance can be more volatile and they face greater risk of business
failure.
Mid-Capitalization
Company Risk
Mid-capitalization
companies often have narrower markets for their goods
and/or services and more limited managerial and financial resources.
Furthermore, those companies often have limited product lines, services,
markets, financial resources, less stable earnings, or are dependent on a small
management group. In addition, because these stocks are not well known to the
investing public, do not have significant institutional ownership and are
followed by relatively few security analysts, there will normally be less
publicly available information concerning these securities compared to what is
available for the securities of larger companies. Adverse publicity and investor
perceptions, whether or not based on fundamental analysis, can decrease the
value and liquidity of securities held by a Fund. As a result, the price of
mid-capitalization
companies can be more volatile and they may be less
liquid than large-capitalization companies, which could increase the volatility
of a Fund’s portfolio.
Small-
and/or Mid-Capitalization Company Risk
Small- and/or
mid-capitalization companies often have narrower markets for their goods
and/or services, less stable earnings, and more limited managerial and financial
resources. Furthermore, those companies often have limited product lines,
services, markets, financial resources or are dependent on a small management
group. Because these stocks are not well-known to the investing public, there
will normally be less publicly available information concerning these
securities. Adverse publicity and investor perceptions, whether or not based on
fundamental analysis, can decrease the value and liquidity of such securities,
resulting in more volatile performance. They also face greater risk of business
failure.
Depositary
Receipt Risk
To
the extent a Fund invests in, or has exposure to, foreign companies,
investment may be in the form of depositary receipts or other securities
convertible into securities of foreign issuers. American Depositary Receipts
(“ADRs”) are receipts typically issued by an American bank or trust company that
evidence ownership of underlying securities issued by a foreign corporation.
European Depositary Receipts (“EDRs”) are receipts issued in Europe that
evidence a similar ownership arrangement. Global Depositary Receipts (“GDRs”)
are receipts issued throughout the world that evidence a similar arrangement.
Generally, ADRs, in registered form, are designed for use in the U.S. securities
markets, and EDRs, in bearer form, are designed for use in European securities
markets. GDRs are tradable both in the United States and in Europe and are
designed for use throughout the world. Depositary receipts will not necessarily
be denominated in the same currency as their underlying securities.
Depositary
receipts may be purchased through “sponsored” or “unsponsored”
facilities. A sponsored facility is established jointly by the issuer of the
underlying security and a depositary, whereas a depositary may establish an
unsponsored facility without participation by the issuer of the depositary
security. Holders of unsponsored depositary receipts generally bear all the
costs of such facilities and the depositary of an unsponsored facility
frequently is under no obligation to distribute shareholder communications
received from the issuer of the deposited security or to pass through voting
rights to the holders of such receipts of the deposited securities.
Fund
investments in depositary receipts, which include ADRs, GDRs and EDRs,
are deemed to be investments in foreign securities for purposes of a Fund’s
investment strategy.
Foreign
Securities Risk
Foreign
instruments may involve greater risks than domestic instruments. As a
result, a Fund’s returns and NAV may be affected to a large degree by
fluctuations in currency exchange rates, interest rates, political, diplomatic
or economic conditions and regulatory requirements in other countries. The laws
and accounting, auditing, and financial reporting standards in foreign countries
typically are not as strict as
55
Direxion
Funds Prospectus
they
are in the United States, and there may be less public information
available about foreign companies.
Foreign
securities may involve additional risk, including, greater market
volatility, the availability of less reliable financial information, higher
transactional and custody costs, taxation by foreign governments, decreased
market liquidity and political instability. Certain foreign markets may rely
heavily on particular industries or foreign capital and are more vulnerable to
diplomatic developments, the imposition of economic sanctions against a
particular country or countries, organizations, entities and/or individuals,
changes in international trade patterns, trade barriers, and other
protectionists or retaliatory measures. Additionally, a Fund may be impacted by
a limitation on foreign ownership of securities, the imposition of withholding
or other taxes, restrictions on the repatriation of cash or other assets, higher
transaction and custody costs, delays in the settlement of securities,
difficulties in enforcing contractual obligations and lower levels of regulation
in the securities markets.
Index Strategy
Risk
A Fund is linked
to an underlying index maintained by a third party provider unaffiliated
with a Fund (“Index Provider”) that exercises complete control over the the
underlying index. An Index Provider may delay or change a rebalance date, which
may adversely impact the performance of a Fund and its correlation to the its
underlying index. In addition, there is no guarantee that the methodology used
by an Index Provider to identify constituents for an underlying index will
achieve its intended result or positive performance. A Fund’s underlying index
relies on various sources of information to assess the potential constituents of
its underlying index, including information that may be based upon assumptions
or estimates. There is no assurance that the sources of information are
reliable, and the Adviser does not assess the due diligence conducted by an
Index Provider with respect to the data it uses or the its underlying index’s
construction and computation processes. There is a heightened risk of unreliable
and/or inaccurate data for an underlying index that includes issuers in foreign
markets, especially emerging and frontier markets, where the markets and issuers
may be subject to less stringent regulation and accounting requirements. An
index may underperform other asset classes or similar indices. Errors in
underlying index data, underlying index computations or the construction of the
underlying index in accordance with its methodology may occur from time to time
and may not be identified and/or corrected for a period of time or at all. Such
differences may negatively or positively impact a Fund.
Unusual market
conditions may cause an Index Provider to postpone a scheduled rebalance
of the underlying index, which could adversely impact its normal or expected
composition and performance. For example, if a rebalance is postponed in a time
of market volatility, constituents that would otherwise be removed at the
rebalance, including due to changes in market capitalizations, issuer credit
ratings, or other reasons may remain and adversely impact a Fund’s performance.
Similarly, an Index Provider may carry out an
ad hoc rebalance
of the underlying index at any time, which may adversely impact Fund
performance.
Early
Close/Trading Halt Risk
An exchange or
market may close or issue trading halts on specific securities or financial
instruments.
Under such
circumstances, the ability to buy or sell certain portfolio securities or
financial instruments may be restricted, which may result in a Fund being unable
to buy or sell investments for its portfolio and may temporarily prevent
investors from buying and selling a Fund. In addition, a Fund may be unable to
accurately price its investments, may fail to achieve performance that is
correlated with its underlying index
and may incur
substantial losses.
Equity
Securities Risk
Publicly-issued
equity securities, including common stocks, are subject to
market risks that may cause their prices to fluctuate over time. Fluctuations in
the value of equity securities in which a Fund invests will cause the NAV of the
Fund to fluctuate.
High
Portfolio Turnover Risk
Monthly
rebalancing of a Fund’s holdings pursuant to its daily investment
objective causes a much greater number of portfolio transactions when compared
to most funds. In addition, there is the possibility of significantly increased
short-term capital gains (which will be taxable to shareholders as ordinary
income when distributed to them). A Fund calculates portfolio turnover without
including the short-term cash instruments or derivative transactions that
comprise the majority of a Fund’s trading. As such, if a Fund’s extensive use of
derivative instruments were reflected, the calculated portfolio turnover rate
would be significantly higher.
Market
Timing Activity Risk
Rafferty
expects a significant portion of the assets of a Fund to come from
professional money managers and investors who use a Fund as part of “asset
allocation” and “market timing” investment strategies. These strategies often
call for frequent trading to take advantage of anticipated changes in market
conditions. Frequent trading could increase the rate of a Fund’s portfolio
turnover, which involves correspondingly greater expenses to the Fund, including
brokerage commissions or dealer mark-ups/mark-downs and other transaction costs
on the sale of securities and reinvestments in other securities. Such sales also
may result in adverse tax consequences to a Fund’s shareholders from
distributions to them of net gains realized on the sales. The trading costs and
tax effects associated with portfolio turnover may adversely affect a Fund’s
performance. In addition, large movements of assets into and out of a Fund may
have a negative impact on its ability to achieve its investment objective or its
desired level of operating expenses. The risks associated with market timing
activity and high portfolio turnover will have a negative impact on longer-term
investments. Please see the “Financial Highlights” section of this Prospectus
for a Fund’s historic portfolio turnover rates.
Direxion
Funds Prospectus
56
Non-Diversification
Risk
Each Fund is classified
as
“non-diversified”
under the Investment
Company Act of 1940,
as amended.
This
means it has the
ability to invest a relatively high percentage of its assets in the securities
of a small number of issuers or in financial instruments with a single
counterparty or a few counterparties. This may increase a Fund’s volatility and
increase the risk that a Fund’s performance will decline based on the
performance of a single issuer or the credit of a
single counterparty
and
make a Fund more
susceptible to risks associated with a single economic,
political or
regulatory occurrence than a diversified fund.
Tax
Risk
To
qualify as a regulated investment company (“RIC”) under Subchapter M of
the Internal Revenue Code of 1986, as amended, a Fund must meet certain
requirements concerning the source of its income for each taxable year, meet
certain asset diversification tests at the end of each taxable quarter, and meet
annual distribution requirements. If in any year, a Fund were to fail to qualify
as a RIC, and it was ineligible to, or was not able to, cure such failure, a
Fund would be taxed in the same manner as an ordinary corporation subject to
U.S. federal income tax on all of its income at the fund level as well as a tax
to shareholders on such income when distributed by a Fund as an ordinary
dividend. The resulting taxes could substantially reduce a Fund’s net assets and
the amount of income available for distribution. In addition, to requalify as a
RIC, a Fund would be required to recognize unrealized gains, pay substantial
taxes and interest and make certain distributions.
Other
Risks of the Funds
Investment
Strategy Implementation Risk
The Adviser
utilizes a quantitative methodology to select investments for each Fund.
Although this methodology is designed to correlate each Bull Fund's daily
performance with 175% of the daily performance of its underlying index and the
Bear Fund’s daily performance with -175% of the performance of its underlying
index, there is no assurance that the implementation of such methodology will be
successful and will enable a Fund to achieve its investment
objective.
Aggressive
Investment Technique Risk
Using
investment techniques that may be considered aggressive, such
as futures contracts, options and swap agreements, includes the risk of
potentially dramatic changes (losses) in the value of the instruments, imperfect
correlations between the price of the instrument and the underlying asset,
security or index, and volatility of a Fund.
Commodity
Pool Registration Risk
The
Funds are considered commodity pools, and therefore each is subject
to regulation under the Commodity Exchange Act and CFTC rules. Compliance with
such additional laws, regulations and enforcement policies may potentially
increase compliance costs and may affect the operations and financial
performance of the Funds.
Cybersecurity
Risk
The
increased use of technologies, such as the internet, to conduct business
increases the operational, information security and related “cyber” risks both
directly to a Fund and through its service providers. Similar types of cyber
security risks are also present for issuers of securities in which a Fund may
invest, which could result in material adverse consequences for such issuers.
Unlike many other types of risks faced by a Fund, these risks typically are not
covered by insurance. Cyber incidents can result from deliberate attacks or
unintentional events. Cyber incidents may include, but are not limited to,
gaining unauthorized access to digital systems (e.g., through
“hacking” or malicious software coding) for purposes of misappropriating assets
or sensitive information, corrupting data, causing physical damage to computer
or network systems, or causing operational disruption. Cyber attacks may also be
carried out in a manner that does not require gaining unauthorized access, such
as causing denial-of-service attacks on websites (i.e., efforts to
make network services unavailable to intended users).
Failures
or breaches of the electronic systems of a Fund, a Fund’s adviser,
distributor, other service providers, counterparties, securities trading venues,
or the issuers of securities in which a Fund invests have the ability to cause
disruptions and negatively impact a Fund’s business operations, potentially
resulting in financial losses to a Fund and its shareholders. Cyber attacks may
also interfere with the Fund’s calculation of its NAV, result in the submission
of erroneous trades , and could lead to violations of applicable privacy and
other laws, regulatory fines, penalties, reputational damage, reimbursement or
other compensation costs and/or additional compliance costs. While a Fund has
established business continuity plans, there are inherent limitations in such
plans, including the possibility that certain risks have not been identified and
that prevention and remediation efforts will not be successful. Furthermore, a
Fund cannot control the cyber security plans and systems of a Fund’s service
providers or issuers of securities in which a Fund invests.
Investment
Risk
An
investment in a Fund is not a deposit in a bank and is not insured or
guaranteed by the Federal Deposit Insurance Corporation or any other government
agency. When you sell your Shares, they could be worth less than what you paid
for them.
Market
Disruption Risk
Natural or
environmental disasters, such as earthquakes, fires, floods, hurricanes, and
tsunamis and widespread disease, including pandemics and epidemics have been and
can be highly disruptive to economies and markets. Any such disruption could
lead to increased market volatility and significant market losses. Such natural
disasters and health crises tend to exacerbate political, social and economic
risks, and may result in significant breakdowns, delays, shutdowns, social
isolation, and other disruptions to important global, local and regional supply
chains. A climate of uncertainty or panic may prevail and may adversely affect
global, regional,
57
Direxion
Funds Prospectus
and local
economies and reduce the availability of potential investment opportunities, and
increases the difficulty of performing due diligence and modeling market
conditions, potentially reducing the accuracy of financial projections. Adverse
effects may be more pronounced for developing or emerging market countries that
have less established health care systems. How long such events will last, their
severity and consequences cannot be predicted.
Additionally,
war, military conflicts, sanctions, acts of terrorism, sustained elevated inflation,
supply chain issues or other events could have a significant negative impact on
global financial markets and economies. Russia’s military incursions in Ukraine
have led to, and may lead to additional sanctions being levied by the United
States, European Union and other countries against Russia. Additionally, the
Israel-Hamas war has increased volatility in the Middle East. Ongoing
hostilities between countries could result in additional widespread conflict and
could have a severe adverse effect on the respective region and certain markets.
Sanctions on Russian exports could have a significant adverse impact on the
Russian economy and related markets and could affect the value of a Fund’s
investments, even beyond any direct exposure a Fund may have to the region or to
adjoining geographic regions. The extent and duration of ongoing military
action, sanctions and resulting market disruptions are impossible to predict,
but could have a severe adverse effect on either region, including significant
negative impacts on the economy and the markets for certain securities and
commodities, such as oil and natural gas. How long such tensions and related
events will last cannot be predicted. These tensions and any related events
could have significant impact on a Fund’s performance and the value of an
investment in a Fund.
Money
Market Instrument Risk
Money
market instruments, including money market funds, depositary
accounts and repurchase agreements may be
used
for cash management purposes. Money market funds may be subject to
credit risk with respect to the short-term debt instruments in which they
invest. Depository accounts may be subject to credit risk with respect to the
financial institution in which the depository account is held. Repurchase
agreements are contracts in which a seller of securities agrees to buy the
securities back at a specified time and price. Repurchase agreements may be
subject to market and credit risk related to the collateral securing the
repurchase agreement. Money market instruments may also be subject to credit
risks associated with the instruments in which they invest. There is no
guarantee that money market instruments will maintain a stable value, and they
may lose money.
Operational
Risk
A Fund and its
service providers are subject to operational risks arising from, among other
things, human error, systems and technology errors and disruptions, failed or
inadequate controls, and fraud. These errors may adversely affect a Fund’s
operations, including its ability to execute its investment process or calculate
or disseminate its net asset value in a timely manner. While a Fund seeks to
minimize such events through controls and oversight, there may still be failures
and a Fund may be unable to recover any damages associated with such failures.
These failures may have a material adverse effect on a Fund’s
returns.
Regulatory
Risk
Each Fund is
subject to the risk that a change in U.S. law and related regulations will
impact the way a Fund operates, increase the particular costs of a Fund’s
operations and/or change the competitive landscape. Additional legislative or
regulatory changes could occur that may materially and adversely affect each
Fund.
Direxion
Funds Prospectus
58
About
Your Investment
Share
Price of the Funds
A
fund’s share price is known as its NAV. Each Fund’s share price is calculated as
of the close of regular trading on the NYSE, usually 4:00 p.m.
Eastern Time (“Valuation Time”), each day the NYSE is open for business
(“Business Day”). The NYSE is open for business Monday through Friday, except in
observation of the following holidays: New Year’s Day, Martin Luther King, Jr.
Day, Presidents’ Day, Good Friday, Memorial Day, Juneteenth National
Independence Day, Independence Day, Labor Day, Thanksgiving Day and Christmas
Day. The NYSE may close early on the Business Day before each of these holidays
and on the day after Thanksgiving Day. NYSE holiday schedules are subject to
change without notice.
The
value of each Fund’s assets that trade in markets outside the United States or
in currencies other than the U.S. Dollar may fluctuate on
days that foreign markets are open but the Fund is not open for
business.
All
shareholder transaction orders received in good form by a Fund’s transfer agent
or an authorized financial intermediary by the time that
each Fund calculates its NAV (as described above) will be processed at that
day’s NAV, plus any applicable sales charges. Transaction orders received after
the time that a Fund calculates its NAV will receive the next calculated NAV,
plus any applicable sales charges.
Share
price is calculated by dividing a Fund’s net assets by its shares outstanding.
Portfolio securities and other assets are valued chiefly by
market prices from the primary market in which they are traded. Under Rule 2a-5
under the 1940 Act, a market quotation is readily available when that “quotation
is a quoted price (unadjusted) in active markets for identical investments that
the fund can access at the measurement date, provided that a quotation will not
be readily available if it is not reliable.” Each Fund uses the following
methods to price securities or assets held in its portfolio with readily
available market quotations:
•
Equity securities
listed and traded principally on any domestic or foreign national securities
exchange are valued at the last sales price. Exchange-traded funds are valued at
the last sales price prior to Valuation Time. Securities primarily traded in the
NASDAQ Global Market® are valued using
the NASDAQ® Official Closing
Price. Over-the counter securities are valued at the last sales price in the
over-the-counter market;
•
Futures contracts
are valued at (1) the settlement prices established each day on the exchange on
which they are traded if the settlement price reflects trading prior to the
Valuation Time, (2) at the last sales price prior to the Valuation Time if the
settlement prices established by the exchange reflects trading after Valuation
Time, or (3) at the last sales price of the exchange prior to the Valuation
Time;
•
Options are
valued at the composite price, using National Best Bid and Offer quotes;
and
•
Securities and
other assets for which market quotations are unavailable or unreliable are
valued at fair value estimates as determined by the Adviser pursuant to its fair
valuation policies.
Fair
Value Pricing. When
a market quotation is not readily available or is unreliable, the Board is
responsible for determining in good faith the fair value of the portfolio
security or other asset. Pursuant to Rule 2a-5, the Board designated the
responsibility for fair valuation to the Adviser as its valuation designee
(“Valuation Designee”). Fair value determinations are made in good faith in
accordance with procedures adopted by the Adviser and approved by the Board,
which set forth the methodologies by which a portfolio security or other asset
will be fair valued. The Adviser may utilize fair valuation services of a
pricing service to obtain a fair value for certain portfolio securities or other
assets as well.
An investment
that relies on Level 2 or Level 3 inputs according to ASC 820, such as swap
agreements, is required to be fair valued as such investments
do not have readily available market quotations by definition. Swap agreements
are valued based on the closing value of the underlying reference instrument.
Additionally, the Adviser will fair value a portfolio security or other asset if
there is not a readily available market quotation, which may occur in the
following situations: (1) to the extent that a Fund holds foreign securities,
when foreign markets close before the NYSE opens or may not be open for business
on the same calendar days as a Fund; (2) if there has been a significant event
in the markets that makes the price of a portfolio security or asset unreliable;
(3) if there is a lack of an active market, such as the market for certain
preferred securities or for corporate bonds; and (4) if trading in a security is
limited during the trading day and a limited number of quotes are available or
If trading in a security is halted during a trading day and does not resume
prior to the closing of the exchange or other market.
Fair
valuation determinations of portfolio securities or other assets introduce an
element of subjectivity to pricing of such portfolio
securities or other assets. As a result, the price of a security or other asset
determined through fair valuation techniques may differ from the price quoted or
published by other sources and may not accurately reflect the market value of
the security when trading resumes. If a reliable market quotation becomes
available for a security formerly valued through fair valuation techniques, the
Adviser compares the market quotation to the fair value price to evaluate the
effectiveness of the Adviser’s fair valuation procedures.
59
Direxion
Funds Prospectus
Rule
12b-1 Fees
Each
Fund has adopted an Investor Class distribution plan under Rule 12b-1 (the
“Investor Class Plan”) pursuant to which each Fund pays
for distribution and services provided to Fund shareholders. Because these fees
are paid out of the Fund’s assets on an on-going basis, over time these fees
will increase the cost of your investment and may cost you more than paying
other types of sales charges.
Pursuant
to its Investor Class Plan, each Fund may pay an annual Rule 12b-1 fee of up to
1.00% of its average daily net assets. The Board
of Trustees has currently authorized each Fund to pay a maximum annual Rule
12b-1 fee of 0.25% of its average daily net assets.
Under
an agreement with the Funds, your registered investment adviser, financial
planner, broker-dealer or other financial intermediary
(“Financial Adviser”), may receive Rule 12b-1 fees from the Funds. In exchange,
your Financial Adviser may provide a number of services, such as: placing your
orders and issuing confirmations; providing investment advice, research and
other advisory services; handling correspondence for individual accounts; acting
as the sole shareholder of record for individual shareholders; issuing
shareholder statements and reports; executing daily investment “sweep”
functions; and other shareholder services as described in the Funds' Statement
of Additional Information (“SAI”). For more information on these and other
services, you should speak directly to your Financial Adviser. Your Financial
Adviser may charge additional account fees for services beyond those specified
above.
Additional
Payments to Financial Intermediaries
The
Adviser (and its affiliates) may make substantial payments to financial
intermediaries and service providers for distribution and/or
shareholder servicing activities, out of their own resources, including the
profits from the advisory fees the Adviser receives from the Funds. These
payments may be made to financial intermediaries for marketing, promotional or
related expenses. These payments, sometimes referred to as “revenue sharing,” do
not change the price paid by investors to purchase shares of the Funds or the
amount investors in the Funds would receive as proceeds from the redemption of
such shares and will not increase the expenses of investing in the
Funds.
Examples
of “revenue sharing” payments include, but are not limited to, payment to
financial institutions for “shelf space” or access to a
third party platform or portfolio offering list or other marketing programs,
including, but not limited to, inclusion of a Fund on preferred or recommended
sales lists, mutual fund “supermarket” platforms and other formal sales
programs; granting the Adviser access to the financial institution’s sales
force; granting the Adviser access to the financial institution’s conferences
and meetings; assistance in training and educating the financial institution’s
personnel; and obtaining other forms of marketing support. Revenue sharing
payments also may be made to financial intermediaries that provide various
services to the Funds, including but not limited to, record keeping, shareholder
servicing, transaction processing, sub-accounting services and other
administrative services. The Adviser may make other payments or allow other
promotional incentives to financial intermediaries to the extent permitted by
the SEC, by the Financial Industry Regulatory Authority, Inc. (“FINRA”) and by
other applicable laws and regulations.
The
level of revenue sharing payments made to financial intermediaries may be a
fixed fee or based upon one or more of the following
factors: gross sales, current assets and/or number of accounts of a Fund
attributable to the financial institution, or other factors as agreed to by the
Adviser and the financial institution or any combination thereof. The amount of
these revenue sharing payments is determined at the discretion of the Adviser
from time to time, may be substantial, and may be different for different
financial institutions depending upon the services provided by the financial
institution. Such payments may provide an incentive for the financial
institution to make shares of a Fund available to its customers and may allow
the Funds greater access to the financial institution’s customers.
Shareholder
Services Guide
You
may invest in the Funds through traditional investment accounts, including
Automatic Investment Plans, individual retirement
accounts (“IRAs”) (including Roth IRAs), self-directed retirement plans or
company-sponsored retirement plans. Applications and descriptions of any service
fees for retirement or other accounts are available directly from the Funds. You
may invest directly with the Funds or through certain financial intermediaries.
Any transaction effected through a financial intermediary may be subject to a
processing fee. The minimum initial investment is set forth below and may be
invested in as many of the Funds as you wish, subject to a minimum investment in
each Fund of $25,000. Rafferty may waive these minimum requirements at its
discretion. Contact Rafferty if you need additional information or
assistance.
Shares
of the Funds have not been registered for sale outside of the United States. A
Fund generally does not sell shares to investors
residing outside of the United States, even if they are United States citizens
or lawful permanent residents, except to investors with United States military
APO or FPO addresses.
Each
Fund offers the option to submit purchase orders through your financial
intermediary or to send purchase orders to a Fund as
described in the table below.
Direxion
Funds Prospectus
60
|
Purchase
Methods |
Initial
Purchases |
Subsequent
Purchases |
|
Minimum
Investment:
Traditional
Investment
Accounts |
$25,000 or a
lesser amount if you are a client
of a
securities dealer, bank or other financial
institution.* |
$500 |
|
Minimum
Investment:
Retirement
Accounts
(Traditional,
Roth and Spousal
IRAs) |
$25,000 or a
lesser amount if you are a client
of a
securities dealer, bank or other financial
institution.* |
$500 |
|
By
Mail |
•Complete
and sign your application.
Remember
to include all required
documents
(if any).
•Make
a check payable to “Direxion Funds”
and
indicate the Fund you would like to
purchase.
•Send
the signed application and check to:
Direxion
Funds
P.O.
Box 701
Milwaukee,
Wisconsin 53201-0701
(Do
not send via express mail or overnight
delivery
to the P.O Box address).
(Each
Fund does not consider the U.S. Postal
Service
or other independent delivery services
to
be their agents. Therefore, deposit in the
mail
or with such services, or receipt at U.S.
Bancorp
Fund Services, LLC’s post office box,
of
purchase orders or redemption requests
does
not constitute receipt by the transfer
agent
of the Funds.) |
•Complete
an Investment Slip or provide
written
instructions with your name,
account
number and the Fund in which you
would
like to invest.
•Make
a check payable to “Direxion Funds”
and
indicate the Fund you would like to
purchase
and your account number.
•Send
the Investment Slip and check to:
Direxion
Funds
P.O.
Box 701
Milwaukee,
Wisconsin 53201-0701
(Do
not send via express mail or overnight
delivery
to the P.O Box address).
(Each
Fund does not consider the U.S. Postal
Service
or other independent delivery services
to
be their agents. Therefore, deposit in the
mail
or with such services, or receipt at U.S.
Bancorp
Fund Services, LLC’s post office box,
of
purchase orders or redemption requests
does
not constitute receipt by the transfer
agent
of the Funds.) |
|
By
Wire |
•Contact
Direxion at (800) 851-0511 to make
arrangements
to send in your application
via
facsimile or mail.
•Fax
the application according to
instructions
the representative will give
you.
•Mail
the original application to:
Direxion
Funds
P.O.
Box 701
Milwaukee,
Wisconsin 53201-0701
•Call
(800) 851-0511 to: (a) confirm receipt of
the
application; (b) receive an account
number;
and (c) receive a confirmation
number.
Wired
funds must be received prior to market
close
to be eligible for same day pricing. The
Funds
and U.S. Bank, N.A. are not responsible
for
the consequences of delays resulting from
the
banking or Federal Reserve wire system or
from
incomplete wiring instructions. |
•Contact
Direxion at (800) 851-0511 with
your
account number, the amount wired
and
the Fund(s) in which you want to
invest.
•You
will receive a confirmation number;
retain
your confirmation number.
•Instruct
your bank to wire the money to:
US
Bank NA, Milwaukee, WI 53202
ABA
075000022
Credit:
US Bancorp Fund Services, LLC
ACCT
# 112-952-137
FFC:
Direxion Funds
(Your
name and Direxion Account
Number)
Wired
funds must be received prior to market
close
to be eligible for same day pricing. The
Funds
and U.S. Bank, N.A. are not responsible
for
the consequences of delays resulting from
the
banking or Federal Reserve wire system or
from
incomplete wiring instructions.
|
61
Direxion
Funds Prospectus
|
Purchase
Methods |
Initial
Purchases |
Subsequent
Purchases |
|
By
Telephone |
You
may not make initial investments by
telephone. |
•If
you did not decline telephone options on
your
account application, your account has
been
open for at least 7 business days, and
you
have banking information established
on
your account, you may purchase shares
by
telephone.
•The
minimum telephone purchase is equal
to
the subsequent investment purchase
amount
for your account type.
•Contact
Direxion at (800) 851-0511 to
purchase
additional shares of the Funds.
Orders
will be accepted via the electronic
funds
transfer through the Automated
Clearing
House (“ACH”) network.
•Shares
will be purchased at the NAV
calculated
on the day your order is placed
provided
that your order is received prior to
market
close. |
|
Through
Financial
Intermediaries |
Contact
your financial intermediary. |
Contact
your financial intermediary. |
*
The Adviser may set
different investment minimums for certain securities dealers, banks and other
financial institutions that provide certain shareholder services or omnibus
processing for the Funds in fee-based mutual fund programs.
Contact
Information
|
By
Telephone |
(800)
851-0511 |
|
Fax |
(Faxes
may be accepted, but must be pre-authorized by a representative. Please
call (800) 851-0511
to
receive authorization and the fax number.) |
|
Internet |
www.direxion.com |
|
Regular
Mail |
Direxion
Funds
P.O.
Box 701
Milwaukee,
Wisconsin 53201-0701 |
|
Overnight
Mail |
Direxion
Funds
Mutual
Fund Services - 3rd Floor
615
East Michigan Street
Milwaukee,
Wisconsin 53202 |
Shares
of each Fund are redeemable. If you opened your shareholder account through a
financial intermediary, you will ordinarily submit
your exchange or redemption order through that financial intermediary. You may
exchange or redeem Fund shares as described in the following table.
Instructions
for Exchanging or Redeeming Shares
|
By
Mail |
Send
written instructions sufficient to process your request to:
Direxion
Funds
P.O.
Box 701
Milwaukee,
Wisconsin 53201-0701 |
|
By
Telephone |
(800)
851-0511 for Individual Investors
(877)
437-9363 for Financial Professionals |
|
By
Internet |
•Log
on to www.direxion.com. Establish an account ID and password by following
the instructions
on
the site.
•Follow
the instructions on the site. |
|
Through
Financial
Intermediaries |
Contact
your financial
intermediary. |
Direxion
Funds Prospectus
62
Account
and Transaction Policies
Payment
for Shares. All purchases
must be made in U.S. Dollars through a U.S. bank. The Funds will not accept
payment in cash or money orders. In addition, to prevent check fraud, each Fund
does not accept third party checks, U.S. Treasury checks, credit card checks,
traveler’s checks, or starter checks for the purchase of shares. We are unable
to accept post-dated checks or any conditional order or payment. If your check
does not clear, you will be charged a $25.00 fee. In addition, you may be
responsible for losses sustained by the Funds for any returned
payment.
You will receive
written confirmation by mail, but we do not issue share
certificates.
Anti-Money
Laundering Program. The Funds'
transfer agent will verify certain information from investors as part of the
Funds' anti-money laundering program.
The
USA PATRIOT Act of 2001 requires financial institutions, including the Funds, to
adopt certain policies and programs to prevent money
laundering activities, including procedures to verify the identity of customers
opening new accounts. When completing a new account application, you will be
required to supply your full name, date of birth, social security number and
permanent street address to assist in verifying your identity. If you are
opening the account in the name of a legal entity (e.g., partnership,
limited liability company, business trust, corporation, etc.), you must also
supply the identity of the beneficial owners. Mailing addresses containing only
a P.O. Box will not be accepted. Until such verification is made, the Funds may
temporarily limit additional share purchases. In addition, the Funds may limit
additional share purchases or close an account if they are unable to verify a
shareholder’s identity. As required by law, the Funds may employ various
procedures, such as comparing the information to fraud databases or requesting
additional information or documentation from you, to ensure that the information
supplied by you is correct.
If
a Fund does not have a reasonable belief of the identity of a shareholder, the
account will be rejected or the shareholder will not be
allowed to perform a transaction on the account until such information is
received. The Funds may also reserve the right to close the account within five
business days if clarifying information and/or documentation is not
received.
Good
Form. Good form means
that your purchase (whether direct or through a financial intermediary) is
complete and contains all necessary information, has all supporting
documentation (such as trust documents, beneficiary designations, proper
signature guarantees, IRA rollover forms, etc.) and is accompanied by sufficient
purchase proceeds. For a purchase request to be in good form, it must include:
(1) the name of the Fund; (2) the dollar amount or share amount to be purchased;
and (3) your purchase application or investment stub. An application that is
sent to the transfer agent does not constitute a purchase order until the
transfer agent processes the application and receives correct payment by check
or wire transfer. A Fund does not consider the U.S. Postal Service or other
independent delivery services to be its agents. Therefore, deposit in the mail
or with such services, or receipt at U.S. Bancorp Fund Services, LLC’s post
office box, of purchase applications or redemption requests does not constitute
receipt by the transfer agent of the Fund. Receipt of purchase orders or
redemption requests is based on when the order is received at the Transfer
Agent’s offices.
Certain
transactions through a financial intermediary may not be deemed in good form if
such financial intermediary failed to properly
notify the Funds of such trade or trades. In particular, financial
intermediaries that transact in shares of the Funds through the Fundserv system
must, in many cases, notify the Funds of trades before placing them in the
Fundserv system. In the event that a financial intermediary transacts in shares
of the Funds through the Fundserv system without notifying the Funds of such
trades in advance, such transaction may be deemed not to have been received in
good form. In practice, this means that a confirmation from a financial
intermediary is not binding on the Funds. In the event that a trade is deemed
not to have been received in good form, for whatever reason, a purchase,
redemption or exchange request may be rejected or canceled and, in the event of
a redemption which is canceled, the Funds shall have the right to a return of
proceeds. Cancellation of a trade is processed at the NAV at which the trade was
originally received and is ordinarily completed the next business day. Please
contact your financial intermediary to determine how it processes transactions
in shares of the Funds.
Financial
Intermediaries. If you opened
your shareholder account through a financial intermediary, you will ordinarily
submit your transaction orders through that financial intermediary. Financial
intermediaries are responsible for placing orders promptly with the Funds and
forwarding payment promptly, as well as ensuring that you receive copies of the
Funds' Prospectus. Financial intermediaries may charge fees for the services
they provide to you in connection with processing your transaction order or
maintaining your account with them. Each intermediary also may have its own
rules about share transactions, limits on the number of share transactions you
are permitted to make in a given time period, and may have earlier cut-off times
for processing your transaction. For more information about your financial
intermediary’s rules and procedures, you should contact your financial
intermediary directly. In addition, Rafferty may, from time to time, at its own
expense, compensate financial intermediaries for distribution or marketing
services.
Order
Policies. There are
certain times when you may be unable to sell shares of the Funds or proceeds may
be delayed. This may occur during emergencies, unusual market conditions or when
a Fund cannot determine the value of its assets or sell its holdings. A Fund
reserves the right to reject any purchase order or suspend offering of its
shares. Generally, the Funds may reject a purchase if it is disruptive to the
efficient management of the Funds.
63
Direxion
Funds Prospectus
Telephone
Transactions. For your
protection, the Funds may require some form of personal identification prior to
accepting your telephone request such as verification of your social security
number, account number or other information. If an account has more than one
owner or authorized person, the Funds will accept telephone instructions from
any one owner or authorized person. We also may record the conversation for
accuracy. During times of unusually high market activity or extreme market
changes, you should be aware that it may be difficult to place your request in a
timely manner. Telephone trades must be received by or prior to market close.
Please allow sufficient time to place your telephone transaction. Telephone
redemption and exchange transaction privileges are automatically granted, unless
you declined such privileges on your account application. If you previously
declined telephone privileges and would like to add this option to your account,
please contact the Funds at (800) 851-0511 for instructions. The maximum amount
that may be redeemed by telephone is $100,000. Once a telephone transaction has
been placed, it cannot be canceled or modified after the close of regular
trading on the NYSE (generally, 4:00 p.m., Eastern Time).
Automatic
Investment Plan. For your
convenience, each Fund offers an Automatic Investment Plan (“AIP”). Under the
AIP, after you make your initial minimum investment of $25,000, you authorize
the Funds to withdraw the amount you wish to invest from your personal bank
account on a monthly basis. The AIP requires a minimum monthly investment of
$500. If you wish to participate in the AIP, please complete the “Automatic
Investment Plan” section on the account application or call the Funds at (800)
851-0511 if you have any questions. In order to participate in the AIP, your
bank or financial institution must be a member of the ACH network. The Funds may
terminate or modify this privilege at any time. You may change your investment
amount or terminate your participation in the AIP at any time by notifying the
Funds' transfer agent by telephone or in writing, five days prior to the
effective date of the next transaction. A fee, currently $25, will be imposed if
your AIP transaction is returned.
Signature
Guarantees. In certain
instances when you sell shares of the Funds, we will need your signature
guaranteed. Signature guarantees will generally be accepted from domestic banks,
brokers, dealers, credit unions, national securities exchanges, registered
securities associations, clearing agencies and savings associations, as well as
from participants in the New York Stock Exchange Medallion Signature Program and
the Securities Transfer Agents Medallion Program (“STAMP”). A notary public
cannot guarantee signatures. Your signature must be guaranteed, by either a
Medallion program member or a non-Medallion program member, if:
•
You are changing
your account ownership;
•
When a redemption
request is received by the transfer agent and the account address has changed
within the last 30 calendar days;
•
The redemption
proceeds are payable or sent to any person, address or bank account other than
the one listed on record with the Funds;
•
The sale is
greater than $100,000; or
•
There are other
unusual situations as determined by the Funds' transfer agent.
Non-financial
transactions including establishing or modifying certain services on an account
may require a signature guarantee, signature
verification or other acceptable signature authentication from a financial
institution source. A Fund may waive any signature guarantee requirement at its
discretion.
Exchange
Policies. You may exchange
Investor Class shares of your current Fund(s) for Investor Class shares of any
other Fund (as well as other Funds advised by Rafferty not offered in this
Prospectus) at the next determined NAV after receipt of your order in good form
without any charges. The Funds can only honor exchanges between accounts
registered in the same name and having the same address and taxpayer
identification number. If your exchange establishes a new position in a Fund,
you must exchange at least $1,000 or, if your account value is less than that,
your entire account balance will be exchanged. You may exchange by telephone
unless you declined telephone exchange privileges on your account
application.
Redemption
Proceeds. Redemption
proceeds from any sale of shares will normally be sent within seven days from
the time a Fund receives your request in good order. A redemption request will
be considered in good order if: 1) the number or amount of shares and the class
of shares to be redeemed and shareholder account number have been indicated; and
2) any written request is signed by a shareholder and by all co-owners of the
account with exactly the same name or names used in establishing the account.
For investments that have been made by check or ACH, payment on sales requests
may be delayed until the Funds' transfer agent is reasonably satisfied that the
purchase payment has been collected by a Fund, which may require up to 10
calendar days. Your proceeds will be sent via check, wire or electronic funds
transfer through the ACH network using the address or bank account listed on the
transfer agent’s records. You will be charged a wire transfer fee of $15.00,
which will be deducted from your account balance on dollar specific redemption
requests or from the proceeds on share specific requests. This fee is in
addition to any fees that may be imposed by your bank. Your proceeds will be
wired only to the bank listed on the transfer agent’s records. There is no
charge for payment sent through the ACH network and proceeds are generally
available within 2 to 3 days. Shareholders who have an IRA or other retirement
plan must indicate on their written redemption request whether to withhold
federal income tax. Redemption requests failing to indicate an election not to
have tax withheld will generally be subject to 10% withholding. Each Fund also
offers a Systematic Withdrawal Plan for shareholders who require periodic
payments, such as those from IRAs. For more information on this option, please
contact the Funds at (800) 851-0511.
Direxion
Funds Prospectus
64
Each
Fund typically expects to meet redemption requests by paying out available cash
or proceeds from selling portfolio holdings, which
may include cash equivalent portfolio holdings. In stressed market conditions
and other appropriate circumstances, redemption methods may include borrowing
funds or redeeming in kind. Each Fund may stop selling its shares and postpone
redemption payments at times when the NYSE is closed or has restricted trading
or the SEC has determined that an emergency condition exists.
Redemption
In-Kind. Each Fund
reserves the right to pay redemption proceeds to you in whole or in part by a
distribution of securities from each Fund’s portfolio. It is not expected that
the Funds would do so except in unusual circumstances. If a Fund pays your
redemption proceeds by a distribution of securities, you could incur brokerage
or other charges in converting the securities to cash and will bear any market
risks associated with such securities until they are converted into
cash.
Short-Term
Trading. Each Fund
anticipates that a significant portion of its assets will come from professional
money managers and investors who use the Funds as part of their “asset
allocation” and/or “market timing” investment strategies. These strategies often
call for frequent trading to take advantage of anticipated changes in market
conditions.
Frequent
trading increases the rate of the Funds' portfolio turnover, which increases the
overall expenses of managing the Funds, due to
increased brokerage commissions or dealer mark-ups/mark-downs and other
transaction costs on the sale of securities and reinvestments in other
securities. In addition, frequent trading may dilute the value of Fund shares
held by long-term shareholders and may interfere with the efficient management
of the Funds' portfolios. Although each Fund reserves the right to reject any
purchase orders or suspend the offering of Fund shares, each Fund does not
currently impose any trading restrictions on Fund shareholders nor actively
monitor for trading abuses. The Funds' Board of Trustees has approved the
short-term trading policy of the Funds. The costs associated with the Funds'
portfolio turnover will have a negative impact on longer-term investors as noted
previously in the Prospectus.
Low
Balance Accounts. If your total
account balance falls below $10,000 due to withdrawals, then we may sell your
shares of the Funds. We will inform you in writing 30 days prior to selling your
shares. If you do not bring your total account balance up to $10,000 within 30
days, we may sell your shares and send you the proceeds. We will not sell your
shares if your account value falls due to market fluctuations.
Electronic
Delivery of Reports. Fund
shareholders can save paper by electing to receive their account documents by
e-mail in place of paper copies. You may choose electronic delivery
(“E-Delivery”) for Prospectuses, supplements, Annual and Semi-Annual Reports. To
enroll in E-Delivery you can opt-in when completing a direct account application
with Direxion Funds. You can also register, cancel, change your e-mail address
or change your consent options by logging onto
www.direxion.com/edelivery.
Householding. In an effort to
decrease costs, each Fund intends to reduce the number of duplicate prospectuses
and Annual and Semi-Annual Reports you receive by sending only one copy of each
to those addresses shared by two or more accounts and to shareholders we
reasonably believe are from the same family or household. Once implemented, if
you would like to discontinue householding for your accounts, please call
toll-free at (800) 851-0511 to request individual copies of these documents.
Once a Fund receives notice to stop householding, we will begin sending
individual copies thirty days after receiving your request. This policy does not
apply to account statements.
Shareholder
Inactivity. Under certain
circumstances, if no activity occurs in an account within a time period
specified by state law, your shares in a Fund may be transferred to that
state.
Lost
Shareholder. It is important
that the Funds maintain a correct address for each investor. An incorrect
address may cause an investor’s account statements and other mailings to be
returned to the Funds. Based upon statutory requirements for returned mail, each
Fund will attempt to locate the investor or rightful owner of the account. If a
Fund is unable to locate the investor, then it will determine whether the
investor’s account can legally be considered abandoned. Each Fund is legally
obligated to escheat (or transfer) abandoned property to the appropriate state’s
unclaimed property administrator in accordance with statutory requirements. The
investor’s last known address of record determines which state has jurisdiction.
Investors with a state of residence in Texas have the ability to designate a
representative to receive legislatively required unclaimed property due
diligence notifications. Please contact the Texas Comptroller of Public Accounts
for further information.
Management
of the Funds
Rafferty
provides investment management services to the Funds. Rafferty has been managing
investment companies since 1997. Rafferty is located at 1301
Avenue of the Americas (6th Avenue), 28th Floor, New York, New York 10019. As of
August 31, 2023, the Adviser had approximately $32.5 billion in assets under
management.
Under
an investment advisory agreement between the Trust and Rafferty, each Fund pays
Rafferty a fee at an annualized rate based on a
percentage of its average daily net assets of 0.75%.
For the fiscal
year ended August 31, 2023, the Adviser received net
management fees as a percentage of average daily net assets from each Fund as
follows:
65
Direxion
Funds Prospectus
|
Fund |
Percentage |
|
Direxion
Monthly S&P 500® Bull
1.75X Fund |
0.66% |
|
Direxion
Monthly NASDAQ-100® Bull
1.75X Fund |
0.73% |
|
Direxion
Monthly Small Cap Bull 1.75X Fund |
0.38% |
|
Direxion
Monthly 7-10 Year Treasury Bull 1.75X Fund |
0.39% |
|
Direxion
Monthly 7-10 Year Treasury Bear 1.75X Fund |
0.01% |
A discussion
regarding the basis on which the Board of Trustees approved the investment
advisory agreement for the Funds is included in the Funds' Annual
Report for the fiscal year ended August 31, 2023.
Rafferty has
entered into an Operating Expense Limitation Agreement with each Fund. Under
this Operating Expense Limitation Agreement, Rafferty has
contractually agreed to waive all or a portion of its management fee and/or
reimburse each Fund for Other Expenses through September 1, 2025, to the extent that a Fund’s
Total Annual Fund Operating Expenses exceed 1.35% of the Fund’s average daily
net assets (excluding, as applicable, among other expenses, taxes, swap
financing and related costs, acquired fund fees and expenses, dividends or
interest on short positions, other interest expenses, brokerage commissions and
extraordinary expenses).
Any
contractual expense waiver or reimbursement is subject to recoupment by the
Adviser within three years after the expense was
waived/reimbursed only if Total Annual Fund Operating Expenses fall below the
lesser of this percentage limitation and any percentage limitation in place at
the time the expense was waived/reimbursed. Rafferty may pay, reimburse or
otherwise assume one or more of the excluded expenses, in which case such
expense will be subject to the Operating Expense Limitation Agreement and
recoupment by Rafferty in accordance with the Agreement. This Agreement may be
terminated or revised at any time with the consent of the Board of
Trustees.
Paul
Brigandi and Tony Ng are jointly and primarily responsible for the day-to-day
management of the Funds (the “Portfolio Managers”). An
investment trading team of Rafferty employees assists the Portfolio Managers in
the day-to-day management of the Funds subject to their primary responsibility
and oversight. The Portfolio Managers work with the investment trading team to
decide the target allocation of each Fund’s investments and on a day-to-day
basis, an individual portfolio trader executes transactions for the Funds
consistent with the target allocation. The members of the investment trading
team rotate periodically among the various series of the Trust, including the
Funds, so that no single individual is assigned to a specific Fund for extended
periods of time.
Mr.
Brigandi has been a Portfolio Manager at Rafferty since June 2004. Mr. Brigandi
was previously involved in the equity trading training
program for Fleet Boston Financial Corporation from August 2002 to April 2004.
Mr. Brigandi is a 2002 graduate of Fordham University.
Mr.
Ng has been a Portfolio Manager at Rafferty since April 2006. Mr. Ng was
previously a Team Leader in the Trading Assistant Group
with Goldman Sachs from 2004 to 2006. He was employed with Deutsche Asset
Management from 1998 to 2004. Mr. Ng graduated from State University of New York
at Buffalo in 1998.
The
Funds' SAI provides additional information about the investment team members’
compensation, other accounts they manage and their
ownership of securities in the Funds.
Portfolio
Holdings
A
description of the Funds' policies and procedures with respect to the disclosure
of the Funds' portfolio securities is available in the Funds'
SAI. Currently, disclosure of the Funds' holdings is required to be made
quarterly within 60 days of the end of each fiscal quarter in the Annual Report
and Semi-Annual Report to Fund shareholders and in the quarterly holdings report
on Form N-PORT. The Annual and Semi-Annual Reports will be available by
contacting the Direxion Funds, c/o U.S. Bancorp Fund Services, LLC, P.O. Box
701, Milwaukee, Wisconsin 53201-0701 or calling (800) 851-0511.
other
service providers
Foreside
Fund Services, LLC (“Distributor”) serves as the Funds' distributor. U.S.
Bancorp Fund Services, LLC (“USBFS”) serves as the Funds'
administrator, fund accountant and transfer agent. U.S. Bank, N.A., an affiliate
of USBFS, serves as the Funds' custodian.
Distributions
and Taxes
Distributions. Each Fund
distributes dividends from its net investment income at least annually. Net
investment income generally consists of interest income and dividends received
on investments, less expenses.
Direxion
Funds Prospectus
66
Each
Fund also distributes any realized net capital gains and net gains from foreign
currency transactions, if any, at least annually. A Fund
realizes capital gains mainly from sales of its portfolio assets for a
profit.
Dividends
and other distributions (collectively, “distributions”) will be reinvested in
additional distributing Fund shares automatically at
a Fund’s NAV per share unless you request otherwise in writing or via telephone
at least five days prior to the record date of the distribution. Each Fund
reserves the right, if you elect to receive distributions from the Fund by check
and the U.S. Postal Service cannot deliver the check or the check remains
uncashed for six months, to reinvest the amount of the check in your account,
without interest, in additional Fund shares at the Fund’s then-current NAV per
share and to reinvest all subsequent distributions in shares of the Fund until
an updated address is received. The check will not be held separate from the
shares in your account.
Due
to the pattern of purchases and redemptions of the Funds, a Fund’s total net
assets may fluctuate significantly over the course of a
year. Because a Fund may declare and pay distributions at any time, an investor
may receive a distribution, which may be taxable, shortly after making an
investment in a Fund.
Taxes. Federal income
tax consequences of a distribution will vary depending on whether the
distribution is from net investment income, net foreign currency gains, or net
capital gains and, in the latter case, how long a Fund has held the assets the
sale of which generated the gains, not how long you held your Fund shares.
Distributions of net gains on sales of assets held for one year or less, and
distributions of certain foreign currency gains, are taxed as dividends (that
is, ordinary income). Distributions of gains on sales of assets held longer than
one year (long-term capital gains), and distributions of other foreign currency
gains are taxed at lower capital gains rates.
The
following table illustrates the potential tax consequences for taxable accounts
(of individual shareholders):
|
Type
of Transaction |
Federal Tax
Rate/Treatment* |
|
Dividend
(other than “qualified dividend
income”
(“QDI”) (see below)) distribution |
Ordinary
income rate |
|
Distribution
of QDI |
Long-term
capital gains rate |
|
Distribution
of net short-term capital gains |
Ordinary
income rate |
|
Distribution
of net long-term capital gains |
Long-term
capital gains rate |
|
Redemption
or exchange of Fund shares
owned
for more than one year |
Long-term
capital gain or loss |
|
Redemption
or exchange of Fund shares
owned
for one year or less |
Gain
is taxed at the same rate as ordinary
income;
loss is subject to special
rules |
*
Tax consequences
for tax-deferred retirement accounts (such as 401(k) plan accounts and IRAs) or
non-taxable shareholders will be different. You should consult your tax
specialist for more information about your personal situation.
QDI
consists of dividends a Fund receives from most U.S. corporations and “qualified
foreign corporations,” provided that the Fund
satisfies certain holding periods and other restrictions regarding the stock on
which the dividends were paid. (Dividends received from other investment
companies, including ETFs that are taxed as RICs will only qualify for QDI
treatment to the extent that the other investment company reports the qualifying
portion to its shareholders in writing.) A Fund’s dividends attributable to its
QDI are taxed to individual shareholders at the long-term capital gains rates
(see the next paragraph) for shareholders who satisfy those restrictions
regarding their Fund shares. A portion of a Fund’s dividends (excluding
dividends from foreign corporations) also may be eligible for the
dividends-received deduction allowed to corporations, subject to similar
restrictions.
Net
capital gain (i.e., the excess of
net long-term capital gain over net short-term capital loss) an individual or
certain other non-corporate shareholder realizes on a redemption or exchange of
Fund shares, is subject to federal income tax at a maximum rate of 15% or 20%
for those non-corporate shareholders with taxable income exceeding certain
thresholds.
If
you are a non-retirement account shareholder of a Fund, then each year we will
send you a Form 1099 that tells you the amount of Fund
distributions you received for the prior calendar year, the tax status of those
distributions and a list of reportable redemption transactions, including, for
redeemed shares that were acquired after December 31, 2011 (“Covered Shares”),
basis information and whether they had a short-term (one year or less) or
long-term (more than one year) holding period. Normally, distributions are
taxable in the year you receive them. However, any distributions declared in the
last three months of a calendar year and paid in January of the following year
generally are taxable as if received on December 31 of the year they are
declared.
If
you are a taxable non-corporate shareholder of a Fund and do not provide the
Fund with your correct taxpayer identification number (normally
your social security number), the Fund is required to withhold and remit to the
Internal Revenue Service (“IRS”) 24% of all dividends and other distributions
and redemption proceeds (regardless of whether you realize a gain or loss)
otherwise payable to you. If you are such a shareholder and are otherwise
subject to backup withholding, we also are required to withhold and remit to the
IRS the same percentage of all dividends and other distributions otherwise
payable to you. Any tax withheld may be applied against your tax liability when
you file your tax return.
A
shareholder’s basis in Covered Shares will be determined in accordance with the
Funds' default method, which currently is average basis,
unless the shareholder affirmatively elects in writing (which may be electronic)
to use a different acceptable
67
Direxion
Funds Prospectus
basis
determination method, such as a specific identification method. The basis
determination method a Fund shareholder elects may not be
changed with respect to a redemption of Covered Shares after the settlement date
of the redemption. Fund shareholders should consult with their tax advisors to
determine the best IRS-accepted basis method for their tax situation and to
obtain more information about how the basis reporting law applies to
them.
An
individual must pay a 3.8% federal tax on the lesser of (1) the individual’s
“net investment income,” which generally includes
dividends, interest, and net gains from the disposition of investment property
(including dividends and capital gain distributions a Fund pays), or (2) the
excess of the individual’s “modified adjusted gross income” over a threshold
amount ($250,000 for married persons filing jointly and $200,000 for single
taxpayers). This tax is in addition to any other taxes due on that income. A
similar tax will apply for those years to estates and trusts. Shareholders
should consult their own tax advisers regarding the effect, if any, this
provision may have on their investment in Fund shares.
Additional
Information
ABOUT THE TRUST
The
Trust enters into contractual arrangements with various parties, which may
include, among others, the Funds' investment adviser,
custodian, and transfer agent, who provide services to the Funds. Shareholders
are not parties to any such contractual arrangements and are not intended
beneficiaries of those contractual arrangements, and those contractual
arrangements are not intended to create in any shareholder any right to enforce
them against the service providers or to seek any remedy under them against the
service providers, either directly or on behalf of the Trust.
This
Prospectus provides information concerning the Funds that you should consider in
determining whether to purchase Fund shares.
Neither this Prospectus nor the SAI is intended, or should be read, to be or
give rise to an agreement or contract between the Trust or the Funds and any
investor, or to give rise to any rights in any shareholder or other person other
than any rights under federal or state law that may not be waived.
Index
Licensors
ICE
Data Indices, LLC (“ICE Data”). ICE Data is
used with permission. ICE U.S. Treasury 7-10 Year Bond Index (the “ICE Index”)
is a service/trade mark of ICE Data Indices, LLC or its affiliates and has been
licensed for use by Rafferty Asset Management, LLC in connection with Direxion
Monthly 7-10 Year Treasury Bull 1.75X Fund and Direxion Monthly 7-10 Year
Treasury Bear 1.75X Fund (the “Product”). Neither Rafferty Asset Management, LLC
(the “Licensee”), the Direxion Shares ETF Trust (the “Trust”) nor the Product,
as applicable, is sponsored, endorsed, sold or promoted by ICE Data Indices,
LLC, its affiliates or its Third Party Suppliers (“ICE Data and its Suppliers”).
ICE Data and its Suppliers make no representations or warranties regarding the
advisability of investing in securities generally, in the Product particularly,
the Trust or the ability of the Index to track general stock market performance.
ICE Data’s only relationship to Rafferty Asset Management, LLC is the licensing
of certain trademarks and trade names and the Index or components thereof. The
Index is determined, composed and calculated by ICE Data without regard to the
Licensee or the Product or its holders. ICE Data has no obligation to take the
needs of the Licensee or the holders of the Product into consideration in
determining, composing or calculating the Index. ICE Data is not responsible for
and has not participated in the determination of the timing of, prices of, or
quantities of the Product to be issued or in the determination or calculation of
the equation by which the Product is to be priced, sold, purchased, or redeemed.
Except for certain custom index calculation services, all information provided
by ICE Data is general in nature and not tailored to the needs of Licensee or
any other person, entity or group of persons. ICE Data has no obligation or
liability in connection with the administration, marketing, or trading of the
Product. ICE Data is not an investment advisor. Inclusion of a security within
an index is not a recommendation by ICE Data to buy, sell, or hold such
security, nor is it considered to be investment advice.
ICE
DATA AND ITS SUPPLIERS DISCLAIM ANY AND ALL WARRANTIES AND REPRESENTATIONS,
EXPRESS AND/OR IMPLIED, INCLUDING ANY
WARRANTIES OF MERCHANTABILITY OR FITNESS FOR A PARTICULAR PURPOSE OR USE,
INCLUDING THE INDICES, INDEX DATA AND ANY INFORMATION INCLUDED IN, RELATED TO,
OR DERIVED THEREFROM (“INDEX DATA”). ICE DATA AND ITS SUPPLIERS SHALL NOT BE
SUBJECT TO ANY DAMAGES OR LIABILITY WITH RESPECT TO THE ADEQUACY, ACCURACY,
TIMELINESS OR COMPLETENESS OF THE INDICES AND THE INDEX DATA, WHICH ARE PROVIDED
ON AN “AS IS” BASIS AND YOUR USE IS AT YOUR OWN RISK.
NASDAQ
Index. The
NASDAQ-100® Index is not
sponsored, endorsed, sold or promoted by The NASDAQ OMX Group, Inc. or its
affiliates (NASDAQ OMX, with its affiliates, are referred to as the
“Corporations”). The Corporations have not passed on the legality or suitability
of, or the accuracy or adequacy of descriptions and disclosures relating to, the
Direxion Monthly NASDAQ-100® Bull 1.75X Fund.
The Corporations make no representation or warranty, express or implied to the
owners of the Direxion Monthly NASDAQ-100® Bull 1.75X Fund
or any member of the public regarding the advisability of investing in
securities generally or in the Direxion Monthly NASDAQ-100® Bull 1.75X Fund
particularly, or the ability of the NASDAQ-100® Index to track
general stock market performance. The Corporations’ only relationship to
Rafferty Asset Management, LLC (“Licensee”) is in the licensing of the
NASDAQ®, OMX®, NASDAQ
OMX®, and
NASDAQ-100® Index, Index
registered
Direxion
Funds Prospectus
68
trademarks,
and certain trade names and service marks of the Corporations and the use of the
NASDAQ-100® Index which is
determined, composed and calculated by NASDAQ OMX without regard to Licensee or
the Direxion Monthly NASDAQ-100® Bull 1.75X Fund.
NASDAQ OMX has no obligation to take the needs of the Licensee or the owners of
the Direxion Monthly NASDAQ-100® Bull 1.75X Fund
into consideration in determining, composing or calculating the
NASDAQ-100®
Index. The
Corporations are not responsible for and have not participated in the
determination of the timing of, prices at, or quantities of the Direxion Monthly
NASDAQ-100® Bull 1.75X Fund
to be issued or in the determination or calculation of the equation by which the
Direxion Monthly NASDAQ-100® Bull 1.75X Fund
is to be converted into cash. The Corporations have no liability in connection
with the administration, marketing or trading of the Direxion Monthly
NASDAQ-100® Bull 1.75X
Fund.
THE
CORPORATIONS DO NOT GUARANTEE THE ACCURACY AND/OR UNINTERRUPTED CALCULATION OF
THE NASDAQ-100® INDEX OR ANY
DATA INCLUDED THEREIN. THE CORPORATIONS MAKE NO WARRANTY, EXPRESS OR IMPLIED, AS
TO RESULTS TO BE OBTAINED BY LICENSEE, OWNERS OF THE NASDAQ-100® INDEX, OR ANY
OTHER PERSON OR ENTITY FROM THE USE OF THE NASDAQ-100® INDEX OR ANY
DATA INCLUDED THEREIN. THE CORPORATIONS MAKE NO EXPRESS OR IMPLIED WARRANTIES,
AND EXPRESSLY DISCLAIM ALL WARRANTIES OF MERCHANTABILITY OR FITNESS FOR A
PARTICULAR PURPOSE OR USE WITH RESPECT TO THE NASDAQ-100® INDEX OR ANY
DATA INCLUDED THEREIN. WITHOUT LIMITING ANY OF THE FOREGOING, IN NO EVENT SHALL
THE CORPORATIONS HAVE ANY LIABILITY FOR ANY LOST PROFITS OR SPECIAL, INCIDENTAL,
PUNITIVE, INDIRECT, OR CONSEQUENTIAL DAMAGES, EVEN IF NOTIFIED OF THE
POSSIBILITY OF SUCH DAMAGES.
FTSE/Russell
Index. The Direxion
Monthly Small Cap Bull 1.75X Fund is not sponsored, endorsed, sold or promoted
by Frank Russell Company (“Russell”). Russell makes no representation or
warranty, express or implied, to the owners of the Direxion Monthly Small Cap
Bull 1.75X Fund or any member of the public regarding the advisability of
investing in securities generally or in the Direxion Monthly Small Cap Bull
1.75X Fund particularly or the ability of the Russell 2000® Index to track general stock
market performance or a segment of the same. Russell’s publication of the
Russell 2000® Index in no way suggests or
implies an opinion by Russell as to the advisability of investment in any or all
of the securities upon which the Russell 2000® Index is based. Russell’s only
relationship to the Trust is the licensing of certain trademarks and trade names
of Russell and of the Russell 2000® Index which is determined,
composed and calculated by Russell without regard to the Trust or Direxion
Monthly Small Cap Bull 1.75X Fund. Russell is not responsible for and has not
reviewed the Trust or Direxion Monthly Small Cap Bull 1.75X Fund nor any
associated literature or publications and Russell makes no representation or
warranty express or implied as to their accuracy or completeness, or otherwise.
Russell reserves the right, at any time and without notice, to alter, amend,
terminate or in any way change the Russell 2000® Index. Russell has no obligation
or liability in connection with the administration, marketing or trading of the
Direxion Monthly Small Cap Bull 1.75X Fund.
RUSSELL
DOES NOT GUARANTEE THE ACCURACY AND/OR THE COMPLETENESS OF THE RUSSELL
2000® INDEX OR ANY
DATA INCLUDED THEREIN AND RUSSELL SHALL HAVE NO LIABILITY FOR ANY ERRORS,
OMISSIONS, OR INTERRUPTIONS THEREIN. RUSSELL MAKES NO WARRANTY, EXPRESS OF
IMPLIED, AS TO RESULTS TO BE OBTAINED BY THE TRUST, INVESTORS, OWNERS OF THE
DIREXION DAILY SMALL CAP BULL 1.75X FUND AND THE DIREXION DAILY SMALL CAP BEAR
1.75X FUND, OR ANY OTHER PERSON OR ENTITY FROM THE USE OF THE RUSSELL
2000® INDEX OR ANY
DATA INCLUDED THEREIN. RUSSELL MAKES NO EXPRESS OR IMPLIED WARRANTIES, AND
EXPRESSLY DISCLAIMS ALL WARRANTIES OF MERCHANTABILITY OR FITNESS FOR A
PARTICULAR PURPOSE OR USE WITH RESPECT TO THE RUSSELL 2000® INDEX OR ANY
DATA INCLUDED THEREIN. WITHOUT LIMITING ANY OF THE FOREGOING, IN NO EVENT SHALL
RUSSELL HAVE ANY LIABILITY FOR ANY SPECIAL, PUNITIVE, INDIRECT, OR CONSEQUENTIAL
DAMAGES (INCLUDING LOST PROFITS), EVEN IF NOTIFIED OF THE POSSIBILITY OF SUCH
DAMAGES.
Standard
and Poor’s Index. The S&P
500® Index (the
“S&P Index”) is a trademark of S&P Global Inc. (“S&P Global”), and
has been licensed for use by the Trust. The Funds are not sponsored, endorsed,
sold or promoted by S&P Global or its third party licensors. Neither S&P
Global nor its third party licensors makes any representation or warranty,
express or implied, to the owners of the Funds or any member of the public
regarding the advisability of investing in securities generally or in the Funds
particularly or the ability of the S&P Index to track general stock market
performance. S&P Global’s only relationship to the Funds is the licensing of
certain trademarks and trade names of S&P Global and the third party
licensors and of the S&P Index which are determined, composed and calculated
by S&P Global or its third party licensors without regard to the Funds.
S&P Global has no obligation to take the needs of the Funds or the owners of
the Funds into consideration in determining, composing or calculating the
S&P Index. S&P Global is not responsible for and has not participated in
the determination of the prices and amount of the Funds or the timing of the
issuance or sale of the Funds or in the determination of the net asset value of
the Funds. S&P Global has no obligation or liability in connection with the
administration, marketing or trading of the Funds.
NEITHER
S&P GLOBAL, ITS AFFILIATES NOR THEIR THIRD PARTY LICENSORS GUARANTEE THE
ADEQUACY, ACCURACY, TIMELINESS OR COMPLETENESS
OF THE S&P INDEX OR ANY DATA INCLUDED THEREIN OR ANY COMMUNICATIONS,
INCLUDING BUT NOT LIMITED TO, ORAL OR WRITTEN COMMUNICATIONS (INCLUDING
ELECTRONIC COMMUNICATIONS) WITH RESPECT THERETO. S&P GLOBAL, ITS AFFILIATES
AND THEIR THIRD PARTY LICENSORS SHALL NOT BE SUBJECT TO ANY DAMAGES OR LIABILITY
FOR ANY ERRORS, OMISSIONS OR DELAYS THEREIN. S&P GLOBAL MAKES NO EXPRESS OR
IMPLIED WARRANTIES, AND EXPRESSLY DISCLAIMS ALL WARRANTIES OF MERCHANTABILITY OR
FITNESS FOR A PARTICULAR PURPOSE OR USE WITH RESPECT TO THE MARKS, THE S&P
INDEX OR ANY DATA INCLUDED THEREIN. WITHOUT LIMITING ANY OF THE FOREGOING,
69
Direxion
Funds Prospectus
IN
NO EVENT WHATSOEVER SHALL S&P GLOBAL, ITS AFFILIATES OR THEIR THIRD PARTY
LICENSORS BE LIABLE FOR ANY INDIRECT,
SPECIAL, INCIDENTAL, PUNITIVE OR CONSEQUENTIAL DAMAGES, INCLUDING BUT NOT
LIMITED TO, LOSS OF PROFITS, TRADING LOSSES, LOST TIME OR GOODWILL, EVEN IF THEY
HAVE BEEN ADVISED OF THE POSSIBILITY OF SUCH DAMAGES, WHETHER IN CONTRACT, TORT,
STRICT LIABILITY OR OTHERWISE.
Direxion
Funds Prospectus
70
Financial
Highlights
The
financial highlights table is intended to help you understand the financial
performance of the Funds for the periods indicated. The information set forth
below has been derived from the financial statements which were audited by
Ernst & Young LLP, Independent Registered Public Accounting Firm, whose
report, along with the Funds' financial statements, are included in the Annual
shareholder report, which is available upon request and incorporated by
reference into the Funds' SAI. Certain information reflects financial results
for a single share. The total returns in the table represent the rate that an
investor would have earned (or lost) on an investment in each Fund (assuming
reinvestment of all dividends and other distributions).
|
|
|
|
|
|
|
|
|
|
|
|
|
|
Net
Asset
Value,
Beginning
of
Year/Period |
Net
Investment
Income
(Loss)1,2 |
Net
Investment
Income
(Loss)1,3 |
Net
Realized
and
Unrealized
Gain
(Loss)
on
Investments4 |
Net
Increase
(Decrease)
in
Net
Asset
Value
Resulting
from
Operations |
Dividends
from
Net
Investment
Income |
Distributions
from
Realized
Capital
Gains |
Return
of
Capital
Distributions |
Total
Distributions |
Net
Asset
Value,
End
of
Year/Period |
|
Direxion
Monthly NASDAQ-100®
Bull 1.75X Fund |
|
|
|
|
|
|
|
|
|
|
|
Year
ended August 31, 2023 |
$42.30 |
0.59 |
0.61 |
16.09 |
16.68 |
– |
– |
– |
– |
$58.98 |
|
Year
ended August 31, 2022 |
$81.98 |
(0.62
) |
(0.62
) |
(29.72
) |
(30.34
) |
– |
(9.34
) |
– |
(9.34
) |
$42.30 |
|
Year
ended August 31, 2021 |
$57.31 |
(0.80
) |
(0.79
) |
31.52 |
30.73 |
– |
(6.06
) |
– |
(6.06
) |
$81.98 |
|
Year
ended August 31, 2020 |
$24.97 |
(0.24
) |
(0.22
) |
32.74 |
32.50 |
(0.16
) |
– |
– |
(0.16
) |
$57.31 |
|
Year
ended August 31, 2019 |
$29.61 |
0.14 |
0.22 |
(2.34
) |
(2.20
) |
– |
(2.44
) |
– |
(2.44
) |
$24.97 |
|
Direxion
Monthly S&P 500®
Bull 1.75X Fund |
|
|
|
|
|
|
|
|
|
|
|
Year
ended August 31, 2023 |
$40.98 |
0.65 |
0.68 |
7.59 |
8.24 |
– |
– |
– |
– |
$49.22 |
|
Year
ended August 31, 2022 |
$59.67 |
(0.50
) |
(0.49
) |
(13.39
) |
(13.89
) |
– |
(4.80
) |
– |
(4.80
) |
$40.98 |
|
Year
ended August 31, 2021 |
$37.00 |
(0.55
) |
(0.55
) |
23.93 |
23.38 |
– |
(0.71
) |
– |
(0.71
) |
$59.67 |
|
Year
ended August 31, 2020 |
$27.44 |
(0.06
) |
(0.06
) |
9.91 |
9.85 |
(0.29
) |
– |
– |
(0.29
) |
$37.00 |
|
Year
ended August 31, 2019 |
$31.64 |
0.18 |
0.26 |
(1.34
) |
(1.16
) |
(0.0000
)8 |
(3.04
) |
– |
(3.04
) |
$27.44 |
|
Direxion
Monthly Small Cap Bull 1.75X Fund |
|
|
|
|
|
|
|
|
|
|
|
Year
ended August 31, 2023 |
$71.90 |
1.07 |
1.10 |
(1.44
) |
(0.38
) |
– |
– |
– |
– |
$71.53 |
|
Year
ended August 31, 2022 |
$115.43 |
(0.96
) |
(0.96
) |
(41.64
) |
(42.60
) |
– |
(0.93
) |
– |
(0.93
) |
$71.90 |
|
Year
ended August 31, 2021 |
$56.90 |
(1.26
) |
(1.26
) |
59.79 |
58.53 |
– |
– |
– |
– |
$115.43 |
|
Year
ended August 31, 2020 |
$59.38 |
(0.13
) |
(0.11
) |
(1.73
) |
(1.85
) |
(0.63
) |
– |
– |
(0.63
) |
$56.90 |
|
Year
ended August 31, 2019 |
$97.04 |
0.61 |
0.67 |
(31.52
) |
(30.91
) |
(0.07
) |
(6.68
) |
– |
(6.75
) |
$59.38 |
|
Direxion
Monthly 7-10 Year Treasury Bull 1.75X Fund |
|
|
|
|
|
|
|
|
|
|
|
Year
ended August 31, 2023 |
$27.88 |
0.56 |
0.57 |
(3.86
) |
(3.30
) |
– |
– |
– |
– |
$24.58 |
|
Year
ended August 31, 2022 |
$37.54 |
(0.26
) |
(0.26
) |
(9.40
) |
(9.66
) |
– |
– |
– |
– |
$27.88 |
|
Year
ended August 31, 2021 |
$42.14 |
(0.40
) |
(0.40
) |
(2.92
) |
(3.32
) |
– |
(1.28
) |
– |
(1.28
) |
$37.54 |
|
Year
ended August 31, 2020 |
$40.78 |
(0.21
) |
(0.21
) |
4.72 |
4.51 |
(0.47
) |
(2.68
) |
– |
(3.15
) |
$42.14 |
|
Year
ended August 31, 2019 |
$32.92 |
0.30 |
0.31 |
7.56 |
7.86 |
– |
– |
– |
– |
$40.78 |
|
Direxion
Monthly 7-10 Year Treasury Bear 1.75X Fund |
|
|
|
|
|
|
|
|
|
|
|
Year
ended August 31, 2023 |
$27.27 |
0.90 |
0.92 |
3.15 |
4.05 |
– |
– |
– |
– |
$31.32 |
|
Year
ended August 31, 2022 |
$21.43 |
(0.24
) |
(0.23
) |
6.08 |
5.84 |
– |
– |
– |
– |
$27.27 |
|
Year
ended August 31, 2021 |
$20.65 |
(0.29
) |
(0.29
) |
1.07 |
0.78 |
– |
– |
– |
– |
$21.43 |
|
Year
ended August 31, 2020 |
$24.34 |
(0.06
) |
(0.06
) |
(3.31
) |
(3.37
) |
(0.32
) |
– |
– |
(0.32
) |
$20.65 |
|
Year
ended August 31, 2019 |
$30.56 |
0.26 |
0.26 |
(6.48
) |
(6.22
) |
– |
– |
– |
– |
$24.34 |
71
Direxion
Funds Prospectus
Financial
Highlights (continued)
|
|
|
|
RATIOS
TO AVERAGE NET ASSETS7 |
Portfolio
Turnover
Rate7 | |||||
|
|
Total
Return5 |
Net
Assets,
End
of
Year/Period
(,000) |
Total
Expenses2 |
Net
Expenses2,6 |
Net
Investment
Income
(Loss)
after
Expense
Reimbursement
/Recoupment2 |
Total
Expenses3 |
Net
Expenses3,6 |
Net
Investment
Income
(Loss)
after
Expense
Reimbursement
/Recoupment3 | |
|
Direxion
Monthly NASDAQ-100®
Bull 1.75X Fund |
|
|
|
|
|
|
|
|
|
|
Year
ended August 31, 2023 |
39.42
% |
$360,701 |
1.43
% |
1.41
% |
1.32
% |
1.37
% |
1.35
% |
1.38
% |
0
% |
|
Year
ended August 31, 2022 |
(42.34
)% |
$273,423 |
1.33
% |
1.34
% |
(0.99
)% |
1.32
% |
1.33
% |
(0.98
)% |
0
% |
|
Year
ended August 31, 2021 |
59.47
% |
$595,324 |
1.33
% |
1.36
% |
(1.29
)% |
1.32
% |
1.35
% |
(1.28
)% |
0
% |
|
Year
ended August 31, 2020 |
130.64
% |
$427,572 |
1.42
% |
1.40
% |
(0.71
)% |
1.37
% |
1.35
% |
(0.66
)% |
124
% |
|
Year
ended August 31, 2019 |
(6.42
)% |
$181,532 |
1.69
% |
1.66
% |
0.59
% |
1.38
% |
1.35
% |
0.90
% |
0
% |
|
Direxion
Monthly S&P 500®
Bull 1.75X Fund |
|
|
|
|
|
|
|
|
|
|
Year
ended August 31, 2023 |
20.11
% |
$83,188 |
1.51
% |
1.42
% |
1.54
% |
1.44
% |
1.35
% |
1.61
% |
0
% |
|
Year
ended August 31, 2022 |
(25.79
)% |
$85,872 |
1.36
% |
1.36
% |
(0.96
)% |
1.35
% |
1.35
% |
(0.95
)% |
0
% |
|
Year
ended August 31, 2021 |
64.19
% |
$124,964 |
1.33
% |
1.35
% |
(1.22
)% |
1.33
% |
1.35
% |
(1.22
)% |
0
% |
|
Year
ended August 31, 2020 |
36.00
% |
$93,419 |
1.42
% |
1.37
% |
(0.21
)% |
1.40
% |
1.35
% |
(0.19
)% |
221
% |
|
Year
ended August 31, 2019 |
(2.70
)% |
$60,598 |
1.68
% |
1.64
% |
0.65
% |
1.39
% |
1.35
% |
0.94
% |
0
% |
|
Direxion
Monthly Small Cap Bull 1.75X Fund |
|
|
|
|
|
|
|
|
|
|
Year
ended August 31, 2023 |
(0.52
)% |
$11,017 |
1.78
% |
1.41
% |
1.54
% |
1.72
% |
1.35
% |
1.60
% |
24
% |
|
Year
ended August 31, 2022 |
(37.17
)% |
$10,577 |
1.60
% |
1.35
% |
(1.01
)% |
1.60
% |
1.35
% |
(1.01
)% |
33
% |
|
Year
ended August 31, 2021 |
102.87
% |
$23,514 |
1.54
% |
1.35
% |
(1.28
)% |
1.54
% |
1.35
% |
(1.28
)% |
0
% |
|
Year
ended August 31, 2020 |
(3.35
)% |
$13,962 |
1.66
% |
1.38
% |
(0.22
)% |
1.63
% |
1.35
% |
(0.19
)% |
172
% |
|
Year
ended August 31, 2019 |
(32.04
)% |
$13,647 |
1.65
% |
1.43
% |
0.86
% |
1.57
% |
1.35
% |
0.94
% |
0
% |
|
Direxion
Monthly 7-10 Year Treasury Bull 1.75X Fund |
|
|
|
|
|
|
|
|
|
|
Year
ended August 31, 2023 |
(11.82
)% |
$3,533 |
1.73
% |
1.37
% |
2.13
% |
1.71
% |
1.35
% |
2.15
% |
351
% |
|
Year
ended August 31, 2022 |
(25.74
)% |
$5,146 |
1.66
% |
1.35
% |
(0.77
)% |
1.66
% |
1.35
% |
(0.77
)% |
144
% |
|
Year
ended August 31, 2021 |
(8.06
)% |
$25,364 |
1.44
% |
1.35
% |
(1.04
)% |
1.44
% |
1.35
% |
(1.04
)% |
0
% |
|
Year
ended August 31, 2020 |
12.49
% |
$49,645 |
1.49
% |
1.36
% |
(0.51
)% |
1.48
% |
1.35
% |
(0.50
)% |
74
% |
|
Year
ended August 31, 2019 |
23.88
% |
$47,172 |
1.56
% |
1.39
% |
0.83
% |
1.52
% |
1.35
% |
0.87
% |
0
% |
|
Direxion
Monthly 7-10 Year Treasury Bear 1.75X Fund |
|
|
|
|
|
|
|
|
|
|
Year
ended August 31, 2023 |
14.84
% |
$15,151 |
2.16
% |
1.42
% |
2.99
% |
2.09
% |
1.35
% |
3.06
% |
0
% |
|
Year
ended August 31, 2022 |
27.26
% |
$2,650 |
2.28
% |
1.37
% |
(0.99
)% |
2.26
% |
1.35
% |
(0.97
)% |
0
% |
|
Year
ended August 31, 2021 |
3.76
% |
$9,273 |
2.57
% |
1.35
% |
(1.34
)% |
2.57
% |
1.35
% |
(1.34
)% |
0
% |
|
Year
ended August 31, 2020 |
(14.07
)% |
$1,337 |
4.34
% |
1.35
% |
(0.26
)% |
4.34
% |
1.35
% |
(0.26
)% |
0
% |
|
Year
ended August 31, 2019 |
(20.35
)% |
$2,332 |
3.54
% |
1.35
% |
0.89
% |
3.54
% |
1.35
% |
0.89
% |
0
% |
1
Net investment
income (loss) per share represents net investment income (loss) divided by the
daily average shares of beneficial interest outstanding throughout each
year.
2
Includes interest
expense and extraordinary expense which is comprised of excise tax
expense.
3
Excludes interest
expense and extraordinary expense which is comprised of excise tax
expense.
4
Due to the timing
of sales and redemptions of capital shares, the net realized and unrealized gain
(loss) per share will not equal the Fund's changes in net realized and
unrealized gain (loss) on investments, futures and swaps for the
period.
Direxion
Funds Prospectus
72
Financial
Highlights (continued)
5
Total return is
calculated assuming an initial investment made at the net asset value at the
beginning of the period, reinvestment of all dividends and distributions at the
net asset value during the period and redemption on the last day of the period.
Total return calculated for a period of less than one year is not annualized.
The total return would have been lower if certain expenses had not been
reimbursed by the investment adviser.
6
Net expenses
include effects of any reimbursement or recoupment.
7
Portfolio turnover is not
annualized and does not include effects of turnover of the swap or future
contracts portfolio. Short-term securities with maturities less than or equal to
365 days are also excluded from portfolio turnover calculation.
8
Amount is less than $0.01 per
share.
73
Direxion
Funds Prospectus
Prospectus
|
1301
Avenue of the Americas (6th Avenue), 28th Floor |
New
York, New York 10019 |
(800)
851-0511 |
Investor
Class
More
Information On The Direxion Funds
Statement
of Additional Information (“SAI”):
The
Funds' SAI contains more information on the Funds and their applicable
investment policies. The SAI
is incorporated in this Prospectus by reference (meaning it is legally part of
this Prospectus). A current SAI is on file with the Securities and Exchange
Commission (“SEC”).
Annual
and Semi-Annual Reports to Shareholders:
The
Funds' reports provide additional information on the Funds' investment holdings,
performance data
and a letter discussing the market conditions and investment strategies that
significantly affected the Funds' performance during that period.
To
Obtain the SAI or Fund Reports Free of Charge or for Shareholder
Inquiries:
|
Write
to: |
Direxion
Funds
P.O.
Box 701
Milwaukee,
Wisconsin 53201-0701 |
|
Call: |
(800)
851-0511 |
|
By
Internet: |
www.direxion.com |
Reports
and other information about the Funds may be viewed on screen or downloaded
from
the EDGAR Database on the SEC’s website at http://www.sec.gov. Copies of these
documents may be obtained, after paying a duplicating fee, by electronic request
at the following e-mail address: [email protected].
Foreside Fund
Services, LLC
3 Canal Plaza, Suite 100
Portland, Maine 04101
3 Canal Plaza, Suite 100
Portland, Maine 04101
SEC
File Number: 811-08243